. 2015 Jun;35(6):441-53.
doi: 10.1089/jir.2014.0168. Epub 2015 Feb 25.

The Extracellular IFI16 Protein Propagates Inflammation in Endothelial Cells Via p38 MAPK and NF-κB p65 Activation

Affiliations

The Extracellular IFI16 Protein Propagates Inflammation in Endothelial Cells Via p38 MAPK and NF-κB p65 Activation

Mandar Bawadekar et al. J Interferon Cytokine Res. 2015 Jun.

Abstract

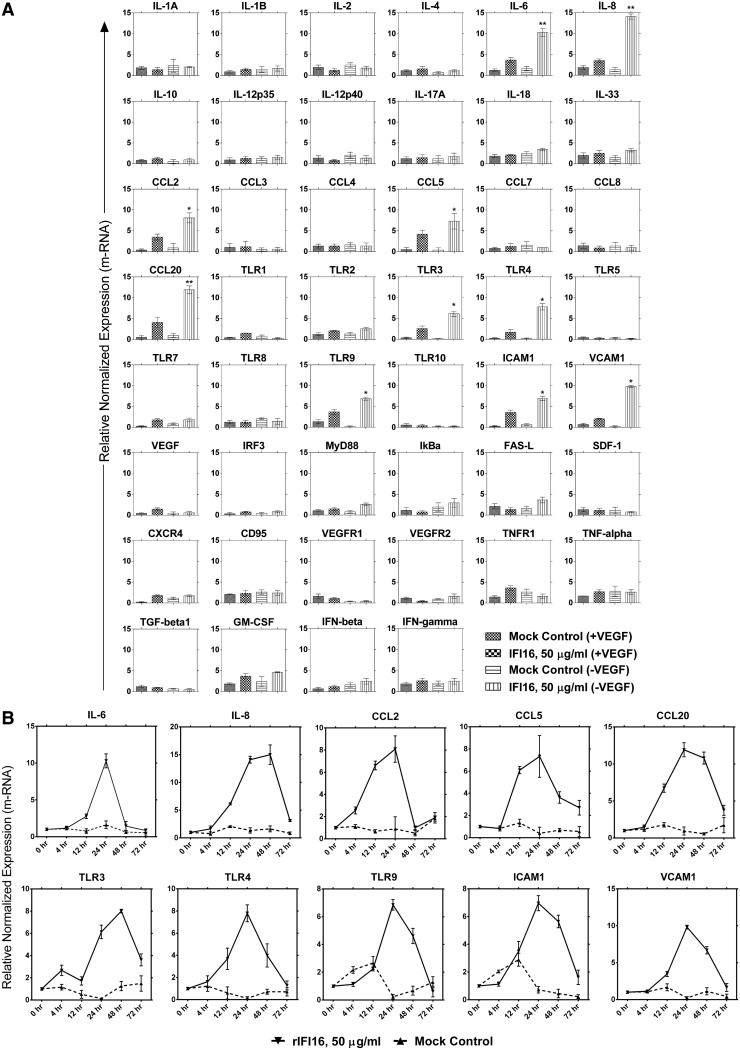
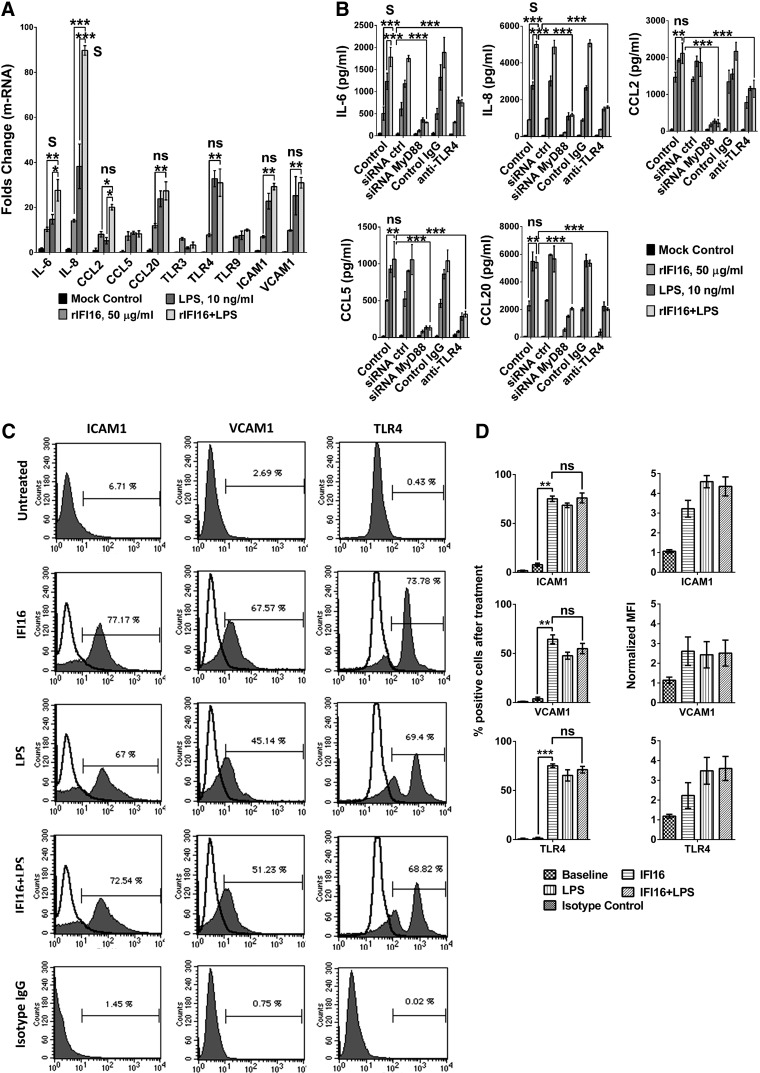
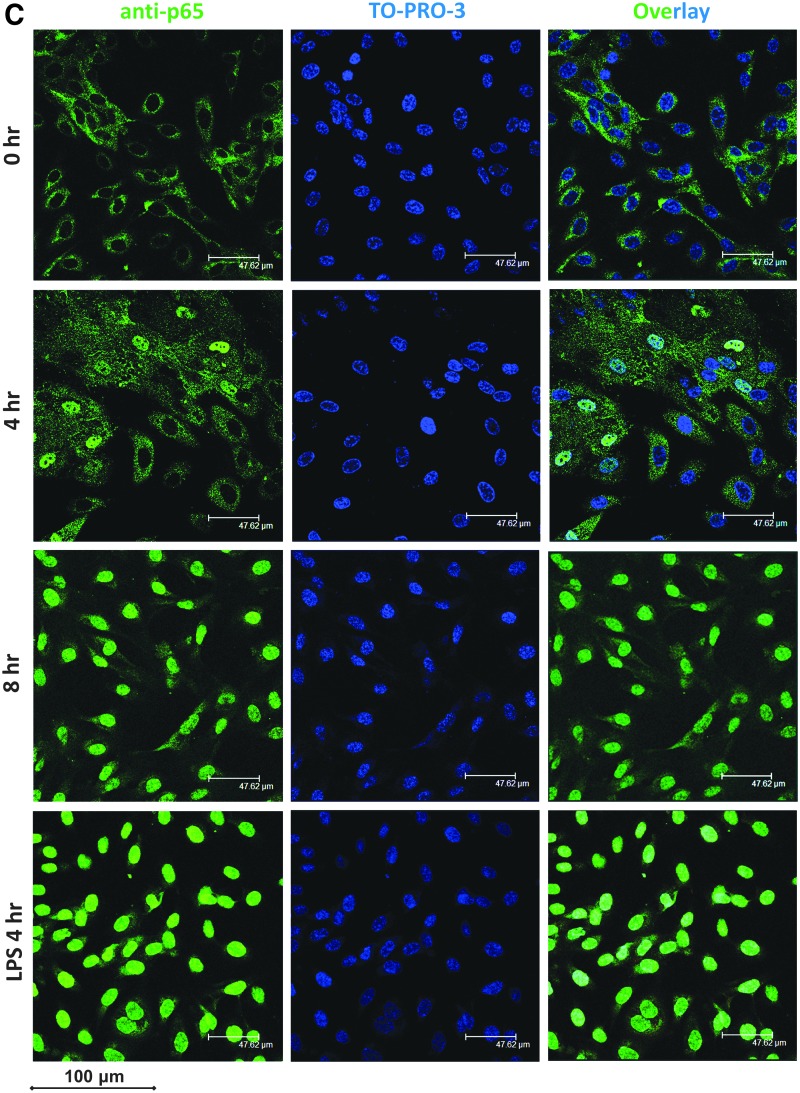
The nuclear interferon-inducible-16 (IFI16) protein acts as DNA sensor in inflammasome signaling and as viral restriction factor. Following Herpesvirus infection or UV-B treatment, IFI16 delocalizes from the nucleus to the cytoplasm and is eventually released into the extracellular milieu. Recently, our group has demonstrated the occurrence of IFI16 in sera of systemic-autoimmune patients that hampers biological activity of endothelia through high-affinity membrane binding. As a continuation, we studied the activity of endotoxin-free recombinant IFI16 (rIFI16) protein on primary endothelial cells. rIFI16 caused dose/time-dependent upregulation of IL-6, IL-8, CCL2, CCL5, CCL20, ICAM1, VCAM1, and TLR4, while secretion of IL-6 and IL-8 was amplified with lipopolysaccharide synergy. Overall, cytokine secretion was completely inhibited in MyD88-silenced cells and partially by TLR4-neutralizing antibodies. By screening downstream signaling pathways, we found that IFI16 activates p38, p44/42 MAP kinases, and NF-kB. In particular, activation of p38 is an early event required for subsequent p44/42 MAP kinases activity and cytokine induction indicating a key role of this kinase in IFI16 signaling. Altogether, our data conclude that extracellular IFI16 protein alone or by synergy with lipopolysaccharide acts like Damage-associated molecular patterns propagating "Danger Signal" through MyD88-dependent TLR-pathway.


Figures

<b>FIG. 1.</b>
FIG. 1.
mRNA expression profile of proinflammatory cytokines in rIFI16-stimulated HUVEC. (A) Bar graphs representing folds change mRNA expression by HUVEC grown in presence/absence of VEGF growth factor in EGM-2, stimulated for 24 h with either rIFI16 (50 μg/mL) or mock control. (B) Solid and dotted line histograms representing fold change time-dependent mRNA expression by HUVEC grown in VEGF-depleted EGM-2, stimulated with either rIFI16 (50 μg/mL) or mock control for 0, 4, 12, 24, 48, and 72 h. Each real time PCR reaction was performed with Bio-Rad CFX96 and relative normalized expression of mRNA was calculated by the comparative Ct method. All experiments were performed in triplicates and the bar graphs/histograms represent (mean±SD) 6 independent experiments. All experimental data were processed by GraphPad Prism 6.01 software that was used to plot histograms and calculate statistical significance by unpaired t-test. *P<0.05; **P<0.01. HUVEC, human umbilical vein endothelial cell; rIFI16, recombinant interferon-inducible-16; VEGF, vascular endothelial growth factor.
<b>FIG. 2.</b>
FIG. 2.
Dose- and time-dependent secretion of proinflammatory cytokines upon rIFI16 treatment. (A) Dose-dependent secretion of multiple cytokines after rIFI16 treatment. Interleaved histograms indicating dose-dependent folds change in cytokine secretion by HUVEC stimulated with increasing concentration of rIFI16 (0, 1, 10, 25, 50, and 75 μg/mL respectively) for 24 h. (B) Time-dependent secretion of multiple cytokines after rIFI16 treatment. Interleaved histograms indicating time-dependent folds change in cytokine secretion by HUVEC stimulated with rIFI16 (50 μg/mL) for 0, 4, 8, 12, 24, and 48 h. All cells were grown in VEGF-depleted EGM-2 and ELISA was performed in triplicates using single analyte ELISA kits (Human) by Life Technologies. Each histogram represent (mean±SD) 6 independent experiments. All experimental data were processed by GraphPad Prism 6.01 software that was used to plot histograms and calculate statistical significance by 2-way ANOVA. *P<0.05; **P<0.01; ***P<0.001. ANOVA, analysis of variance.
<b>FIG. 3.</b>
FIG. 3.
rIFI16 synergizes with lipopolysaccharide (LPS) to increase proinflammatory cytokine expression through MyD88-dependent pathways. (A) HUVEC were grown in VEGF-depleted EGM-2 and stimulated for 24 h with either mock control, rIFI16 (50 μg/mL), LPS (10 ng/mL), or rIFI16+LPS mixture. Each RT-PCR reaction was performed with Bio-Rad CFX96 and relative normalized expression of mRNA was calculated using comparative Ct method. (B) MyD88/TLR4 silencing/neutralization inhibits rIFI16 cytokine stimulating activity and LPS synergy. HUVEC were stimulated for 24 h with mock control, rIFI16 (50 μg/mL), LPS (10 ng/mL), and rIFI16+LPS in the presence of no siRNA/antibodies (Control dataset), siRNA control, siRNA MyD88, Control IgG, or anti-TLR antibodies. (C) Flow cytometry histograms showing expression of ICAM1, VCAM1, and TLR4 in HUVEC when stimulated with mock control, rIFI16 (50 μg/mL), or LPS (10 ng/mL). One representative example from 6 independent experiments is shown. The shaded histograms represent binding of anti-ICAM1, anti-VCAM1, and anti-TLR4 antibodies and open histograms represent corresponding untreated controls. Isotype controls for each antibody were used in parallel to identify unspecific staining. (D) Histograms representing% positive cells after treatment and normalized mean fluorescence intensity as compared to isotype controls, plotted as mean±SD for ICAM1, VCAM1, and TLR4 from 6 independent experiments. All experimental data were processed by GraphPad Prism 6.01 software that was used to plot histograms and calculate statistical significance by 2-way ANOVA. *P<0.05; **P<0.01; ***P<0.001; s, synergy; ns, no synergy.
<b>FIG. 4.</b>
FIG. 4.
Differential activation of p44/42, p38, JNK, and NF-κB kinases in rIFI16-stimulated HUVEC. HUVEC were stimulated with rIFI16 (50 μg/mL) and the phosphoactive forms of (A) p44/42, p38, JNK, and NF-κB were detected by western blotting. One representative blot of 3 independent experiments is shown. Densitometric analysis predicting fold change in expression (mean±SD) from 3 independent experiments is represented by (B) corresponding histograms. Western blots of phosphoactive forms were stripped and incubated with antibodies against basal forms for loading control and densitometry normalization. All western blot images were acquired using VersaDoc 3000 equipment and images were exported using Quantity One 4.6.9 (Bio-Rad). Protein bands were cropped and compiled using Microsoft PowerPoint 2013 software. All experimental data were processed by GraphPad Prism 6.01 software that was used to plot histograms and calculate statistical significance by unpaired t-test. (C) HUVEC were stimulated with rIFI16 (50 μg/mL) for 0, 4, and 8 h and with LPS (10 ng/mL) for 4 h. Immunofluorescence was performed using 1:1000 anti-p65 polyclonal antibody (sc-109) and 1:500 TO-PRO-3 (Life Technologies) as nuclear counter stain. One representative image from 6 independent experiments is shown. *P<0.05.
<b>FIG. 5.</b>
FIG. 5.
Phosphorylation of NF-κB is independent and p44/42 is dependent on P-p38-mediated cytokine secretion. HUVEC were stimulated with rIFI16 (50 μg/mL) for 24 h in the presence of SB203580 (p38 inhibitor), FR180204 (p44/42 MAPK inhibitor), or both and the secretion of (A) IL-6 and (B) IL-8 was measured by ELISA. All experiments were carried out in triplicates and bar diagrams represent the levels of IL-6 and IL-8 (mean±SD) from 3 independent experiments. Western blots for (C) Phospho-p44/42 and (E) Phospho-NF-κB show the activation kinetics in the presence or absence of SB203580 in rIFI16-stimulated HUVEC. One representative blot from 3 independent experiments is shown. Histograms from panel (D) and (F) represent fold change in expression (mean±SD) calculated from 3 independent experiments by western blot densitometry study. Western blots of P-p44/42 and P-NF-κB were stripped and incubated with antibodies against basal p44/42 or NF-κB for loading control and densitometry normalization. Western blot images were acquired using VersaDoc 3000 equipment and images were exported using Quantity One 4.6.9 (Bio-Rad). Protein bands were cropped and compiled using Microsoft PowerPoint 2013 software. All experimental data were processed by GraphPad Prism 6.01 software that was used to plot histograms and calculate statistical significance by unpaired t-test. *P<0.05; **P<0.01; ns, not significant.

References

    1. Agmon-Levin N, Mosca M, Petri M, Shoenfeld Y. 2012. Systemic lupus erythematosus one disease or many? Autoimmun Rev 11(8):593–595 - PubMed
    1. Alnemri ES. 2010. Sensing cytoplasmic danger signals by the inflammasome. J Clin Immunol 30(4):512–519 - PMC - PubMed
    1. Ansari MA, Singh VV, Dutta S, Veettil MV, Dutta D, Chikoti L, Lu J, Everly D, Chandran B. 2013. Constitutive interferon-inducible protein 16-inflammasome activation during Epstein-Barr virus latency I, II, and III in B and epithelial cells. J Virol 87(15):8606–8623 - PMC - PubMed
    1. Asefa B, Klarmann KD, Copeland NG, Gilbert DJ, Jenkins NA, Keller JR. 2004. The interferon-inducible p200 family of proteins: a perspective on their roles in cell cycle regulation and differentiation. Blood Cells Mol Dis 32(1):155–167 - PubMed
    1. Baggetta R, De Andrea M, Gariano GR, Mondini M, Ritta M, Caposio P, Cappello P, Giovarelli M, Gariglio M, Landolfo S. 2010. The interferon-inducible gene IFI16 secretome of endothelial cells drives the early steps of the inflammatory response. Eur J Immunol 40(8):2182–2189 - PubMed

Publication types

MeSH terms