. 2015 Feb 26:5:8587.
doi: 10.1038/srep08587.

Responses of solid tumor cells in DMEM to reactive oxygen species generated by non-thermal plasma and chemically induced ROS systems

Affiliations

Responses of solid tumor cells in DMEM to reactive oxygen species generated by non-thermal plasma and chemically induced ROS systems

Neha Kaushik et al. Sci Rep. .

Abstract

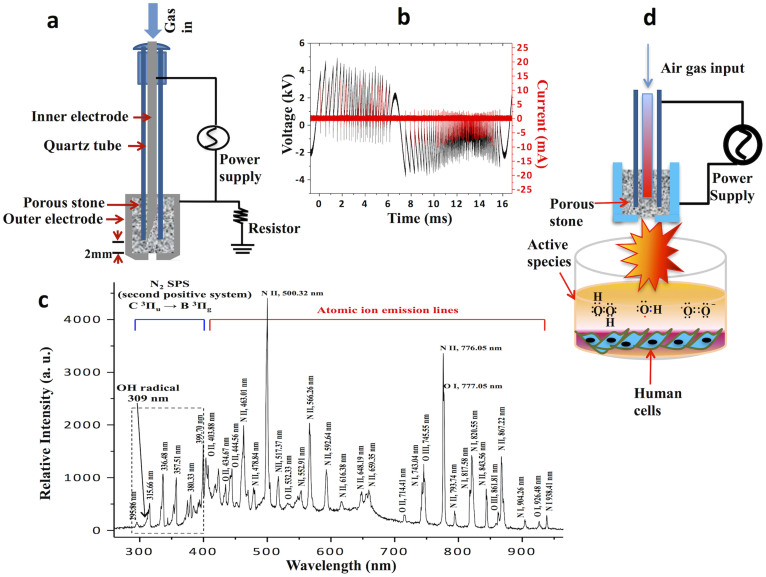
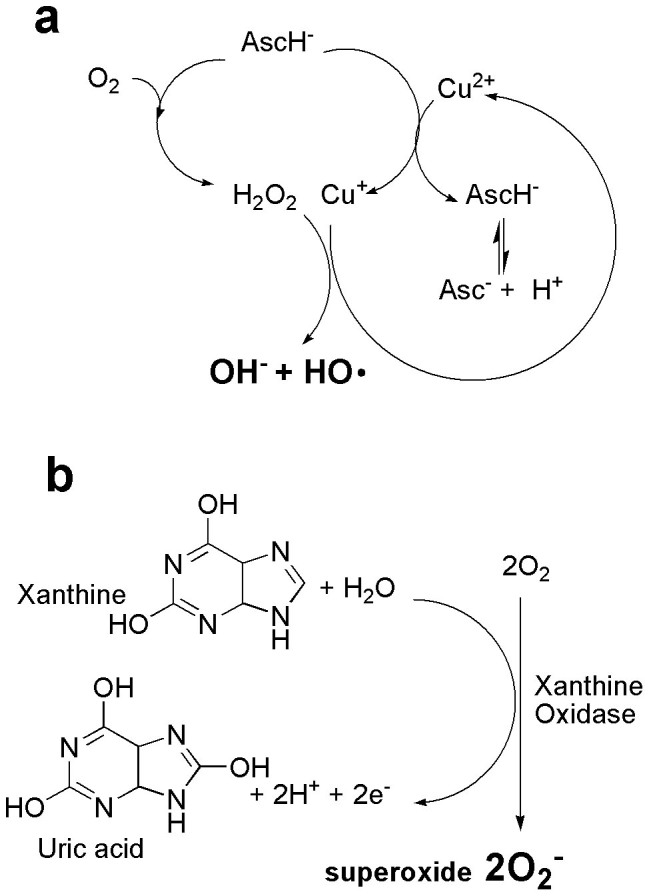
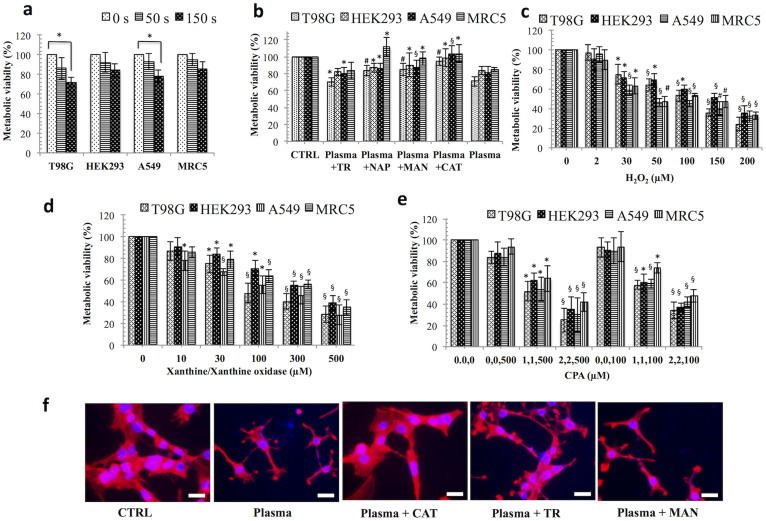
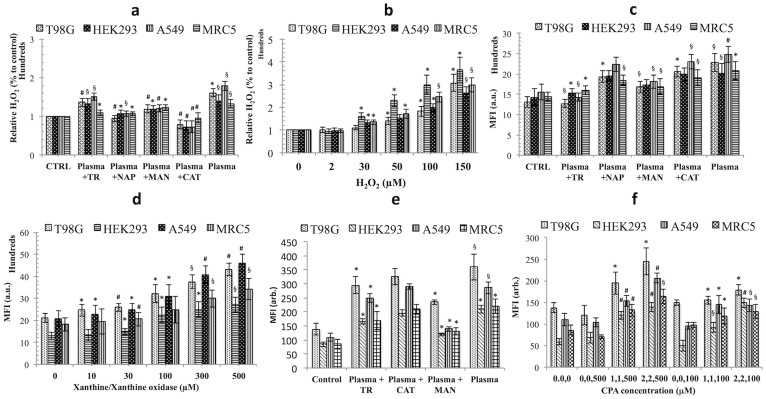
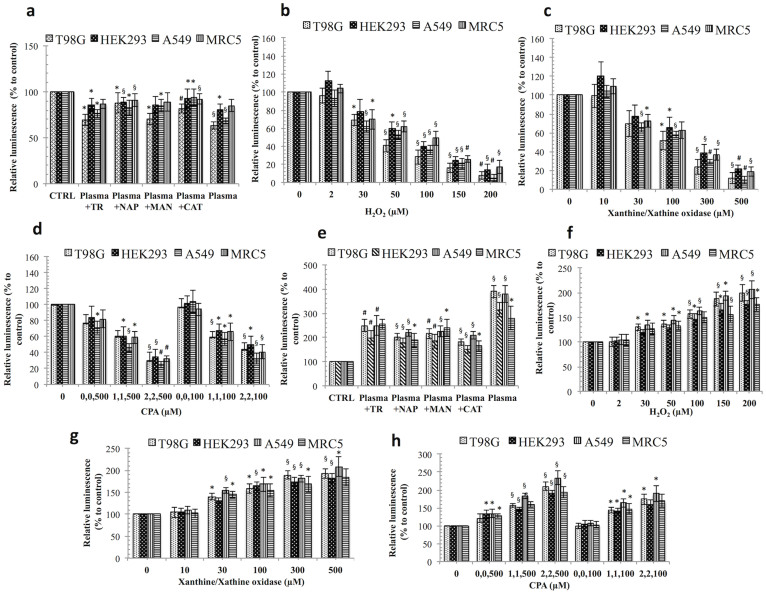
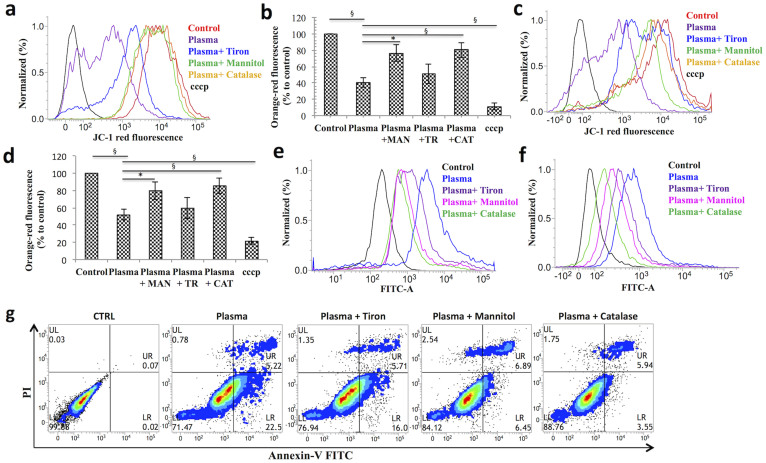
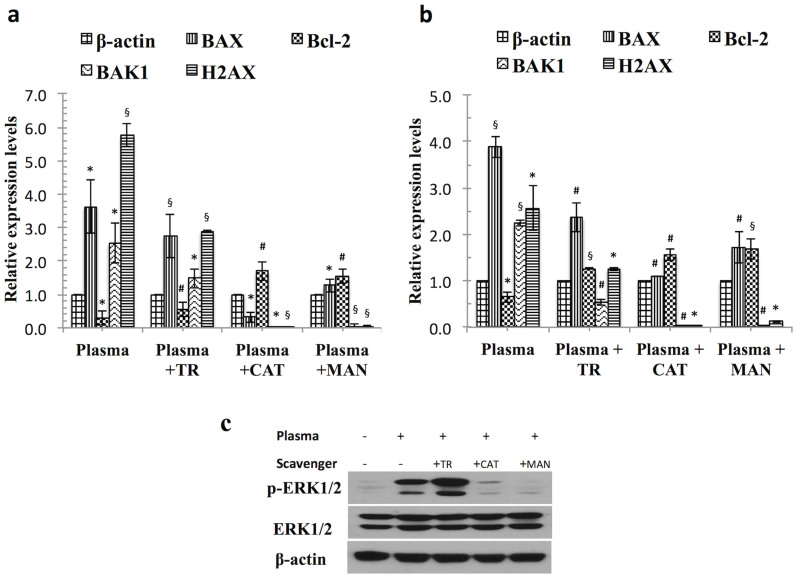
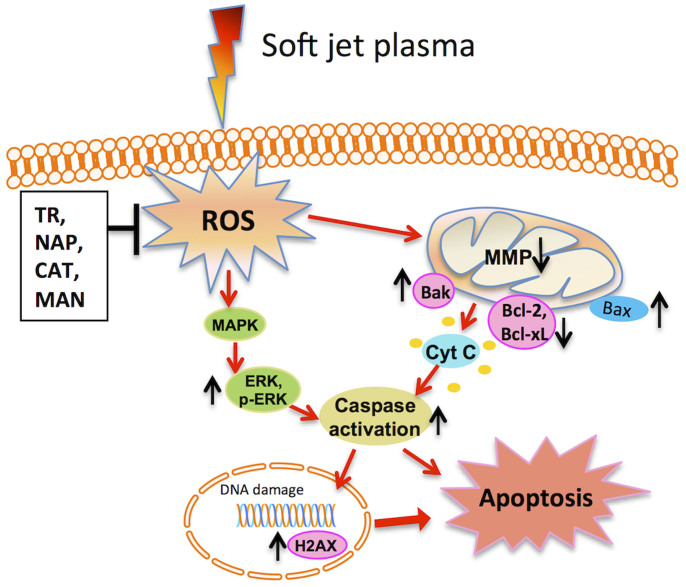
In this study, we assessed the role of different reactive oxygen species (ROS) generated by soft jet plasma and chemical-induced ROS systems with regard to cell death in T98G, A549, HEK293 and MRC5 cell lines. For a comparison with plasma, we generated superoxide anion (O2(-)), hydroxyl radical (HO·), and hydrogen peroxide (H2O2) with chemicals inside an in vitro cell culture. Our data revealed that plasma decreased the viability and intracellular ATP values of cells and increased the apoptotic population via a caspase activation mechanism. Plasma altered the mitochondrial membrane potential and eventually up-regulated the mRNA expression levels of BAX, BAK1 and H2AX gene but simultaneously down-regulated the levels of Bcl-2 in solid tumor cells. Moreover, a western blot analysis confirmed that plasma also altered phosphorylated ERK1/2/MAPK protein levels. At the same time, using ROS scavengers with plasma, we observed that scavengers of HO· (mannitol) and H2O2 (catalase and sodium pyruvate) attenuated the activity of plasma on cells to a large extent. In contrast, radicals generated by specific chemical systems enhanced cell death drastically in cancer as well as normal cell lines in a dose-dependent fashion but not specific with regard to the cell type as compared to plasma.


Figures

Figure 1
Figure 1. Non-thermal plasma device properties and the experimental set up.
(a) Schematic diagram of plasma device (b) Voltage and current characteristics of non-thermal plasma (c) The optical emission spectra (OES) of soft plasma jet (d) Experimental setup of plasma-cell interaction.
Figure 2
Figure 2. Chemical generated ROS schemes.
(a) Formation of hydroxyl radicals (HO·) via Fenton reaction [CuSO4, phenanthroline, and ascorbic acid; CPA]. Under aerobic conditions, ascorbate (AscH) not only is involved in the reduction of copper ions (Cu2+), but also reacts with O2 to produce H2O2. Hydroxide (OH) and HO· are then yielded in the next Fenton reaction. 1, 10-phenanthroline (P) is used to stimulate HO· formation with Cu2+ ions and AscH (b) Formation of superoxide anion (O2) by xanthine (1 mM) plus xanthine oxidase (0.05 U/ml). Xanthine (X) is catalyzed by xanthine oxidase (XO) enzyme and form uric acid and also generates O2 in this reaction. This mechanism is based on proposal that the one-electron transfer equilibriums between redox centers of XO enzymes (one molybdenum, one FAD, and two Fe-S centers) are rapid and governed by reduction potentials. During the oxidation of reduced XO electrons transferred to dioxygen. Two O2 are produced for each enzyme molecules reoxidized.
Figure 3
Figure 3. Dose–dependent response of non-thermal plasma and ROS-generating systems on the cancer and normal cells.
Viability of cancer and normal cells treated with (a) plasma, (b) plasma plus scavengers, (c) H2O2, (d) X/XO [xanthine/xanthine oxidase], for O2 (e) CPA [CuSO4, phenanthroline, and ascorbic acid] for HO· radicals. (f) Immunofluorescence assays using phalloidin rhodamine (5 units/ml, Invitrogen) were performed to visualize the cytoskeleton (F-actin); DAPI was used to label cell nucleus in plasma and plasma plus scavengers treated T98G cells. Each figure has scale bar of 10 μm. Results are expressed as the percentage of living cells compared to control conditions as the mean ± SD (n = 3). Student's t-test was performed to controls in plasma, H2O2, X/XO (O2), CPA (HO·), whereas in (a) and (b) plasma and plasma plus scavenger-treated groups were compared to untreated and only plasma-treated group, respectively (* p < 0.05, § p < 0.01, # p < 0.001).
Figure 4
Figure 4. Detection of H2O2, O2 and HO· in plasma and chemical exposed cancer and normal cells.
(a, b) H2O2 level in cells detected with an Amplex Red fluorescent H2O2 probe in plasma and H2O2 chemical systems (c, d) O2 detection in plasma and chemical systems [xanthine/xanthine oxidase] in cancer and normal cells with a DHE fluorescent probe (1 mM), and (e, f) HO· radical detection using HPF (10 μM) in plasma and CPA [CuSO4, phenanthroline, and ascorbic acid] chemical systems by an ELISA plate reader. Results are expressed as the mean ± SD (n = 3). Student's t-test was performed to control, whereas in (a), (c) and (e) plasma plus scavenger-treated group was compared to only plasma-treated group (* p < 0.05, § p < 0.01, # p < 0.001).
Figure 5
Figure 5. ATP levels and caspase-3/7 activity altered by plasma- and chemical-treated cancer and normal cells.
ATP levels in plasma- and chemical-treated cancer and normal cells (a) plasma-treated cells, (b) H2O2-treated, (c) X/XO [xanthine/xanthine oxidase]-treated, (d) CPA [CuSO4, phenanthroline, and ascorbic acid]-treated. Caspase-3/7 activity in cancer and normal cells (e) plasma-treated (f) H2O2-treated (g) X/XO-treated, and (h) CPA-treated. Results are expressed as the mean ± SD (n = 3). Student's t-test was performed to control, whereas in (a), and (e) plasma plus scavenger-treated group was compared to only plasma-treated group (* p < 0.05, § p < 0.01, # p < 0.001).
Figure 6
Figure 6. Analysis of apoptotic indicators of plasma and plasma plus scavengers treated cancer cells.
(a) Flow cytometric band shift plot of mitochondrial membrane potential in T98G cells, where cccp was used as a positive control. (b) A bar graph of calculated JC-1 red fluorescence percent intensity changes of T98G cells (c) Flow cytometric band shift plot of mitochondrial membrane potential in A549 cells. (d) A bar graph of JC-1 red fluorescence calculated percent intensity changes of A549 cells. Apoptotic cell death was assessed using annexin V-FITC/PI staining and flow cytometry. Stained cells can be discriminated cells into four groups, i.e., the viable (annexin V− PI−), early apoptosis (annexin V+ PI−), late apoptosis (annexinV+ PI+) and necrotic (annexin V− PI+) groups. (e) A plot of T98G cells apoptotic population treated by plasma and plasma plus scavengers. (f) A plot of A549 cells apoptotic population treated by plasma and plasma plus scavengers. (g) Contour plot of T98G cells population treated with plasma and plasma plus scavengers. Results are expressed as the mean ± SD (n = 3). Student's t-test was performed to control, whereas in plasma plus scavenger-treated group was compared to only plasma-treated group (* p < 0.05, § p < 0.01, # p < 0.001).
Figure 7
Figure 7. Soft-jet plasma treatment triggers a mitochondrial apoptotic intrinsic pathway and activated ERK/MAPK protein levels.
(a) RT-PCR quantitation of mRNA levels for Bcl-2 family members in T98G cells (b) RT-PCR quantitation of mRNA levels Bcl-2 family members in A549 cells. Results are expressed as the mean ± SD (n = 3). Student's t-test was performed to control, whereas plasma plus scavenger-treated group was compared to only plasma-treated group (* p < 0.05, § p < 0.01, # p < 0.001). (c) Western blot analysis was performed using antibodies against p-ERK in T98G cancer cells. Cropped blots were used here and uncropped images of blots are shown in supplementary Figure S7, gels/blots have been processed under the same experiment conditions.
Figure 8
Figure 8. The molecular mechanism of soft-jet plasma induced cancer cell apoptosis via mitochondrial intrinsic pathway and ERK/MAPK activation.

References

    1. Devasagayam T. P. et al. Free radicals and antioxidants in human health: current status and future prospects. J. Assoc. Physicians India 52, 794–804 (2004). - PubMed
    1. Simon H. U., Haj-Yehia A. & Levi-Schaffer F. Role of reactive oxygen species (ROS) in apoptosis induction. Apoptosis 5, 415–8 (2000). - PubMed
    1. Trachootham D., Alexandre J. & Huang P. Targeting cancer cells by ROS-mediated mechanisms: a radical therapeutic approach? Nat. Rev. Drug Discov. 8, 579–591 (2009). - PubMed
    1. Dobbelstein M. & Moll U. Targeting tumour-supportive cellular machineries in anticancer drug development. Nat. Rev. Drug Discov. 13, 179–196 (2014). - PubMed
    1. Zeng J. Y. et al. Synergistic activities of MET/RON inhibitor BMS-777607 and mTOR inhibitor AZD8055 to polyploid cells derived from pancreatic cancer and cancer stem cells. Mol. Cancer Ther. 13, 37–48 (2014). - PubMed

Publication types

MeSH terms