

doi: 10.1038/srep08576.
Highly stable and sensitive fluorescent probes (LysoProbes) for lysosomal labeling and tracking
Affiliations
- PMID: 25715948
- PMCID: PMC4341211
- DOI: 10.1038/srep08576
Item in Clipboard
Highly stable and sensitive fluorescent probes (LysoProbes) for lysosomal labeling and tracking
Sci Rep.
.
Abstract
We report the design, synthesis and application of several new fluorescent probes (LysoProbes I-VI) that facilitate lysosomal pH monitoring and characterization of lysosome-dependent apoptosis. LysoProbes are superior to commercially available lysosome markers since the fluorescent signals are both stable and highly selective, and they will aid in characterization of lysosome morphology and trafficking. We predict that labeling of cancer cells and solid tumor tissues with LysoProbes will provide an important new tool for monitoring the role of lysosome trafficking in cancer invasion and metastasis.
Figures


LysoProbe II (30 μM, B) was incubated with cells in DMEM media without FBS and counterstained with MitoTracker (80 nM, A), Hoechst 33342 (1 μg/mL, C); and overlay (D); (E–H): HeLa cells incubated with LysoProbe II (10 μM, E), followed by counterstaining with LysoTracker (2 μM, F), Hoechst 33342 (1 μg/mL, G); and overlay (H); Cells were imaged on an inverted laser scanning fluorescent microscope (Olympus) using a 60 × oil immersion objective lens.

LysoProbe I (2 μM, green, C) was incubated with cells in non-FBS DMEM media for 15 min., and then counterstained with LysoTracker (2 μM, no fluorescence, B), Hoechst 33342 (1 μg/mL, blue, A); DIC image (D), overlay (A+B+C) with DIC (E), overlay (A+B+C) without DIC image (F). All images were acquired using a 60 × objective lens following 24 h incubation.
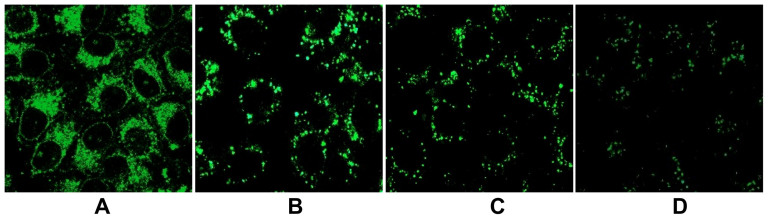
After washing three times with corresponding pH buffers, the cells pre-loaded with LysoProbe II were incubated with nigericin and subsequently imaged in pH 4.4 (A), pH 5.0 (B), pH 5.5 (C) and pH 6.5 (D) buffers. The cells were imaged for fluorescence on an inverted laser scanning fluorescent microscope (Olympus) using a 60 × oil immersion objective lens.

LysoProbe fluorescence images are displayed in green (A, D), with nuclei counterstained by Hoechst 33342 and displayed in blue (B, E), and overlay images (C, F). Tissues were imaged on an inverted laser scanning fluorescent microscope (Olympus) using a 60 × oil immersion objective lens.

RBE cells treated with CQ in the presence of standard serum: (A) CQ (20 μM) for 1 h; (B) CQ (20 μM) for 24 h; (C) CQ (20 μM) + BafA1 (10 nM) for 24 h. Cells were imaged on an inverted laser scanning fluorescent microscope (Olympus) using a 60 × oil immersion objective lens.

(A) the control cells in medium with standard serum, and (B) after nutrient (serum) deprivation; (C) after CQ treatment (40 μM, 6 h) in the absence of standard serum; (D) after CQ treatment (40 μM, 16 h) in the absence of standard serum; (E) as positive control, RBE cells expressing GFP-LC3 were treated with rapamycin (1 μM, 16 h) in the absence of standard serum.Cells were imaged on an inverted laser scanning fluorescent microscope (Olympus) using a 60 × oil immersion objective lens.

(A–C): cells treated with CQ in standard serum for 16 h: (A) CQ (50 μM); (B) CQ (100 μM); (C) CQ (200 μM); (D) CQ (300 μM); (E): after treatment with CQ (50 μM), in the absence of standard serum, for 16 h. Cells were imaged on an inverted laser scanning fluorescent microscope (Olympus) using a 60 × oil immersion objective lens.
References
-
- Maes H. & Agostinis P. Autophagy and mitophagy interplay in melanoma progression. Mitochondrion 17, S1567–7249 (2014). - PubMed
-
- Hönscheid P., Datta K. & Muders M. H. Autophagy: detection, regulation and its role in cancer and therapy response. Int J Radiat Biol. 90, 628–35 (2014). - PubMed
-
- He X., Li J., An S. & Jiang C. pH-sensitive drug-delivery systems for tumor targeting. Ther Deliv. 4, 1499–510 (2013). - PubMed
Publication types
MeSH terms
Substances
Grants and funding
LinkOut - more resources
Full Text Sources
Other Literature Sources
