. 2015 Feb 26:6:6241.
doi: 10.1038/ncomms7241.

Complement C1q-induced activation of β-catenin signalling causes hypertensive arterial remodelling

Affiliations

Complement C1q-induced activation of β-catenin signalling causes hypertensive arterial remodelling

Tomokazu Sumida et al. Nat Commun. .

Abstract

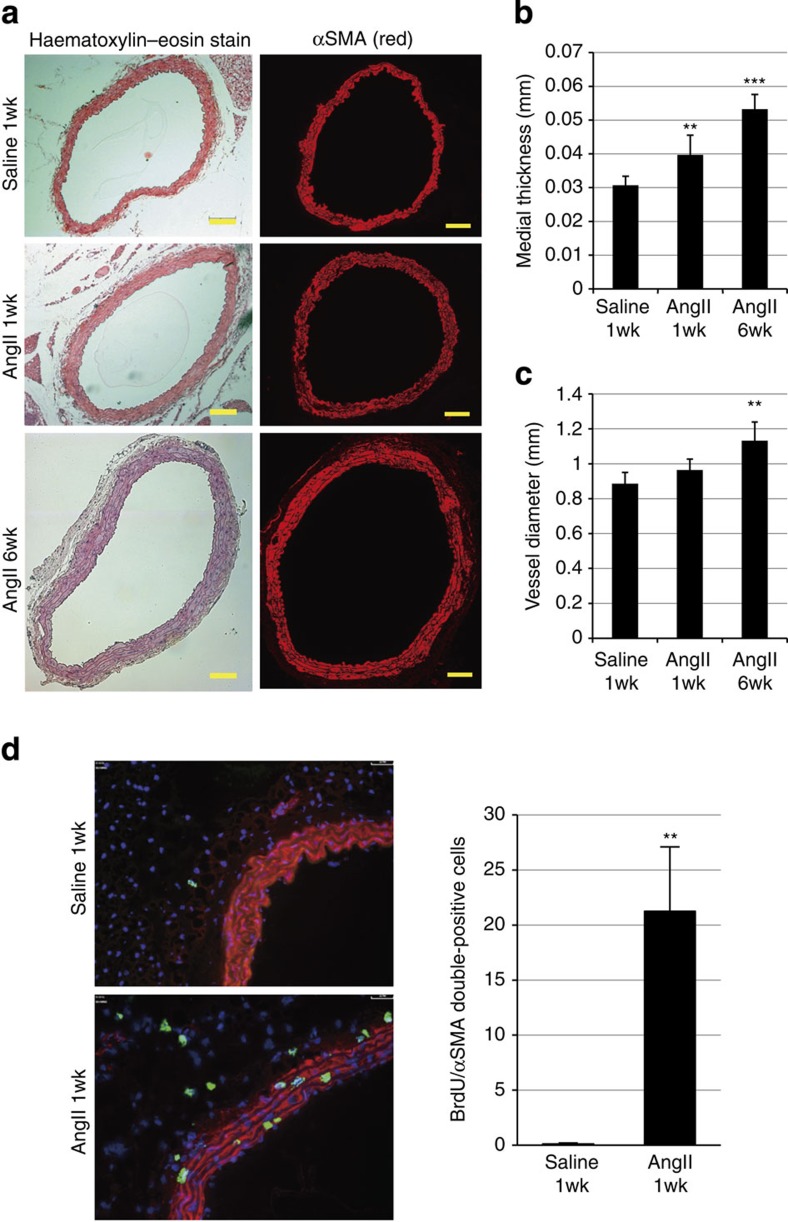
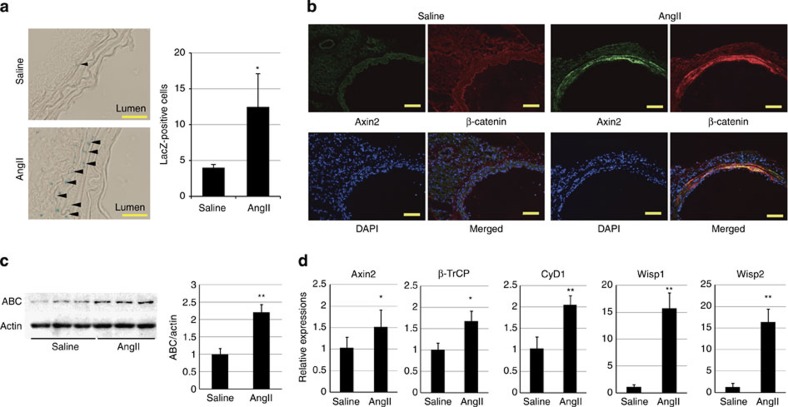
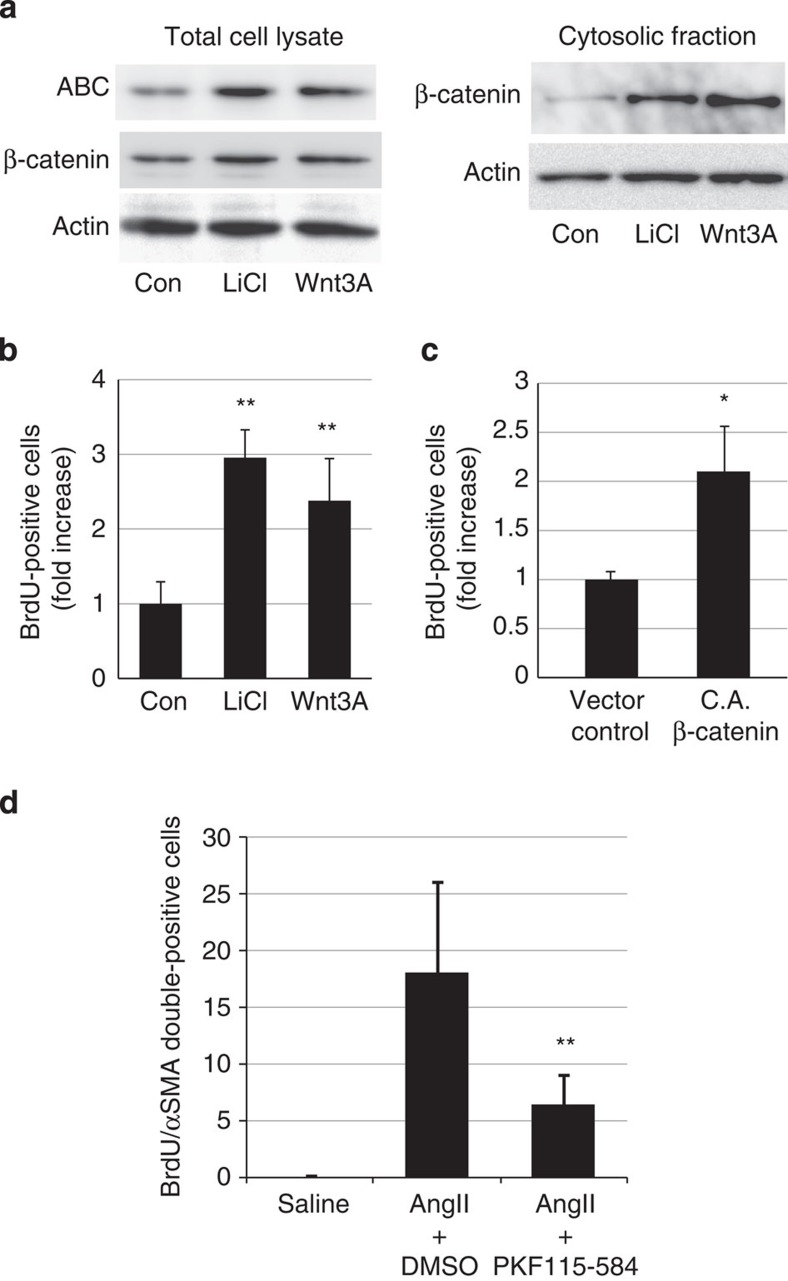
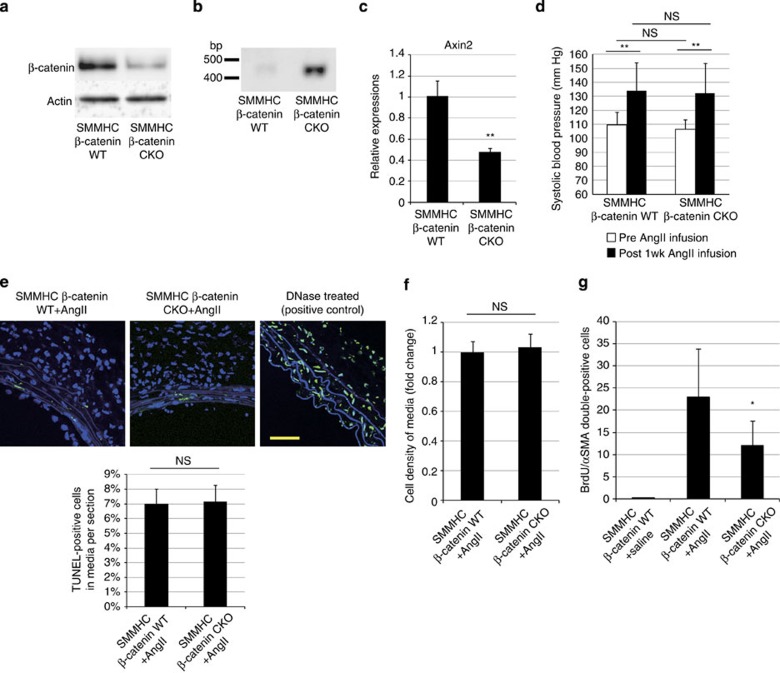
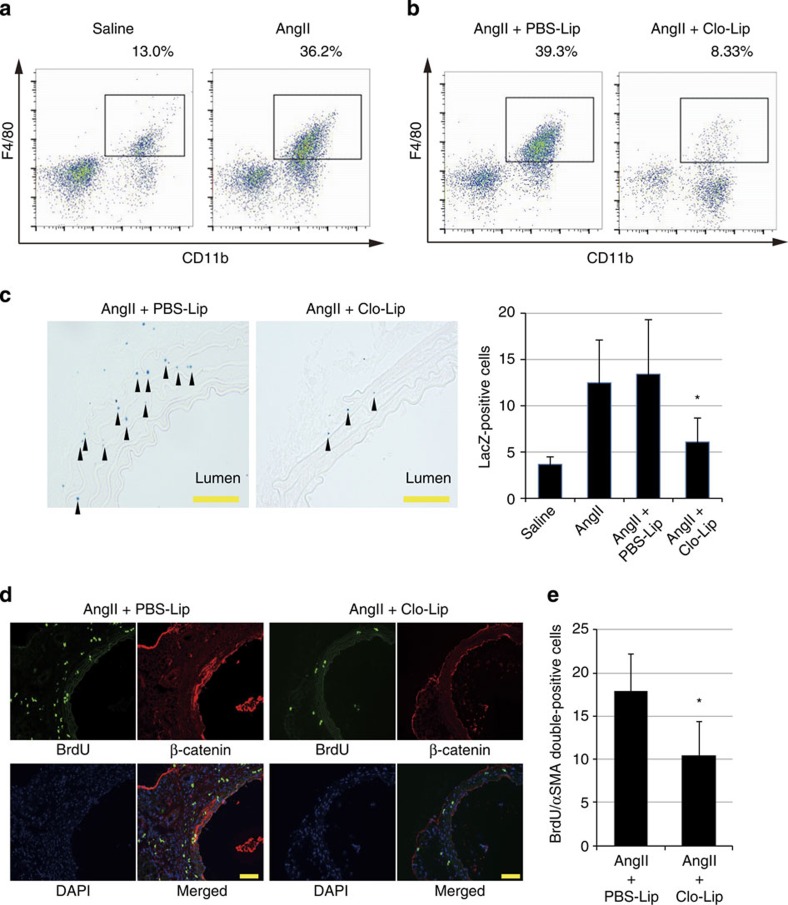
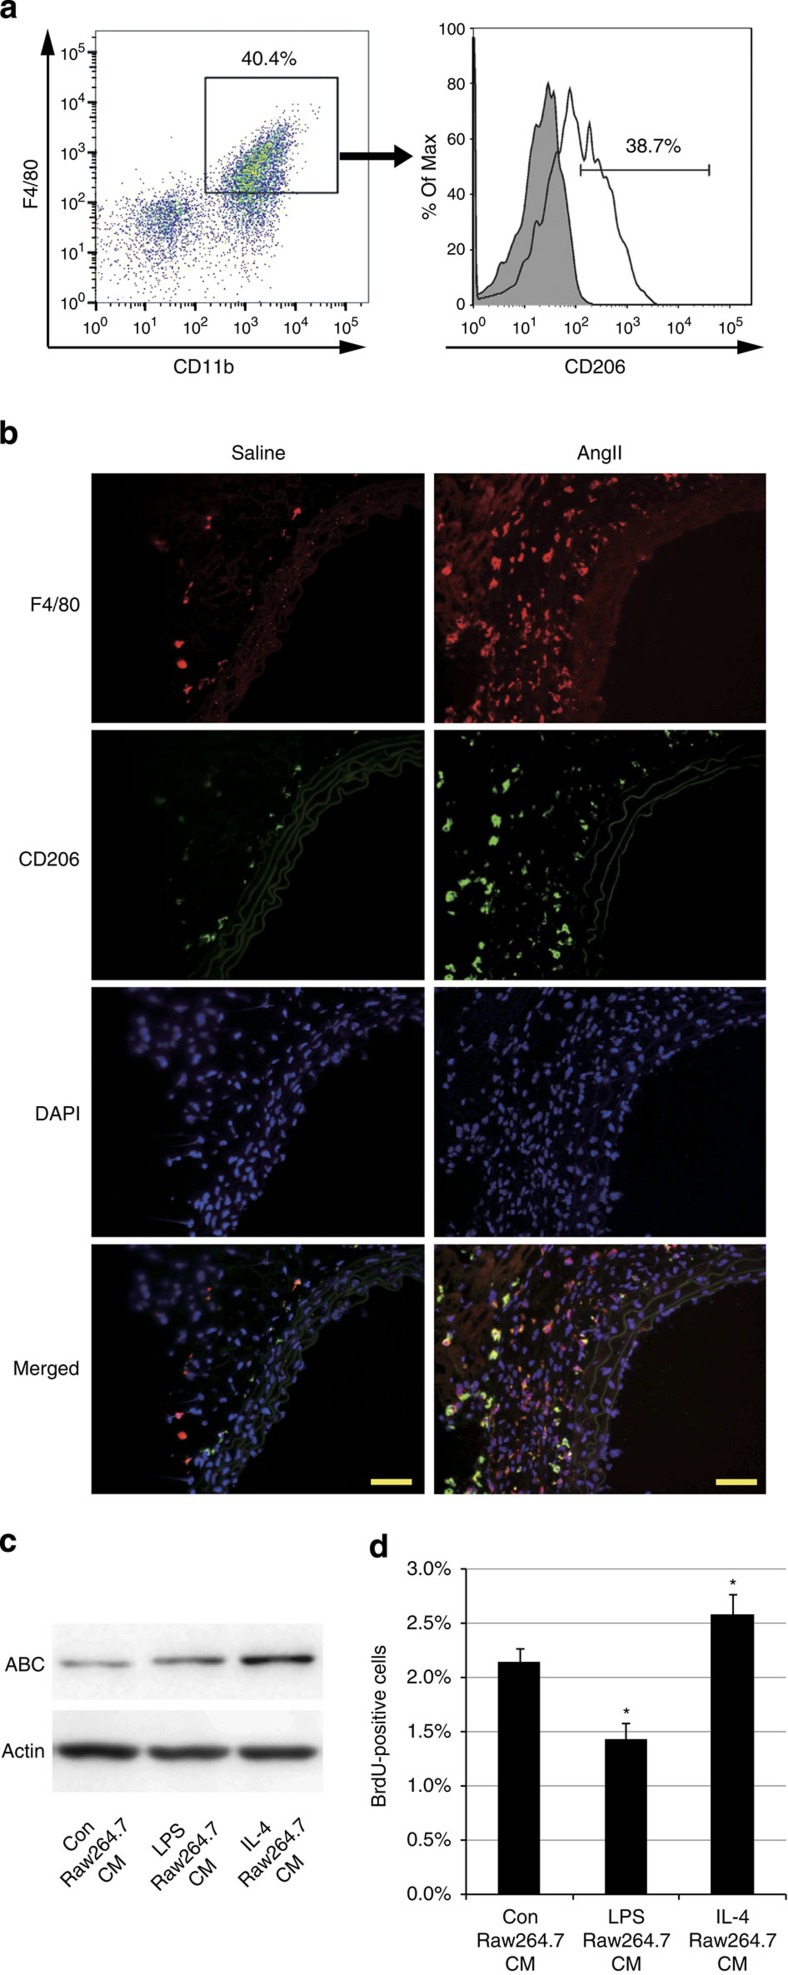
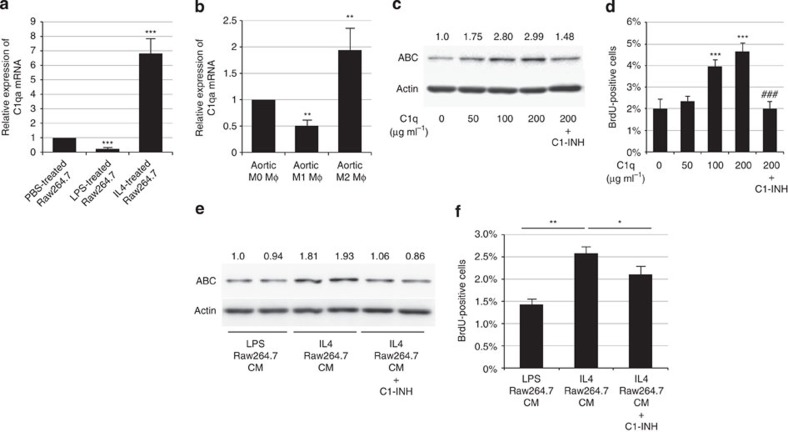
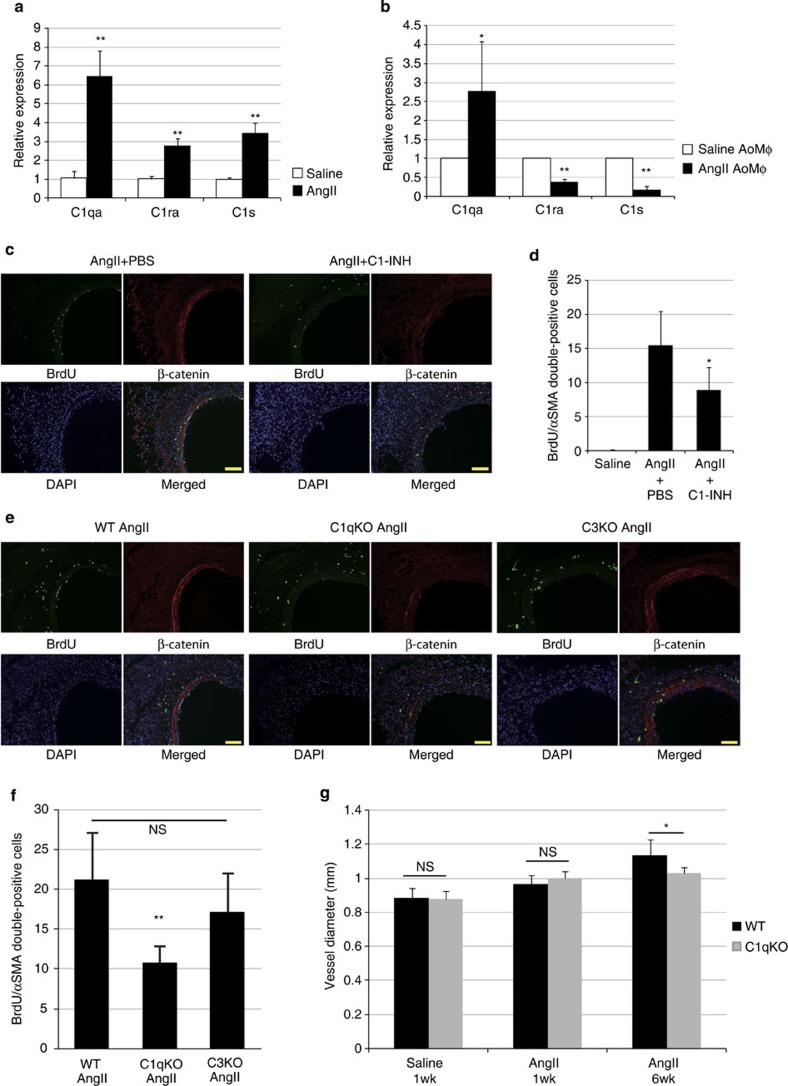
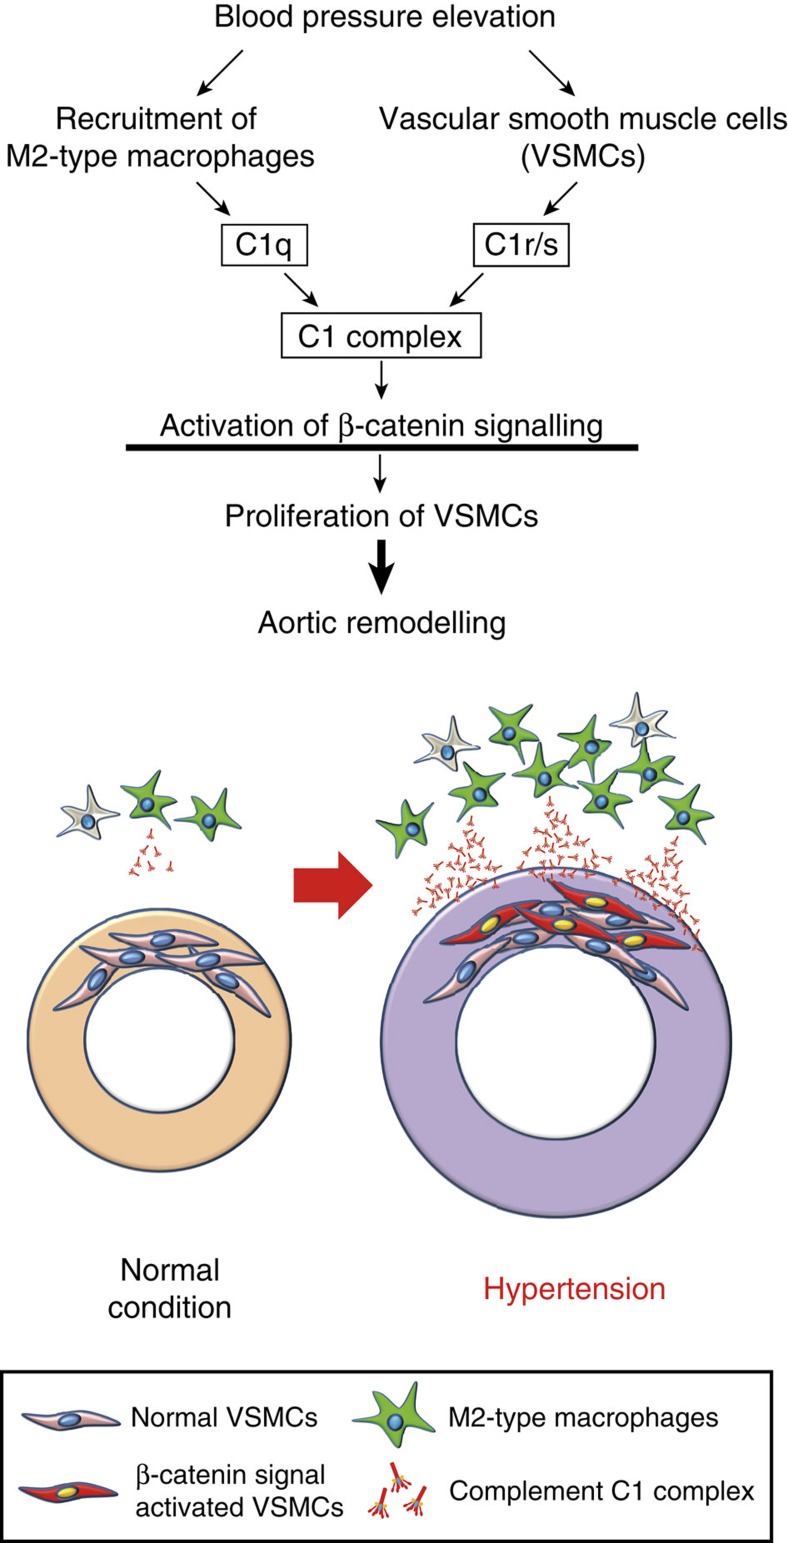
Hypertension induces structural remodelling of arteries, which leads to arteriosclerosis and end-organ damage. Hyperplasia of vascular smooth muscle cells (VSMCs) and infiltration of immune cells are the hallmark of hypertensive arterial remodelling. However, the precise molecular mechanisms of arterial remodelling remain elusive. We have recently reported that complement C1q activates β-catenin signalling independent of Wnts. Here, we show a critical role of complement C1-induced activation of β-catenin signalling in hypertensive arterial remodelling. Activation of β-catenin and proliferation of VSMCs were observed after blood-pressure elevation, which were prevented by genetic and chemical inhibition of β-catenin signalling. Macrophage depletion and C1qa gene deletion attenuated the hypertension-induced β-catenin signalling, proliferation of VSMCs and pathological arterial remodelling. Our findings unveil the link between complement C1 and arterial remodelling and suggest that C1-induced activation of β-catenin signalling becomes a novel therapeutic target to prevent arteriosclerosis in patients with hypertension.


Figures

Figure 1
Figure 1. Proliferation of VSMCs is observed at the initial stage of AngII-induced arterial remodelling.
(a) Haematoxylin and eosin staining and immunostaining for α-smooth muscle actin (αSMA) of the abdominal aorta from 1-week saline-infused mice (saline 1wk), 1-week AngII-infused mice (AngII 1wk) and 6-week AngII-infused mice (AngII 6wk) (n=5–7). Scale bar, 100 μm. (b,c) Morphometric analysis. (b) Medial thickness and (c) vessel diameter were calculated using ImageJ. **P<0.01, ***P<0.001 versus saline-infused mice (n=5–9). (d) Aortic tissues were immunostained for BrdU (green) and αSMA (red). Scale bar, 100 μm. The number of double-positive (BrdU(+)/αSMA(+)) cells per section is shown. **P<0.01 versus saline-infused mice (n=5–7). Statistical significance was determined using one-way analysis of variance with Turkey’s post hoc test for b and c, and the unpaired two-tailed Student’s t-test for d. Results are represented as mean±s.d.
Figure 2
Figure 2. β-catenin signalling is activated in the aortic media at the early stage of hypertension.
(a) β-galactosidase staining of the aortic tissue from 1-week saline- or AngII-infused Axin2LacZ mice. Arrowheads indicate β-galactosidase-positive nuclei. Scale bar, 50 μm. The number of LacZ-positive cells in the aortic media from Axin2LacZ mice is shown. *P<0.05 versus saline-infused mice (n=5). (b) Aortic tissues from 1-week saline- or AngII-infused mice were immunostained for Axin2 (green) and β-catenin (red). Scale bar, 100 μm. (c) Western blot analysis for non-phosphorylated active β-catenin (ABC) in the aortic tissues from 1-week saline- or AngII-infused mice. Activation of β-catenin signalling was quantified by measuring the relative level of ABC over actin. The values are shown as fold induction over saline-infused mice. **P<0.01 versus saline-infused mice (n=6, 7). (d) Real-time PCR analysis for the expression levels of the β-catenin target genes (Axin2, β-TrCP, cyclin D1 (CyD1), Wisp1 and Wisp2) in the aortic tissue from 1-week saline- or AngII-infused mice. The values are shown as fold induction over saline-infused mice. *P<0.05, **P<0.01 versus saline (n=6). Statistical significance was determined using the unpaired two-tailed Mann–Whitney U-test for a, c and d. Results are represented as mean±s.d. DAPI, 4',6-diamidino-2-phenylindole.
Figure 3
Figure 3. Activation of β-catenin signalling induces VSMC proliferation.
(a) Western blot analysis. HASMCs were treated with LiCl (10 mM) or Wnt3A (80 ng ml−1), and the amount of ABC and cytosolic β-catenin was analysed. Activation of β-catenin signalling was quantified by measuring the relative level of ABC over actin. (b) The number of BrdU(+) HASMCs after LiCl (10 mM) or Wnt3A (80 ng ml−1) treatment. The values are shown as fold induction over non-treated HASMCs (Con). **P<0.01 versus non-treated HASMCs (n=4). (c) The number of BrdU(+) HASMCs after infection with control retrovirus (vector control) or with constitutively active β-catenin (CA β-catenin) whose phosphorylation sites at the N terminus are all mutated. The values are shown as fold induction over control vector-transfected HASMCs. *P<0.05 versus control vector-transfected HASMCs (n=3). (d) The number of double-positive (BrdU(+)/αSMA(+)) cells per aortic section from saline-infused mice, AngII-infused mice treated with DMSO (solvent), and AngII-infused mice treated with PKF115-584. **P<0.01 versus AngII-infused mice treated with DMSO (n=8). Statistical significance was determined using one-way analysis of variance with Turkey’s post hoc test for b, the unpaired two-tailed Student’s t-test for c and the Kruskal–Wallis test with Dunn’s correction for multiple comparisons for d. Results are represented as mean±s.d.
Figure 4
Figure 4. β-catenin signal activation is responsible for VSMC proliferation after AngII infusion.
(a) Western blot analysis. The amounts of β-catenin in the aortic tissues from SMMHC-CreERT2:Ctnnb1+/+ mice (SMMHC-β-catenin wild type (WT)) and SMMHC-CreERT2:Ctnnb1flox/flox mice (SMMHC-β-catenin CKO) were analysed in aortic tissues isolated 6 days after the final tamoxifen treatment. (b) PCR analysis of aortic tissue DNA. DNA extracted from aortic tissues of tamoxifen-treated SMMHC-β-catenin WT and SMMHC-β-catenin CKO mice were amplified with a PCR primer set designed for detecting the null allele. (c) Real-time PCR analysis for the expression level of the Axin2 gene (one of the major Wnt/β-catenin target genes) in the aortic tissue isolated from tamoxifen-treated SMMHC-β-catenin WT and SMMHC-β-catenin CKO mice. The values are shown as fold induction over SMMHC-β-catenin WT mice. **P<0.01 versus SMMHC-β-catenin WT mice. (d) Systolic blood pressure before and after AngII infusion for 1 week. There was no difference in systolic blood pressure between SMMHC-β-catenin WT mice and SMMHC-β-catenin CKO mice before and after AngII infusion. **P<0.01 versus Post 1wk AngII infusion. (e) TdT-mediated dUTP nick end labelling (TUNEL) staining of aortic tissue and percentage of TUNEL-positive cells. TUNEL staining of aortic tissue from SMMHC-β-catenin WT and SMMHC-β-catenin CKO mice 1 week after AngII infusion. The DNase (TACS nuclease)-treated section is presented as a positive control. Percentage of TUNEL-positive cells per total cells in aortic media was calculated. Scale bar, 50 μm. (f) Cell density of aortic media was calculated by measuring the number of αSMA-positive cells per field of view size (40 × 40 μm2). (g) The number of double-positive (BrdU(+)/αSMA(+)) cells per aortic section from 1-week saline-infused SMMHC-CreERT2:Ctnnb1+/+ mice (SMMHC-β-catenin WT+saline), 1-week AngII-infused SMMHC-CreERT2:Ctnnb1+/+ mice (SMMHC-β-catenin WT+AngII) and SMMHC-CreERT2:Ctnnb1flox/flox mice (SMMHC-β-catenin CKO+AngII). *P<0.05 versus SMMHC-β-catenin WT+AngII (n=12). The values are shown as fold induction over SMMHC-β-catenin WT mice (n=5). Statistical significance was determined using the unpaired two-tailed Student’s t-test for c, e and f, two-way analysis of variance followed by Sidak’s multiple comparisons test for d and the Kruskal–Wallis test with Dunn’s correction for multiple comparisons for g. Results are represented as mean±s.d. NS, not significant.
Figure 5
Figure 5. Recruited Mφs activate β-catenin signalling and induce VSMC proliferation after AngII infusion.
(a,b) Representative density plots. Aortic Mφs of 1-week saline- and AngII-infused mice (a) of and in AngII-infused mice treated with PBS liposome (PBS-Lip) or clodronate liposome (Clo-Lip) (b) were analysed by flow cytometry. Cells within the boxes are CD11b+F4/80+Mφs. The flow cytometric analysis was performed with pooled aortic tissues from a total of 3–10 mice and percent gated cell frequencies are indicated in each representative plot. (c) β-Galactosidase staining of the aortic tissue from AngII-infused Axin2LacZ mice, treated with PBS-Lip or Clo-Lip. Arrowheads indicate β-galactosidase-positive nuclei. Scale bar, 50 μm. The number of LacZ-positive cells in the media of aortic tissue from Axin2LacZ mice is shown. *P<0.05 versus PBS-Lip-treated AngII-infused mice (n=5–6). (d) Aortic tissues from AngII-infused mice treated with PBS-Lip or Clo-Lip were immunostained for BrdU (green) and β-catenin (red). Scale bar, 100 μm. (e) The number of double-positive (BrdU(+)/αSMA(+)) cells per aortic section from AngII-infused mice treated with PBS-Lip or Clo-Lip. *P<0.05 versus PBS-Lip-treated AngII-infused mice (n=5). Statistical significance was determined using one-way analysis of variance with Turkey’s post hoc test for c, and the unpaired two-tailed Mann–Whitney U-test for e. Results are represented as mean±s.d. DAPI, 4',6-diamidino-2-phenylindole.
Figure 6
Figure 6. M2-type Mφs are the key players that activate β-catenin signalling during hypertension.
(a) Representative density plots and histogram. Aortic CD11b+F4/80+ Mφs in AngII-infused mice were further analysed for CD206 positivity. The shaded histogram indicates an isotype-control stained sample. (b) Aortic tissues from saline- or AngII-infused mice were immunostained for CD206 (green) and F4/80 (red). Scale bar, 50 μm. (c) Representative western blot analysis. Conditioned media from Raw264.7 cells treated with PBS (Con Raw264.7 CM), LPS (50 ng ml−1) (LPS Raw264.7 CM) or IL-4 (20 ng ml−1) (IL-4 Raw264.7 CM) were added to HASMCs, and the amount of ABC in the total cell lysate of HASMCs was analysed. (d) HASMCs were treated as in c, and the percentage of BrdU-positive cells was counted. *P<0.05 versus Con Raw264.7 CM (n=4). Statistical significance was determined using one-way analysis of variance with Turkey’s post hoc test for d. Results are represented as mean±s.d. DAPI, 4′,6-diamidino-2-phenylindole.
Figure 7
Figure 7. C1q secreted from M2-type Mφs activates β-catenin signalling and induces VSMC proliferation.
(a) Real-time PCR analysis for the expression level of C1qa gene in Raw264.7 cells treated with PBS, LPS (50 ng ml−1) or IL-4 (20 ng ml−1). The values are shown as fold induction over PBS-treated Raw264.7 cells. ***P<0.001 versus PBS-treated Raw264.7 cells (n=4). (b) M0, M1 and M2 Mφs from 10 pooled aortic tissues from AngII-infused mice were sorted by flow cytometry and the expression level of C1qa gene was analysed by real-time PCR. The values are shown as fold induction over aortic M0 Mφs (n=4). (c) Representative western blot analysis. HASMCs were treated with C1q (50, 100 and 200 μg ml−1) and C1-INH (150 μg ml−1). The protein amount of ABC was analysed and the relative intensity of each band is shown over each immunoblot after normalization for the level of actin. (d) HASMCs were treated as in c, and the number of BrdU-positive cells was counted. ***P<0.001 versus non-treated cells (C1q 0 μg ml−1) (n=4), ###P<0.001 versus C1q (200 μg ml−1) treated cells. (e) Representative western blot analysis. Conditioned media from Raw264.7 cells treated with LPS (50 ng ml−1) (LPS Raw264.7 CM) or IL-4 (20 ng ml−1) (IL-4 Raw264.7 CM) were added to HASMCs with or without C1-INH (150 μg ml−1). The protein amount of ABC in the total cell lysate of HASMCs was analysed and the relative intensity of each band is shown over each immunoblot after normalization for the level of actin. (f) HASMCs were treated as in e, and the number of BrdU-positive cells was counted (n=4). **P<0.01 versus LPS Raw264.7 CM. *P<0.05 versus IL-4 Raw264.7 CM. Statistical significance was determined using one-way analysis of variance with Turkey’s post hoc test. Results are represented as mean±s.d. mRNA, messenger RNA.
Figure 8
Figure 8. C1q mediates AngII-induced activation of β-catenin signalling and arterial remodelling.
(a) Real-time PCR analysis for the expression levels of C1qa, C1ra and C1s genes in the aortic tissue from 1-week saline- or AngII-infused mice. Values are shown as fold induction over saline-infused mice. **P<0.01 versus saline-infused mice (n=6). (b) Real-time PCR analysis for the expression levels of C1qa, C1ra and C1s genes in aortic Mφs sorted by flow cytometry from 1-week saline- or AngII-infused mice. The values are shown as fold induction over aortic Mφs isolated from saline-infused mice (saline AoMp). *P<0.05, **P<0.01 versus saline AoMp (n=4). (c) Aortic tissues from 1-week AngII-infused mice treated with PBS or with C1-INH were immunostained for BrdU (green) and β-catenin (red). Scale bar, 100 μm. (d) The number of double-positive (BrdU(+)/αSMA(+)) cells per section. *P<0.05 versus AngII-infused mice treated with PBS (n=8). (e) Aortic tissues from AngII-infused wild-type mice (WT AngII), C1qa-deficient mice (C1qKO AngII) and C3-deficient (C3KO AngII) mice were immunostained for BrdU (green) and β-catenin (red). Scale bar, 100 μm. (f) The number of double-positive (BrdU(+)/αSMA(+)) cells per section. **P<0.01 versus 1-week AngII-infused wild-type mice (n=4–7). NS, not significant. (g) Morphometric analysis. Aortic tissues from WT mice or C1qKO mice after saline- or AngII-infusion were immunostained for αSMA and the vessel diameter was measured using ImageJ. *P<0.05 versus 6-week AngII-infused WT mice (n=5–9). Statistical significance was determined using the unpaired two-tailed Mann–Whitney U-test for a and b, the Kruskal–Wallis test with Dunn’s correction for multiple comparison for d, one-way analysis of variance (ANOVA) with Turkey’s post hoc test for f and the two-way ANOVA followed by Tukey’s multiple comparisons test for g. Results are represented as mean±s.d. DAPI, 4′,6-diamidino-2-phenylindole.
Figure 9
Figure 9. Mechanisms of hypertensive arterial remodelling.
M2-type Mφs are recruited to the aortic adventitia after blood-pressure elevation and secrete C1q. Mφ-derived C1q and VSMC-derived C1r/s might compose the C1 complex, which plays a pivotal role in initiating hypertensive arterial remodelling through activating β-catenin signalling in VSMCs and inducing proliferation of VSMCs.

Comment in

References

    1. Horton R. GBD 2010: understanding disease, injury, and risk. Lancet 380, 2053–2054 (2012). - PubMed
    1. Kearney P. M. et al.. Global burden of hypertension: analysis of worldwide data. Lancet 365, 217–223 (2005). - PubMed
    1. Gibbons G. H. & Dzau V. J. The emerging concept of vascular remodeling. N. Engl. J. Med. 330, 1431–1438 (1994). - PubMed
    1. Intengan H. D. & Schiffrin E. L. Vascular remodeling in hypertension: roles of apoptosis, inflammation, and fibrosis. Hypertension 38, 581–587 (2001). - PubMed
    1. Li C. & Xu Q. Mechanical stress-initiated signal transductions in vascular smooth muscle cells. Cell Signal. 12, 435–445 (2000). - PubMed

Publication types