. 2015 Feb 26:5:8597.
doi: 10.1038/srep08597.

Induced pluripotent stem cells as a model for diabetes investigation

Affiliations

Induced pluripotent stem cells as a model for diabetes investigation

J Stepniewski et al. Sci Rep. .

Abstract

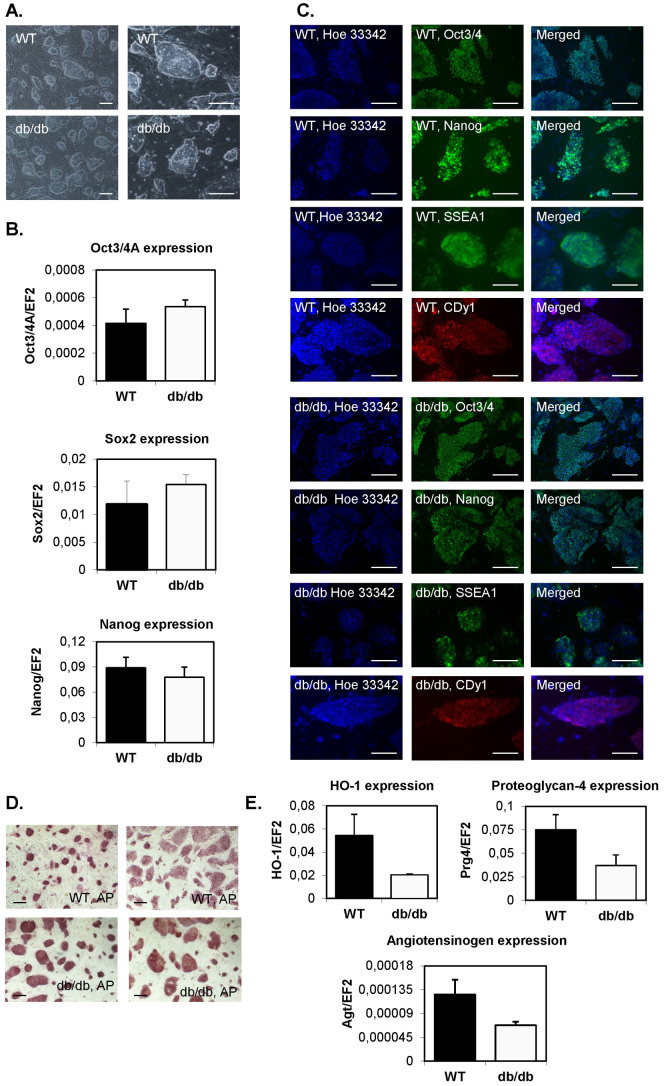
Mouse and human induced pluripotent stem cells (iPSCs) may represent a novel approach for modeling diabetes. Taking this into consideration, the aim of this study was to generate and evaluate differentiation potential of iPSCs from lep(db/db) (db/db) mice, the model of diabetes type 2 as well as from patients with Maturity Onset Diabetes of the Young 3 (HNF1A MODY). Murine iPSC colonies from both wild type and db/db mice were positive for markers of pluripotency: Oct3/4A, Nanog, SSEA1, CDy1 and alkaline phosphatase and differentiated in vitro and in vivo into cells originating from three germ layers. However, our results suggest impaired differentiation of db/db cells into endothelial progenitor-like cells expressing CD34 and Tie2 markers and their reduced angiogenic potential. Human control and HNF1A MODY reprogrammed cells also expressed pluripotency markers: OCT3/4A, SSEA4, TRA-1-60, TRA-1-81, formed embryoid bodies (EBs) and differentiated into cells of three germ layers. Additionally, insulin expressing cells were obtained from those partially reprogrammed cells with direct as well as EB-mediated differentiation method. Our findings indicate that disease-specific iPSCs may help to better understand the mechanisms responsible for defective insulin production or vascular dysfunction upon differentiation toward cell types affected by diabetes.


Figures

Figure 1
Figure 1. Generation of wild type (WT) and Lepdb/db (db/db) iPS cells.
(A). Morphology of WT and db/db iPS cells. Representative pictures (scale bar – 100 μm). (B). Expression of pluripotency markers: Oct3/4A, Nanog and Sox2 in control and db/db iPSCs. Quantitative RT-PCR analysis. N = 3. (C). Immunofluorescence staining of pluripotency markers: Oct3/4A, Nanog, SSEA1 and CDy1 in WT and db/db iPS cells (scale bar – 100 μm). (D). Expression of alkaline phosphatase in WT and db/db iPS cells. Representative pictures (scale bar – 100 μm). (E). Expression of genes associated with endothelial lineage development: HO-1, proteoglycan-4 and angiotensinogen. Quantitative RT-PCR analysis. N = 2. EF2 gene was used as housekeeping gene. Each bar represents mean + SEM. The numerical data presented in Fig. 1B and 1E were not statistically significant.
Figure 2
Figure 2. Differentiation potential of wild type (WT) and Lepdb/db (db/db) iPS cells.
(A). Embryoid bodies formed from iPS cells after seeding on non-adherent dishes without LIF stimulation (scale bar – 100 μm). (B). Outgrowth of cells from embryoid bodies after adherence to gelatin-coated dishes. Outgrowing cells were further differentiating (scale bar – 100 μm). (C,D). Immunofluorescence staining of markers characteristic for three different germ layers after two weeks of spontaneous differentiation via embryoid bodies of WT iPS cells (C) or db/db iPS cells (D). Gata4 – marker of early and defined endoderm as well as mesoderm; nestin – marker of ectoderm; vimentin – marker of mesoderm. Representative pictures (scale bar – 100 μm). (E,F). Teratoma formation assay – representative pictures demonstrating tissues originating from three germ layers within a tumor developed after subcutaneous injection of WT iPS cells (E, N = 3) or db/db iPS cells (F, N = 4) into immunocompromised mice. Upper – muscles (mesodrem), middle – epidermis (ectoderm), bottom – ciliated epithelium (endoderm) (scale bar – 100 μm).
Figure 3
Figure 3. Differentiation of wild type (WT) and Lepdb/db (db/db) iPS cells into endothelial progenitor-like cells.
(A). FACS analysis of CD34+Tie-2+ population in WT and db/db iPSC-derived cells before differentiation (day 0) and after establishing the differentiated cell lines (day 60). Representative dot-plots. Control – unstained cells. (B). Morphology of WT and db/db iPSC-derived endothelial progenitor-like cell lines at 130th day of culture. Representative pictures. (C). Immunofluorescence staining of von Willebrand Factor (vWF), phosphorylated endothelial nitric oxide synthase (phosp eNOS), and vascular endothelial growth factor receptor 1 (Flt-1) in WT and db/db iPSC-derived endothelial progenitor-like cells (scale bar – 100 μm). (D). Nitric oxide production by WT and db/db iPSC-derived endothelial progenitor-like cells. Gas-phase chemiluminescence reaction (n = 3). (E). Sprouting spheres embedded in collagen, generated from WT and db/db iPSC-derived endothelial progenitor-like cells or lung primary CD34+ endothelial cells isolated from WT and db/db mice. Representative pictures (scale bar – 100 μm). (F,G). Average number of sprouts and total length of sprouts measured for sprouting spheres embedded in collagen, generated from WT (n = 12 spheres) and Lepdb/db (n = 10 spheres) iPSC-derived endothelial progenitor-like cells (F) or lung primary CD34+ endothelial cells isolated from WT (N = 5) and db/db (N = 4) mice (G). Each bar represents mean + SEM. * p < 0.05, *** p < 0.001.
Figure 4
Figure 4. Generation of human reprogrammed cells from fibroblasts of control healthy subjects and HNF1A MODY patients.
(A). Morphology of cells from healthy subject before (day 0) and 13 days after transduction (day 13) with hSTEMCCA lentiviral vectors. Colonies resembling human embryonic stem cells, visible at day 13, were further expanded (expanded colony, shown at passage 2). GFP - expression of GFP in human primary fibroblast isolated from HNF1A MODY patients, 72 after transduction with control (FUGW) lentiviral vectors. Representative pictures (scale bar – 100 μm). (B). Analysis of hSTEMCCA construct silencing in established control (effective silencing in Ctr Repro 2 cell line) and HNF1A MODY reprogrammed cells (effective silencing in HNF1A MODY Repro 1 cell line). RT-PCR. (C,D). Immunofluorescence staining of pluripotency markers: OCT3/4A, SSEA4, TRA-1-60, TRA-1-81 in control reprogrammed cells (C) and HNF1A MODY reprogrammed cells (D). Representative pictures (scale bar – 100 μm).
Figure 5
Figure 5. Differentiation potential of human control and HNF1A MODY reprogrammed cells.
(A,B). Immunofluorescence staining of markers characteristic for three different germ layers after two weeks of spontaneous differentiation via embryoid bodies. A – differentiating control reprogrammed cells. B – differentiating HNF1A MODY reprogrammed cells. GATA4 – marker of early and defined endoderm as well as mesoderm; neurofilament heavy chain (NF-H) – marker of ectoderm; α smooth muscle actin (αSMA) – marker of mesoderm (scale bar – 100 μm). (C). Histological staining of epithelial tumor formed in immunocompromised mouse after injection of human control reprogrammed cells. Representative pictures (scale bar – 100 μm).
Figure 6
Figure 6. Differentiation of human reprogrammed cells to pancreatic lineage.
(A). Schematic representation of direct differentiation method. (B). Morphological changes of HNF1A MODY Repro 1 line during direct differentiation (scale bar – 100 μm). (C). Schematic representation of embryoid body-mediated differentiation method. (D). Morphological changes of HNF1A MODY Repro 1 line during embryoid body-mediated differentiation. Representative pictures (scale bar – 100 μm).
Figure 7
Figure 7. Expression of markers of pancreatic differentiation in cells derived from human control and HNF1A MODY reprogrammed cells.
(A). Expression of markers in cells subjected to direct differentiation method. (B). Expression of markers in cells subjected to embryoid bodies-mediated method. Agarose gel electrophoresis of representative RT-PCR products. In case of direct differentiation RT-PCR was performed for cells from each patients and in case of embryoid bodies-mediated differentiation RT-PCR was performed in duplicates. EF2 was used as a housekeeping control for each performed reaction. (C). The efficiency of detection of pancreatic differentiation markers (both differentiation methods are combined, n = 3–5). Percentage of positive RT-PCR results in relation to expression of EF2 housekeeping gene which was detected in all analysed samples. (D). Production of glucagon in differentiated Panc-1 cells as well as control and HNF-1A MODY reprogrammed cells differentiated with embryoid bodies-mediated method (EB) and direct method (direct). Medium – media used to perform the last step of differentiation (in case of Panc-1 cells one type of medium was utilized); cells – media collected from differentiated cells in the last day of differentiation (n = 2).

References

    1. Danaei G. et al. National, regional, and global trends in fasting plasma glucose and diabetes prevalence since 1980: systematic analysis of health examination surveys and epidemiological studies with 370 country-years and 2.7 million participants. Lancet 378, 31–40 (2011). - PubMed
    1. Petersen K. F. & Shulman G. I. Etiology of insulin resistance. Am J Med 119(Suppl 1),10–16 (2006). - PMC - PubMed
    1. Kahn C. R. Banting Lecture. Insulin action, diabetogenes, and the cause of type II diabetes. Diabetes 43, 1066–1084 (1994). - PubMed
    1. Roberts A. C. & Porter K. E. Cellular and molecular mechanisms of endothelial dysfunction in diabetes. Diab Vasc Dis Res 10, 472–482 (2013). - PubMed
    1. Chen H. et al. Evidence that the diabetes gene encodes the leptin receptor: identification of a mutation in the leptin receptor gene in db/db mice. Cell 84, 491–495 (1996). - PubMed

Publication types

MeSH terms