. 2015 Feb 25;7(3):856-70.
doi: 10.1093/gbe/evv035.

Insights on the emergence of Mycobacterium tuberculosis from the analysis of Mycobacterium kansasii

Affiliations

Insights on the emergence of Mycobacterium tuberculosis from the analysis of Mycobacterium kansasii

Joyce Wang et al. Genome Biol Evol. .

Abstract

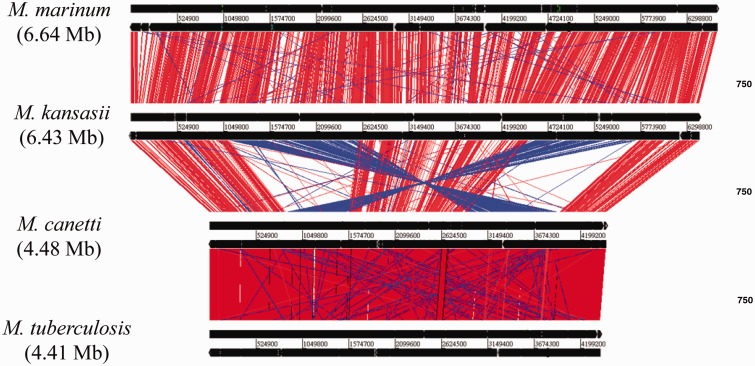
By phylogenetic analysis, Mycobacterium kansasii is closely related to Mycobacterium tuberculosis. Yet, although both organisms cause pulmonary disease, M. tuberculosis is a global health menace, whereas M. kansasii is an opportunistic pathogen. To illuminate the differences between these organisms, we have sequenced the genome of M. kansasii ATCC 12478 and its plasmid (pMK12478) and conducted side-by-side in vitro and in vivo investigations of these two organisms. The M. kansasii genome is 6,432,277 bp, more than 2 Mb longer than that of M. tuberculosis H37Rv, and the plasmid contains 144,951 bp. Pairwise comparisons reveal conserved and discordant genes and genomic regions. A notable example of genomic conservation is the virulence locus ESX-1, which is intact and functional in the low-virulence M. kansasii, potentially mediating phagosomal disruption. Differences between these organisms include a decreased predicted metabolic capacity, an increased proportion of toxin-antitoxin genes, and the acquisition of M. tuberculosis-specific genes in the pathogen since their common ancestor. Consistent with their distinct epidemiologic profiles, following infection of C57BL/6 mice, M. kansasii counts increased by less than 10-fold over 6 weeks, whereas M. tuberculosis counts increased by over 10,000-fold in just 3 weeks. Together, these data suggest that M. kansasii can serve as an image of the environmental ancestor of M. tuberculosis before its emergence as a professional pathogen, and can be used as a model organism to study the switch from an environmental opportunistic pathogen to a professional host-restricted pathogen.

Keywords: Mycobacterium kansasii; comparative genomics; mycobacteria; phylogeny; virulence.


Figures

F<sc>ig</sc>. 1.—
Fig. 1.—
Phylogenetic relationships among Mycobacterium genus. The phylogenetic tree was generated using RAxML. The scale bar represents amino acid changes per site. Rapid growing species are shadowed in orange, slow growing species are shadowed in yellow, and outgroup species are shadowed in green. Mycobacterium tuberculosis, M. canettii, and M. kansasii are boxed in red.
F<sc>ig</sc>. 2.—
Fig. 2.—
(A) Circular representation and annotation features of M. kansasii ATCC 12478 chromosome. The two outermost circles represent forward and reverse-strand CDS (red and blue, respectively). tRNA is shown in green, rRNA in orange, and ncRNA in black. The two innermost blue/gray and olive/purple circles represent G + C content and GC skew, respectively. (B) Circular representation of the pMK12478 plasmid. Forward and reverse CDS and G + C content and GC skew are labeled in the same color scheme as the chromosome. Genes coding for putative sigma factors are coded in black; MCE in dark purple; replication protein in green; toxin–antitoxin in yellow, putative T4SS in pink; putative T7SS in orange (NCBI annotation; Ummels et al. 2014).
F<sc>ig</sc>. 3.—
Fig. 3.—
Comparisons of the genomes of M. tuberculosis, M. canettii, M. kansasii, and M. marinum. Red lines indicate local colinear blocks of DNA–DNA similarity and blue lines indicate rearranged regions.
F<sc>ig</sc>. 4.—
Fig. 4.—
The proportion of genes in each subsystem in M. tuberculosis, M. canettii, and M. kansasii, Asterisks indicate the results of the statistical tests comparing M. tuberculosis and M. kansasii. Sample proportions were compared using a two-sample Z-test. ****P < 0.0001.
F<sc>ig</sc>. 5.—
Fig. 5.—
(A) Comparative growth of M. kansasii and M. tuberculosis in 7H9 at 37 °C. (B) Morphological characteristics of M. kansasii (top panel) and M. tuberculosis (bottom panel) on 7H10 agar.
F<sc>ig</sc>. 6.—
Fig. 6.—
(A) Top panel: SDS-PAGE analysis of mycobacterial culture filtrate proteins; lane 1: M. tuberculosis; lane 2: M. tuberculosis:ΔRD1; lane 3: M. tuberculosis:Δesat-6 ; lane 4: M. kansasii. Middle panel: Western blot showing the presence of ESAT-6 in M. tuberculosis and M. kansasii culture filtrates but not M. tuberculosis:ΔRD1 or M. tuberculosis:Δesat-6. Bottom panel: Band intensities measured by ImageJ and represented in histogram. (B) Schematic illustration of the organization of ESX-1 and orthologous genes in M. kansasii. Each gene is color-coded according to the degree of protein similarity when aligning M. kansasii amino acid sequence to that of M. tuberculosis. Mycobacterium kansasii genes that are orthologous to M. tuberculosis ESX genes but not organized in a gene cluster are boxed. Regions deleted in M. tuberculosis:ΔRD1 and M. tuberculosis:Δesat-6 are also indicated.
F<sc>ig</sc>. 7.—
Fig. 7.—
Mycobacterium tuberculosis and M. kansasii induced a change in fluorescence ratio starting on day 4 postinfection whereas M. tuberculosis:1 did not show such activity.
F<sc>ig</sc>. 8.—
Fig. 8.—
Bacterial burden in the lungs of mice infected through an aerosol route with M. tuberculosis, M. tuberculosis:ΔRD1, and M. kansasii over the course of 42 days.

References

    1. Abdallah AM, et al. Type VII secretion—mycobacteria show the way. Nat Rev Microbiol. 2007;5:883–891. - PubMed
    1. Alcaide F, et al. Heterogeneity and clonality among isolates of Mycobacterium kansasii: implications for epidemiological and pathogenicity studies. J Clin Microbiol. 1997;35:1959–1964. - PMC - PubMed
    1. Arend SM, et al. ESAT-6 and CFP-10 in clinical versus environmental isolates of Mycobacterium kansasii. J Infect Dis. 2005;191:1301–1310. - PubMed
    1. Aziz RK, et al. The RAST Server: rapid annotations using subsystems technology. BMC Genomics. 2008;9:75. - PMC - PubMed
    1. Belisle JT, Brennan PJ. Chemical basis of rough and smooth variation in mycobacteria. J Bacteriol. 1989;171:3465–3470. - PMC - PubMed

Publication types