. 2015 Feb 25;35(8):3663-75.
doi: 10.1523/JNEUROSCI.3555-14.2015.

Quantifying the microvascular origin of BOLD-fMRI from first principles with two-photon microscopy and an oxygen-sensitive nanoprobe

Affiliations

Quantifying the microvascular origin of BOLD-fMRI from first principles with two-photon microscopy and an oxygen-sensitive nanoprobe

Louis Gagnon et al. J Neurosci. .

Abstract

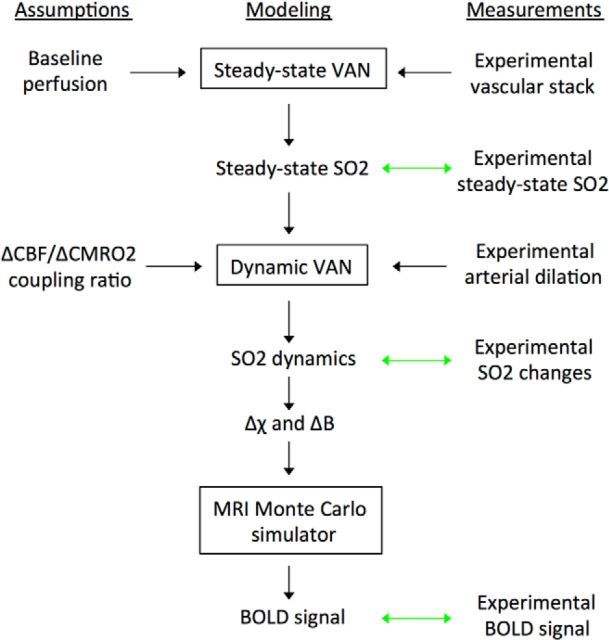
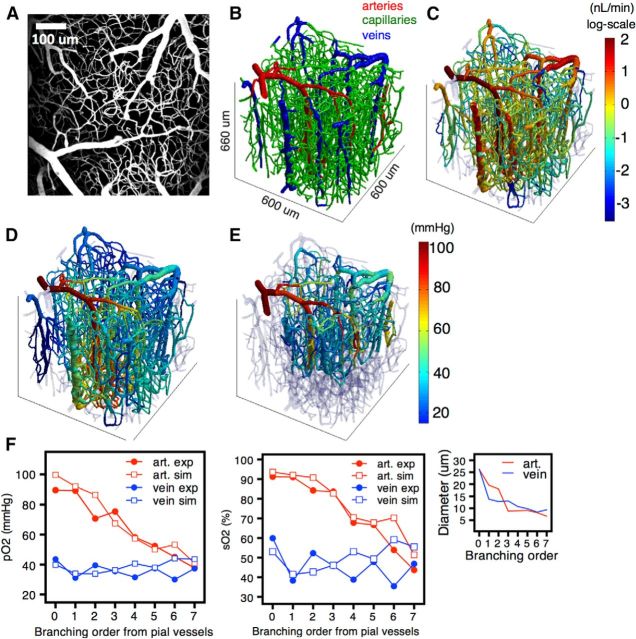
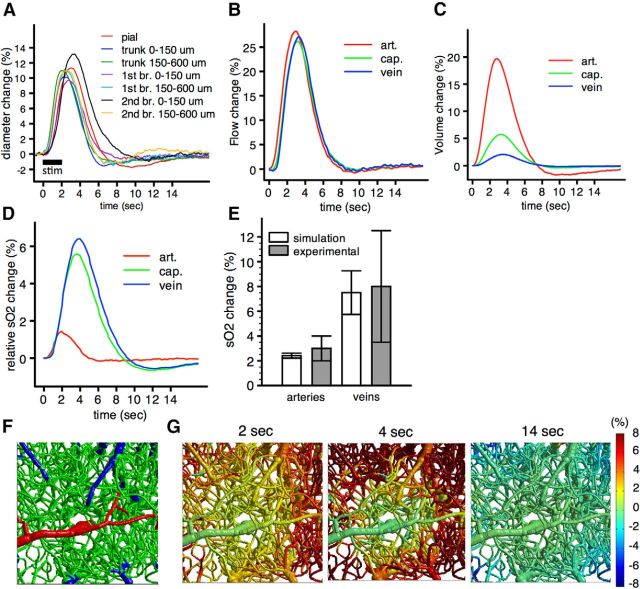
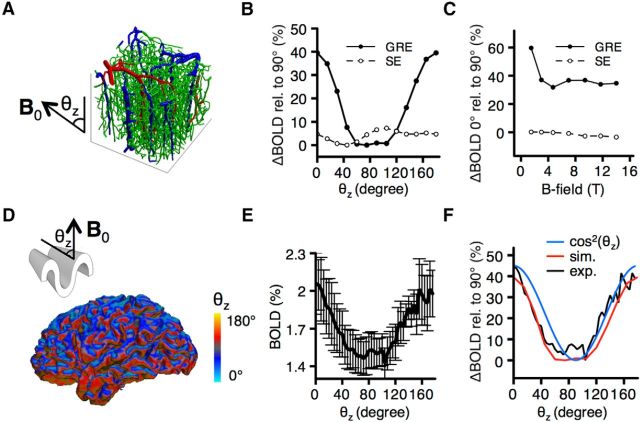
The blood oxygenation level-dependent (BOLD) contrast is widely used in functional magnetic resonance imaging (fMRI) studies aimed at investigating neuronal activity. However, the BOLD signal reflects changes in blood volume and oxygenation rather than neuronal activity per se. Therefore, understanding the transformation of microscopic vascular behavior into macroscopic BOLD signals is at the foundation of physiologically informed noninvasive neuroimaging. Here, we use oxygen-sensitive two-photon microscopy to measure the BOLD-relevant microvascular physiology occurring within a typical rodent fMRI voxel and predict the BOLD signal from first principles using those measurements. The predictive power of the approach is illustrated by quantifying variations in the BOLD signal induced by the morphological folding of the human cortex. This framework is then used to quantify the contribution of individual vascular compartments and other factors to the BOLD signal for different magnet strengths and pulse sequences.

Keywords: BOLD-fMRI; Monte Carlo; modeling; two-photon microscopy.


Figures

Figure 1.
Figure 1.
Overview of the modeling framework. Green arrows represent validations of the model against experimental measurements.
Figure 2.
Figure 2.
Construction of realistic vascular networks. A, TPM FITC angiogram of the mouse cortex. B, FEM mesh of the vasculature displaying arteries, capillaries, and veins. C, Blood flow distribution simulated across the vascular network assuming a global perfusion value of 100 ml/min/100 g. D, Distribution of the partial pressure of oxygen (pO2) simulated across the vascular network using the finite element method model. E, TPM experimental measurements of pO2 in vivo using PtP-C343 dye. F, Quantitative comparison of simulated and experimental pO2 and SO2 distributions across the vascular network for a single animal. Traces represent arterioles and capillaries (red) and venules and capillaries (blue) as a function of the branching order from pial arterioles and venules, respectively.
Figure 3.
Figure 3.
Modeling the physiological response to forepaw stimulus. A, TPM experimental measurements or arterial dilation following forepaw stimulus. B, Simulated flow changes, (C) simulated volume changes, and (D) simulated SO2 changes (all relative to baseline) in the different vascular compartments. E, Comparison of simulated SO2 changes (n = 6 animals) with experimental SO2 changes (n = 10 animals) measured in pial vessels during a forepaw stimulus with confocal microscopy. F, Vessel type. G, Spatiotemporal evolution of simulated SO2 changes following forepaw stimulus.
Figure 4.
Figure 4.
Modeling the fMRI signals from realistic vascular networks. A, Time series of SO2 volumes. B, Resulting time series of magnetic field perturbation volumes (contour lines) computed from the SO2 volumes at each time instant. C, Simulation of nuclear spins (n = 107) diffusing in the magnetic field perturbation volume. D, Spatial gradients applied to simulate GRE and SE signals. E, Time series of the simulated extravascular GRE and SE signals. F, Comparison of simulated GRE signal against experimental GRE signal measured during the same forepaw stimulus.
Figure 5.
Figure 5.
BOLD dependence on local folding of the cortex. A, Convention for the angle (θz) between the vector normal to the local cortical surface and the external magnetic field (represented by the arrow). B, Variation in the extravascular BOLD response at 3T predicted from simulations with θz ranging from 0° to 180° normalized by the BOLD response simulated for θz = 90°. C, Difference in the extravascular BOLD response simulated at θz = 0° relative to θz = 90° (in percentage relative to θz = 90°) for different B-field strengths (TE = T2, tissue*). D, Illustration of θz values computed in the gray matter of the human brain. E, Averaged BOLD responses measured in the gray matter of human subjects during a hypercapnic challenge as a function of θz. F, Comparison of angular dependence predicted from our simulations with angular dependence measured during the hypercapnic challenge in humans (n = 5 human subjects for experimental, n = 6 animals for simulations).
Figure 6.
Figure 6.
Statistics for vessel orientations and sizes. A, Histogram of vessel orientation with respect to the z-axis for arteries, capillaries, and veins. B, Mean vessel diameter as a function of vessel orientation with respect to the z-axis.
Figure 7.
Figure 7.
Compartment-specific contributions to the extravascular BOLD effect for different magnetic field strengths and cortical orientations. A, Averaged blood volume fractions and (B) averaged vascular volume fractions for individual vascular compartments computed across the six VAN models. C, Contributions of individual vascular compartment to the BOLD signal computed from the simulations (n = 6 animals).
Figure 8.
Figure 8.
Independent contributions of (A) oxygenation changes and (B) blood volume changes to the extravascular BOLD signal for different magnetic field strengths and cortical orientations (n = 6 animals).

References

    1. Attwell D, Buchan AM, Charpak S, Lauritzen M, Macvicar BA, Newman EA. Glial and neuronal control of brain blood flow. Nature. 2010;468:232–243. doi: 10.1038/nature09613. - DOI - PMC - PubMed
    1. Banzett RB, Garcia RT, Moosavi SH. Simple contrivance “clamps” end-tidal PCO(2) and PO(2) despite rapid changes in ventilation. J Appl Physiol. 2000;88:1597–1600. - PubMed
    1. Blinder P, Shih AY, Rafie C, Kleinfeld D. Topological basis for the robust distribution of blood to rodent neocortex. Proc Natl Acad Sci U S A. 2010;107:12670–12675. doi: 10.1073/pnas.1007239107. - DOI - PMC - PubMed
    1. Blinder P, Tsai PS, Kaufhold JP, Knutsen PM, Suhl H, Kleinfeld D. The cortical angiome: an interconnected vascular network with noncolumnar patterns of blood flow. Nat Neurosci. 2013;16:889–897. doi: 10.1038/nn.3426. - DOI - PMC - PubMed
    1. Boas DA, Jones SR, Devor A, Huppert TJ, Dale AM. A vascular anatomical network model of the spatio-temporal response to brain activation. Neuroimage. 2008;40:1116–1129. doi: 10.1016/j.neuroimage.2007.12.061. - DOI - PMC - PubMed

Publication types

Substances