. 2015 Feb 25;7(276):276ra24.
doi: 10.1126/scitranslmed.aaa4877.

Functional characterization of IgA-targeted bacterial taxa from undernourished Malawian children that produce diet-dependent enteropathy

Affiliations

Functional characterization of IgA-targeted bacterial taxa from undernourished Malawian children that produce diet-dependent enteropathy

Andrew L Kau et al. Sci Transl Med. .

Abstract

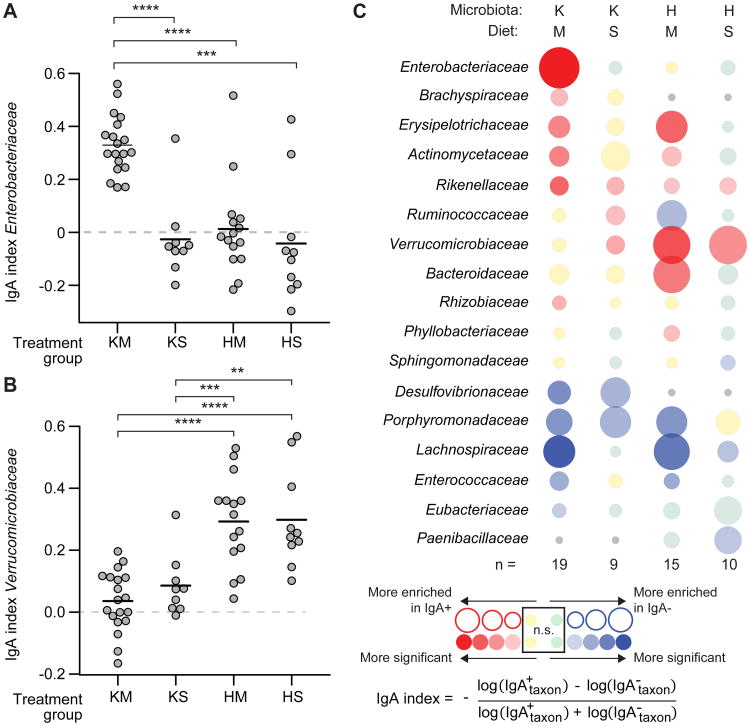
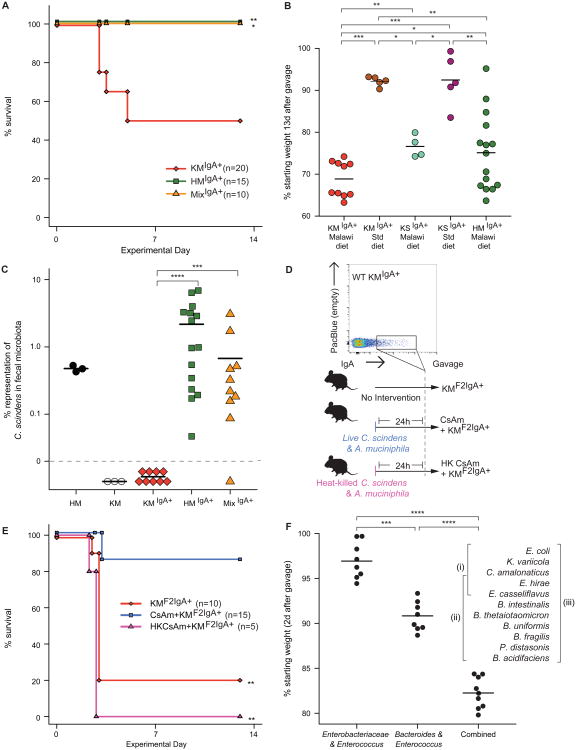
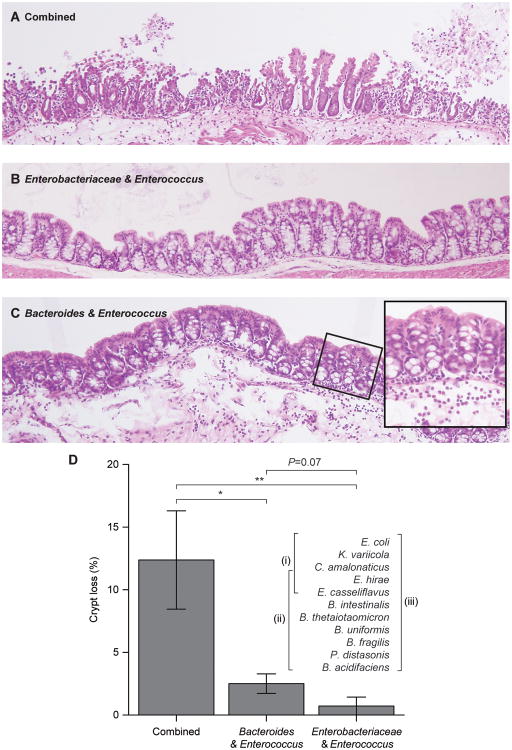
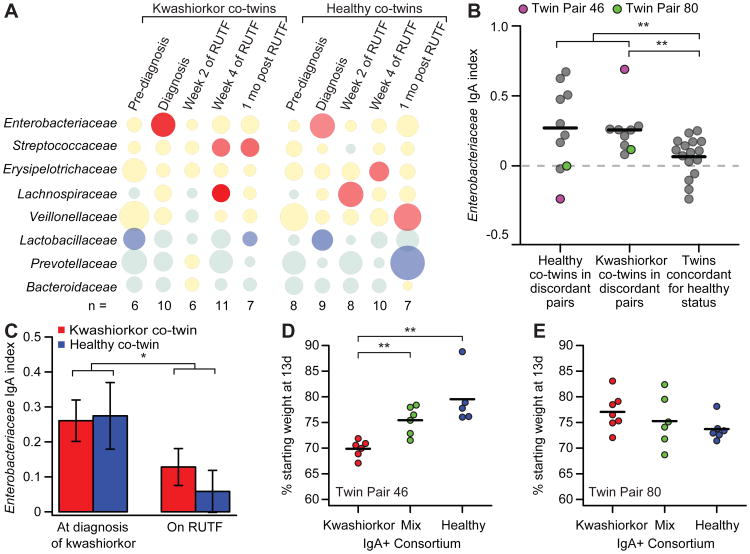
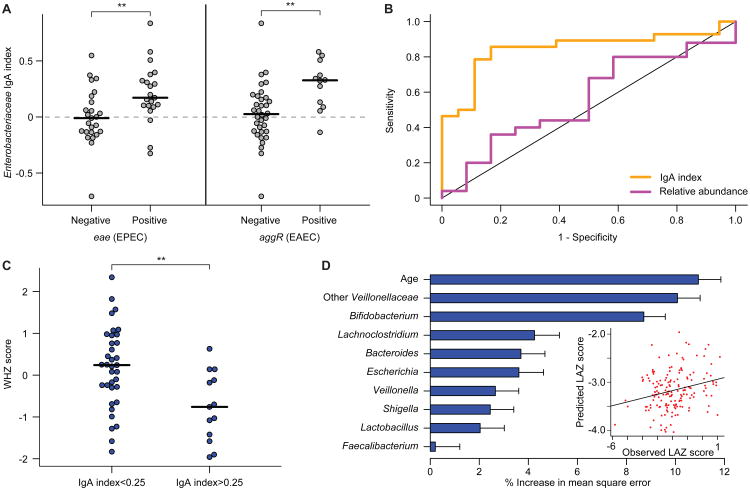
To gain insights into the interrelationships among childhood undernutrition, the gut microbiota, and gut mucosal immune/barrier function, we purified bacterial strains targeted by immunoglobulin A (IgA) from the fecal microbiota of two cohorts of Malawian infants and children. IgA responses to several bacterial taxa, including Enterobacteriaceae, correlated with anthropometric measurements of nutritional status in longitudinal studies. The relationship between IgA responses and growth was further explained by enteropathogen burden. Gnotobiotic mouse recipients of an IgA(+) bacterial consortium purified from the gut microbiota of undernourished children exhibited a diet-dependent enteropathy characterized by rapid disruption of the small intestinal and colonic epithelial barrier, weight loss, and sepsis that could be prevented by administering two IgA-targeted bacterial species from a healthy microbiota. Dissection of a culture collection of 11 IgA-targeted strains from an undernourished donor, sufficient to transmit these phenotypes, disclosed that Enterobacteriaceae interacted with other consortium members to produce enteropathy. These findings indicate that bacterial targets of IgA responses have etiologic, diagnostic, and therapeutic implications for childhood undernutrition.


Figures

Fig. 1
Fig. 1. IgA responses in humanized gnotobiotic colonized with the fecal microbiota of twins discordant for kwashiorkor
Diet- and microbiota-associated differences in IgA responses to bacterial taxa present in gnotobiotic mice containing transplanted microbiota from kwashiorkor or healthy co-twins from discordant pair 57. Separate groups of mice received fecal microbiota from either the kwashiorkor (K) or healthy (H) co-twin and were fed an irradiated (sterile) prototypic Malawian (M) diet (KM or HM groups) or a control nutrient-sufficient standard (S) mouse chow (KS and HS groups). Fecal samples collected from recipient mice 13-16 days after gavage of the human donor microbiota were analyzed by BugFACS. Results shown are from two independent experiments. (A) Enterobacteriaceae were significantly enriched in the IgA+ fraction prepared from the fecal microbiota of KM mice compared to all other groups of animals, indicating the microbiota and diet specificity of the gut mucosal immune response. Each data point represents a fecal microbiota sample from a different animal. (B) Mice colonized with the microbiota from the healthy co-twin had an IgA response to Verrucomicrobiaceae that was significantly greater than the responses of mice harboring microbiota from the sibling with kwashiorkor. ** P < 0.01; *** P < 0.001; ****, P < 0.0001 (Wilcoxon rank-sum test). (C) ‘Bubble plot’ depicting IgA responses (defined by the IgA index) to different family-level bacterial taxa. Each column represents a different group of gnotobiotic mice while each row shows the relative enrichment of a given family-level taxon in the IgA+ or IgA- fraction. The color of the circle represents the direction of enrichment, with darker colors indicating greater significance as determined by paired Wilcoxon test (threshold for significantly enriched, P < 0.05). The diameter of a given circle represents the average magnitude of enrichment for a given taxon in the fecal microbiota of members of a given treatment group. n, number of gnotobiotic mice analyzed per treatment group (see table S2 for IgA indices for members of each family-level taxon shown). ns, not significant. Gray circles indicate that a taxon was not observed within a given treatment group.
Fig. 2
Fig. 2. Bacterial targets of IgA responses to kwashiorkor and healthy co-twin microbiota, introduced into germ-free mice
Adult germ-free C57BL/6J mice were fed an irradiated Malawian diet starting one week prior to gavage with IgA+ fractions. These fractions were purified from fecal microbiota obtained from KM or HM mice 42 days after they had been colonized with the respective co-twin's microbiota. Following gavage, the recipient mice were maintained on the Malawian diet. (A) KMIgA+ mice (n=20) experienced significantly greater mortality than HMIgA+ mice (n=15). Mice that received an equivalent number of cells from IgA+ consortia purified from HM and KM mouse fecal microbiota did not exhibit mortality during the course of the experiment (MixIgA+, n=10). *, P<0.05; **, P<0.01 compared to KMIgA+ group (Fisher's Exact test). Results represent data from two independent experiments. (B) Impact of diet. KMIgA+ mice fed a Malawian diet lost more weight over a 2-week period following colonization than did animals colonized with the same IgA+ consortium but fed a standard nutrient-sufficient mouse chow. Mice receiving the IgA+ consortium purified from the fecal microbiota of mice harboring the same family 57 kwashiorkor donor microbiota but fed a standard mouse chow (KSIgA+ mice) lost less weight than did KMIgA+ mice, regardless of whether they were fed the Malawian diet or a standard mouse chow. *, P<0.05; **, P<0.01; ***, P<0.001 (Wilcoxon rank-sum test). (C) Clostridium scindens was present in the fecal microbiota of HM, HMIgA+ and MixIgA+ mice, but was not detectable in the microbiota of KM or KMIgA+ animals. ***, P< 0.001; ****, P< 0.0001 (Wilcoxon rank-sum test). (D) Experimental design of a follow-up experiment where three groups of adult germ-free male mice were gavaged with an IgA+ consortium purified by BugFACS from the fecal microbiota of surviving KMIgA+ mice. All recipients [second generation (F2) KMF2IgA+ mice] were fed the Malawian diet. The first group of these KMF2IgA+ mice received no intervention (n=10). Another group received an equal mixture of live C. scindens and A. muciniphila by gavage 24 h before introduction of the IgA+ consortium purified from KMIgA+ mice (CsAm + KMF2IgA+, n=15). A third group was gavaged with heat-killed C. scindens and A. muciniphila 24 h prior to introduction of the IgA+ consortium (heat-killed CsAm + KMF2IgA+, n=5). (E) CsAm + KMF2IgA+ mice exhibited significantly reduced mortality compared to either KMF2IgA+ or heat-killed CsAm + KMF2IgA+ animals. **, P< 0.01 (Fisher's Exact test). (F) Effects of colonizing germ-free mice fed a Malawian diet with different components of the 11 OTU culture collection, generated from KMF2IgA+ microbiota, on weight. Data for individual mice in each treatment group are plotted. ****, P<0.0001 (Wilcoxon rank-sum test).
Fig. 3
Fig. 3. Identifying bacterial strains that transmit gut barrier disruption phenotypes
Adult germ-free mice consuming the prototypic Malawian diet were gavaged with all 11 OTUs contained in the clonally arrayed culture collection generated from the cecal microbiota of KMF2IgA+ mice, or two subsets of the culture collection: a consortium of the five strains belonging to Enterobacteriaceae (E. coli, K. variicola, C. amalonaticus) and Enterococcus (E. hirae and E. casseliflavus) or a consortium of 8 strains that included all but the three strains of Enterobacteriaceae in the collection (see table S3 for details about the genome sequences of these organisms, including their virulence factor content). All animals were sacrificed 2 days after gavage and hematoxylin and eosin stained sections of their proximal colons were prepared. (A) Colonization with the 11 OTU consortium produced generalized disruption of the colonic epithelium with marked loss of crypts. (B) The epithelium and crypt numbers were preserved in mice harboring the 5-strain consortium. (C) The 8-strain consortium lacking members of Enterobacteriaceae did not produce the epithelial disruption seen with the entire 11-strain consortium and crypts were largely preserved. However, there was an associated neutrophil infiltrate in the lamina propria (highlighted in inset). (D) Quantification of crypt number per unit area of the colonic epithelium. *, P<0.05; **, P<0.01 (Wilcoxon rank-sum test).
Fig. 4
Fig. 4. Enterobacteriaceae are targeted by the gut mucosal IgA response in children from the Malawian twin study
(A) IgA responses were defined by BugFACS of fecal samples obtained from 11 twin pairs discordant for kwashiorkor. Data from five time points are shown. The first column represents samples taken 1.2±0.6 months prior to diagnosis of kwashiorkor (“Pre-diagnosis”). The second column represents samples taken at the time of diagnosis (“Diagnosis”). The third column and fourth columns are samples taken 2 and 4 weeks after initiation of treatment with RUTF, while the fifth column represents fecal microbiota characterized 1 month after the completion of RUTF therapy. Data represent mean values for the indicated number (n) of kwashiorkor co-twins and healthy co-twins whose fecal samples were available, and are presented in the form of a bubble plot. See table S1 and table S4 for clinical characteristics and details of the datasets, including IgA indices for individual taxa identified as present within each family-level taxonomic group for each individual fecal sample analyzed. (B) At the time of diagnosis, the IgA index for Enterobacteriaceae was significantly higher in co-twins with kwashiorkor in discordant pairs than in twin pairs concordant for healthy status (data from twins concordant for healthy status represent the averaged IgA indices of an individual's fecal specimens obtained between 6 and 24 months of age in order to allow for comparison with discordant twins of varying ages at the time of diagnosis). Purple and green circles highlight IgA indices for co-twins in discordant pairs 46 and 80 who were used for microbial adoptive transfer experiments (see panels D and E). **, P<0.01 (Wilcoxon rank-sum test). (C) Treatment of kwashiorkor co-twins in the discordant pairs shown in panel A with RUTF resulted in a significant decrease in the IgA index score for Enterobacteriaceae. *, P<0.05 (Wilcoxon rank-sum test). Data represent the average IgA index scores for samples obtained 2 and 4 weeks after initiation of RUTF treatment. Mean values ± SEM are plotted. (D) Germ-free mice colonized with a BugFACS-purified IgA+ consortium from the kwashiorkor child in twin pair 46 lost more weight than mice colonized with either the IgA+ consortium purified from the fecal microbiota of his healthy co-twin or a mixture of the two IgA+ populations. **, P<0.01 (Wilcoxon Rank sum). (E) Colonization of germ-free mice with KwashIgA+, HealthyIgA+ or MixIgA+ consortia prepared from discordant twin pair 80 whose members had similar IgA index values for Enterobacteriaceae (see panel B) did not exhibit significant differences in weight loss (n=5-7 mice/treatment group). All mice were fed the Malawian diet starting 1 week before gavage with the IgA+ consortia. Body weights at the time of sacrifice 13 days post-gavage were used to plot the data shown (each mouse represented by a circle).
Fig. 5
Fig. 5. Relationships among IgA indices, enteropathogen burden and nutritional status in 18 month-old Malawian children from the LCNI-5 cohort
(A) IgA indices for Enterobacteriaceae were significantly higher in children that harbored EPEC and EAEC in their microbiota. Each circle represents results from an individual child. **, P<0.01 (Wilcoxon rank-sum test). (B) Receiving Operating Characteristic (ROC) curves for detection of EPEC (eae) and/or EAEC (aggR) using either Enterobacteriaceae relative abundance (purple, defined by V2-16S rRNA sequencing) or Enterobacteriaceae IgA index (orange). Samples were excluded where Enterobacteriaceae were not detected by 16S rRNA sequencing. The correlation to the presence of eae or aggR was significant for IgA index (P < 0.01; binomial logistic regression) but not relative abundance. (C) 18 month-old children from the LCNI-5 cohort with an IgA index value greater than 0.25 for Enterobacteriaceae had lower WHZ scores than did children with an index value less than 0.25. **, P<0.01 (unpaired Student's t-test). (D) Feature importance scores of bacterial taxa that are predictive of LAZ scores were generated by training a sparse Random Forests model using age and genus-level IgA index data from 134 fecal samples collected from the 11 kwashiorkor discordant twin pairs and the eight concordant healthy pairs enrolled in the Malawi Twin Study. To build the model, we included genus-level taxa (features) that had an IgA index value greater than 0.05 or less than -0.05 in 30% of all fecal samples (to remove genera that were only rarely seen and/or had very little enrichment in either the IgA+ or IgA- fractions). The IgA indices for the 25 taxa that satisfied this criterion were regressed against LAZ, and feature importance scores for each genus-level taxon were defined (mean±SD values shown). Shown are the nine genus-level taxa with mean importance scores greater than 1.5% that were incorporated into a 10 feature sparse model, which also included the chronological age of a child. The R2 value of 0.23 represents the goodness of fit of the model when applied to the twin training set, as defined using out-of-bag predictions. The plot in the inset shows that application of this model to 165 fecal samples collected from 6- and 18-month old singleton children in the LCNI-5 study predicted LAZ scores that correlated significantly with their actual LAZ measurements (Spearman's rho=0.2, P=0.009).

References

    1. Levels and Trends in Child Malnutrition, UNICEF-WHO-The World Bank Joint Child Malnutrition Estimates. 2012 URL: http://www.who.int/nutgrowthdb/estimates/en/
    1. Black RE, Victora CG, Walker SP, Bhutta ZA, Christian P, de Onis M, Ezzati M, Grantham-McGregor S, Katz J, Martorell R, Uauy R. Maternal and child undernutrition and overweight in low-income and middle-income countries. Lancet. 2013;382:427–451. - PubMed
    1. Ruel MT, Alderman H. Nutrition-sensitive interventions and programmes: how can they help to accelerate progress in improving maternal and child nutrition? Lancet. 2013;382:536–551. - PubMed
    1. Yatsunenko T, Rey FE, Manary MJ, Trehan I, Dominguez-Bello MG, Contreras M, Magris M, Hidalgo G, Baldassano RN, Anokhin AP, Heath AC, Warner B, Reeder J, Kuczynski J, Caporaso JG, Lozupone CA, Lauber C, Clemente JC, Knights D, Knight R, Gordon JI. Human gut microbiome viewedacross age and geography. Nature. 2012;486:222–227. - PMC - PubMed
    1. Subramanian S, Huq S, Yatsunenko T, Haque R, Mahfuz M, Alam MA, Benezra A, DeStefano J, Meier MF, Muegge BD, Barratt MJ, VanArendonk LG, Zhang Q, Province MA, Petri WA, Jr, Ahmed T, Gordon JI. Persistent gut microbiota immaturity in malnourished Bangladeshi children. Nature. 2014;510:417–421. - PMC - PubMed

Publication types

Substances