. 2015 May 1;113(9):3076-89.
doi: 10.1152/jn.00229.2014. Epub 2015 Feb 25.

The effect of force feedback delay on stiffness perception and grip force modulation during tool-mediated interaction with elastic force fields

Affiliations

The effect of force feedback delay on stiffness perception and grip force modulation during tool-mediated interaction with elastic force fields

Raz Leib et al. J Neurophysiol. .

Abstract

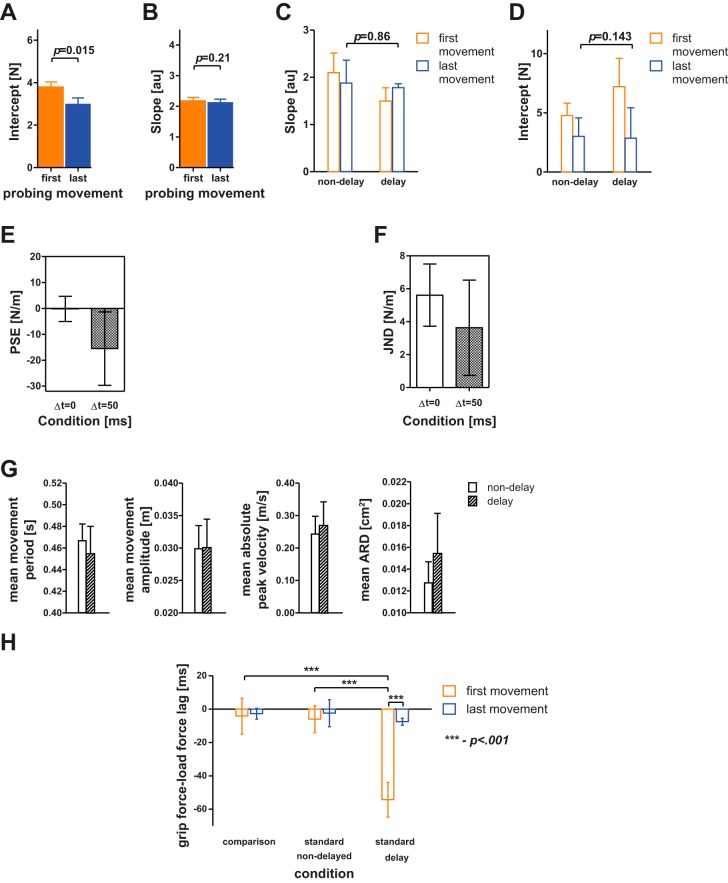
During interaction with objects, we form an internal representation of their mechanical properties. This representation is used for perception and for guiding actions, such as in precision grip, where grip force is modulated with the predicted load forces. In this study, we explored the relationship between grip force adjustment and perception of stiffness during interaction with linear elastic force fields. In a forced-choice paradigm, participants probed pairs of virtual force fields while grasping a force sensor that was attached to a haptic device. For each pair, they were asked which field had higher level of stiffness. In half of the pairs, the force feedback of one of the fields was delayed. Participants underestimated the stiffness of the delayed field relatively to the nondelayed, but their grip force characteristics were similar in both conditions. We analyzed the magnitude of the grip force and the lag between the grip force and the load force in the exploratory probing movements within each trial. Right before answering which force field had higher level of stiffness, both magnitude and lag were similar between delayed and nondelayed force fields. These results suggest that an accurate internal representation of environment stiffness and time delay was used for adjusting the grip force. However, this representation did not help in eliminating the bias in stiffness perception. We argue that during performance of a perceptual task that is based on proprioceptive feedback, separate neural mechanisms are responsible for perception and action-related computations in the brain.

Keywords: delay; explorative palpation; grip force; internal representation; stiffness perception.


Figures

Fig. 1.
Fig. 1.
Experimental setup. A and B: virtual reality system with a haptic device. The yellow square represents the horizontal position of the hand of the participant, and the green square represents a button for switching between the elastic force fields. In the constrained-joint conditions, participants pivoted their probing movement using either the wrist (A) or the shoulder joints (B). C: top view from above of the robot. The participant grasps a custom-made force-sensing fixture that was attached to the haptic device. D: side view of the robot. White arrows represent direction of the force field. E: schematics of the experimental protocol for the constrained-joints group. The participants performed 2 sessions of 180 comparisons between pairs of force fields. Participants performed the sessions in 2 consecutive days, and each session was performed with either the wrist or the shoulder joints pivoting the movement.
Fig. 2.
Fig. 2.
Examples of grip force and force trajectories during interaction with the linear elastic force fields. A, top: example of force (solid blue) that was applied by a linear elastic force field with a stiffness level of 120 N/m and the grip force (dashed green) of the participant during a single trial. Light blue shaded rectangles highlight the first and last probing movements. A, bottom: tool position. In this example, the movements were pivoted around the wrist. B: first and last probing movements of the trajectory in A. The circle symbol indicates the time of probing movement start and the star symbol indicates the time of probing movement end. C: grip force-load force trajectories of the first (orange full symbols) and last (blue empty symbols) probing movements of the example in B. For both trajectories, we fitted linear regression lines from which we extracted the slope and intercept point. The red symbol “s” represents the start of each trajectory. D: similar to C, but for 2 different elastic force field stiffness levels: 40 N/m (square markers solid line) and 130 N/m (triangle marker dashed line). While the trajectories are different in the initial probing, they become similar in the last probing regardless of the stiffness of the elastic force field.
Fig. 3.
Fig. 3.
Decrease in grip force magnitude during interaction with nondelayed elastic force fields. Mean intercept value (A) and slope value (B) in the first and last probing movements, averaged across stiffness levels and joint conditions. Color indicates probing movement: orange: first probing movement; blue: last probing movement. Error bars represent the 95% confidence intervals that were calculated using t-distribution. The statistically significant decrease in the value of the intercept between the 2 probing movements indicates a decrease in grip force magnitude.
Fig. 4.
Fig. 4.
Adjustment of grip force during interaction with linear springs. Each point represents a mean of the slopes (A and B) and intercepts (C and D) of the linear regression lines that were fitted to the grip force-load force trajectories from interactions with nondelayed elastic force fields with a given stiffness level. A and C: results from the shoulder condition. B and D: results from the wrist condition of all the participants. The shaded area represents the 95% confidence intervals that were calculated using t-distribution. Colors and symbols indicate the probing movement: orange filled squares: first probing movement; blue empty circles: last probing movement.
Fig. 5.
Fig. 5.
Perception of stiffness with and without force feedback delay. A: example of psychometric curves of a typical participant: the probability to answer that the comparison force field had higher level of stiffness as a function of the difference between the stiffness levels of the comparison and the standard force fields. Dashed lines represent the trials with delayed force feedback, and solid lines represent the nondelayed standard force fields. The estimated point of subjective equality (PSE) values and their 95% confidence intervals are represented by horizontal lines at probability of 0.5. B: PSE averaged across participants. Delay caused underestimation of the stiffness of the standard elastic force field, as indicated by a negative PSE in both the wrist and the shoulder joints. This effect is stronger in the wrist condition compared with the shoulder condition. C: just noticeable difference (JND) averaged across participants. There were no statistically significant effects of delay or joint on subjects' stiffness discrimination sensitivity. Bars are means and error bars are 95% confidence intervals calculated using the t-distribution.
Fig. 6.
Fig. 6.
Comparison of movement kinematics during the shoulder session (“s”) and wrist session (“w”) between the delayed and nondelayed standard force fields. There were no statistically significant differences in any of the tested movement metrics between the probing movements in the delayed and the nondelayed force fields. Bars represent estimated means and error bars are 95% confidence intervals estimated using t-distribution.
Fig. 7.
Fig. 7.
Examples of grip force and load force trajectories during interaction with an elastic force field with a delayed force feedback. All the notations are similar to Fig. 2B. A: light blue shaded rectangles represent the temporal difference between peak displacement and peak force. The peak grip force shifted between the first and last probing movements, as can be seen by its position relative to these rectangles. B: in the first probing movement, the trajectory ellipse is much wider because the grip force leads the force by additional 50 ms. This temporal lead is decreased in the last probing movement, and the trajectory becomes similar to the nondelayed case (compare with Fig. 2, C and D).
Fig. 8.
Fig. 8.
Adjustment of grip force during interaction with elastic force fields under delayed force feedback. A: each bar represents the mean slope value calculated using linear regression fitted to the grip force-load force trajectory. Error bars represent 95% confidence intervals calculated using t-distribution. Colors and pattern represent the probing movement and joints, respectively: orange: first probing movement; blue: last probing movement. Clear bars: shoulder movements; pattern-filled bars: wrist movements. B: same notation as in A but for the intercept of the regression line.
Fig. 9.
Fig. 9.
Analysis of the time lag between grip force and load force. Mean lag between the grip force and load force during the first probing (orange bars) and last probing movements (blue bars) of the 3 types of force fields that the participants interacted with in our experiment, comparison (nondelayed with various stiffness levels), nondelayed standard, and delayed standard. The joint is indicated by bar pattern: pattern-filled bars for the wrist and clear bars for the shoulder. Delayed force feedback causes a shift in the lag between grip force and force in the first movements, but the correct lag is restored in the last probing movements. Error bars represent 95% confidence intervals that were calculated using t-distribution.
Fig. 10.
Fig. 10.
Analysis of grip force magnitude, stiffness perception, and time lag between grip force and load force for unconstrained joints condition. Mean intercept value (A) and slope value (B), averaged across stiffness levels. Between first and last probing movement, the intercept decreased while the slope remained the same suggesting that the grip force magnitude decreased during the course of interaction with nondelayed elastic force fields. Mean slope value (C) and intercept value (D) calculated from the grip force-load force trajectories in the delayed and the nondelayed standard force fields. E: PSE averaged across participants. Similar to the constrained joint condition, delay caused underestimation of the stiffness of the standard elastic force field. F: JND averaged across participants. G: comparison of kinematic metrics between the delayed (pattern-filled bars) and nondelayed (clear bars) standard fields. All movement metrics were similar between the 2 force fields. ARD, area reach deviation. H: mean lag between the grip force and load force during the first probing (orange bars) and last probing movements (blue bars). In A–H, error bars are 95% confidence intervals estimated using t-distribution.

References

    1. Aglioti S, DeSouza JF, Goodale MA. Size-contrast illusions deceive the eye but not the hand. Curr Biol 5: 679–685, 1995. - PubMed
    1. Blakemore S, Frith C, Wolpert D. The cerebellum is involved in predicting the sensory consequences of action. Neuroreport 12: 1879–1884, 2001. - PubMed
    1. Blakemore SJ, Goodbody SJ, Wolpert DM. Predicting the consequences of our own actions: the role of sensorimotor context estimation. J Neurosci 18: 7511–7518, 1998. - PMC - PubMed
    1. Bringoux L, Lepecq JC, Danion F. Does visually induced self-motion affect grip force when holding an object? J Neurophysiol 108: 1685–1694, 2012. - PubMed
    1. Bruno N. When does action resist visual illusions? Trends Cogn Sci 5: 379–382, 2001. - PubMed

Publication types

LinkOut - more resources