. 2015 Apr 1;113(7):2742-52.
doi: 10.1152/jn.00575.2014. Epub 2015 Feb 25.

Lempel-Ziv complexity of cortical activity during sleep and waking in rats

Affiliations

Lempel-Ziv complexity of cortical activity during sleep and waking in rats

Daniel Abásolo et al. J Neurophysiol. .

Abstract

Understanding the dynamics of brain activity manifested in the EEG, local field potentials (LFP), and neuronal spiking is essential for explaining their underlying mechanisms and physiological significance. Much has been learned about sleep regulation using conventional EEG power spectrum, coherence, and period-amplitude analyses, which focus primarily on frequency and amplitude characteristics of the signals and on their spatio-temporal synchronicity. However, little is known about the effects of ongoing brain state or preceding sleep-wake history on the nonlinear dynamics of brain activity. Recent advances in developing novel mathematical approaches for investigating temporal structure of brain activity based on such measures, as Lempel-Ziv complexity (LZC) can provide insights that go beyond those obtained with conventional techniques of signal analysis. Here, we used extensive data sets obtained in spontaneously awake and sleeping adult male laboratory rats, as well as during and after sleep deprivation, to perform a detailed analysis of cortical LFP and neuronal activity with LZC approach. We found that activated brain states-waking and rapid eye movement (REM) sleep are characterized by higher LZC compared with non-rapid eye movement (NREM) sleep. Notably, LZC values derived from the LFP were especially low during early NREM sleep after sleep deprivation and toward the middle of individual NREM sleep episodes. We conclude that LZC is an important and yet largely unexplored measure with a high potential for investigating neurophysiological mechanisms of brain activity in health and disease.

Keywords: Lempel-Ziv complexity; local field potentials; neuronal activity; rats; sleep.


Figures

Fig. 1.
Fig. 1.
A: representative 4-s local field potential (LFP) epoch recorded from the frontal cortex in a freely behaving rat in non-rapid eye movement (NREM) sleep with the median used in the coarse-graining of the signal. B: same epoch showing the initial centroids z1 and z2 for the k-means coarse-graining of the signal (zooming in the y-axis for visualization purposes). C: first values of the binary sequence obtained with the median as the threshold from the highlighted window of data from the epoch, showing the different subsequences detected by the Lempel and Ziv algorithm separated with asterisks. D: first values of the binary sequence obtained with k-means from the highlighted window of data from the epoch, showing the different subsequences detected by the Lempel and Ziv algorithm separated with asterisks. Note that for C and D, the last characters (1111 and 11, respectively) are not new subsequences.
Fig. 2.
Fig. 2.
A: representative 8-s local field potential (LFP) traces recorded from the frontal cortex in a freely behaving rat in spontaneous waking, NREM, and rapid eye movement (REM) sleep. B: average Lempel-Ziv complexity (LZC) values, computed by a k-means coarse-graining technique, in the three behavioral states (n = 11 rats; values are expressed as means ± SE).
Fig. 3.
Fig. 3.
A: LZC values computed with different coarse-graining approaches shown for consecutive 4-s epochs during one representative NREM sleep episode. Note that occasionally the values of LZC computed with k-means approach deviate from corresponding values obtained with median technique. B: corresponding values of LFP slow-wave activity during the same NREM sleep episode. The values of sleep wave activity (SWA) are expressed as % of mean SWA value over the entire 4-min episode.
Fig. 4.
Fig. 4.
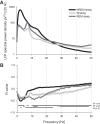
A: LFP spectral power in NREM sleep, waking and REM sleep during 12-h undisturbed baseline recording in one representative rat. B: R values of Pearson product-moment correlation between LZC values (computed with k-means approach) and corresponding power spectral values over n = 5 rats (mean values ± SE). Note that there is a strong negative correlation between LFP power in slow-frequency range and LZC values, especially apparent in NREM sleep.
Fig. 5.
Fig. 5.
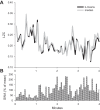
Time course of LFP slow-wave activity (spectral power between 0.5 and 4 Hz) during undisturbed 12-h baseline sleep period and during 4-h sleep deprivation (SD) followed by 8 h of recovery sleep in one individual rat. SWA for each 1-min epoch is expressed as a percentage of the mean value over the entire recording period. Note that SWA is invariably high at the beginning of spontaneous sleep and after sleep deprivation, and it shows a progressive decline during sleep. LZC values (k-means approach) show a decline during sleep, which is especially pronounced in early sleep after sleep deprivation. It is also apparent that LZC values become progressively more variable in the course of sleep deprivation (arrow), possibly indicating state instability.
Fig. 6.
Fig. 6.
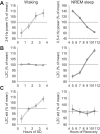
A: time course of spectral EEG power between 2 and 6 Hz (waking) and 0.5 and 4 Hz (NREM sleep) during 4 h of sleep deprivation and 8 h of recovery, respectively. Mean values (n = 5 rats). B: corresponding values of mean LZC, calculated with a k-means coarse-graining approach. C: corresponding values of SD of LZC across all of the epochs for each time interval. To emphasize the overall magnitude of change, all variables are normalized within an individual as % of their mean value over the entire recording period, prior to averaging between animals.
Fig. 7.
Fig. 7.
A: time course of spectral EEG power between 0.5 and 4 Hz during the first 2 min after NREM sleep episode onset during recovery after sleep deprivation. Mean values (n = 5 rats, all NREM sleep episodes >2 min are included). B: corresponding values of mean LZC (k-means coarse-graining approach). Note that while SWA increases progressively within an episode, the information content shows a decrease.
Fig. 8.
Fig. 8.
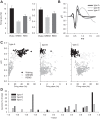
A, left: mean neuronal firing rates in waking, NREM, and REM sleep. Mean values ± SE (n = 11 rats). Right: corresponding LZC computed from spike trains based on 4-s epochs (k-means approach). B: typical representative waveforms of three types of neurons defined on the basis of the shape of extracellular action potentials. C: scatterplots of average LZCkm calculated for 4-s epochs are plotted against firing rates of three individual neurons belonging to the types shown in B. Epochs in waking, NREM, and REM sleep are plotted separately to reveal vigilance state-specific differences in both the firing rates and the LZC. D: distribution of individual neurons as a function of the r value of the correlation between their firing rates and LZC (50 well-isolated neurons in total over n = 6 rats). Note that firing activity of most neurons of type A correlates positively with LZC calculated over corresponding spike trains, while neurons of type B and C show a less clear relationship.

References

    1. Abásolo D, Hornero R, Gomez C, Garcia M, Lopez M. Analysis of EEG background activity in Alzheimer's disease patients with Lempel-Ziv complexity and central tendency measure. Med Eng Phys 28: 315–322, 2006. - PubMed
    1. Achermann P, Dijk DJ, Brunner DP, Borbely AA. A model of human sleep homeostasis based on EEG slow-wave activity: quantitative comparison of data and simulations. Brain Res Bull 31: 97–113, 1993. - PubMed
    1. Amigo JM, Szczepanski J, Wajnryb E, Sanchez-Vives MV. Estimating the entropy rate of spike trains via Lempel-Ziv complexity. Neural Comput 16: 717–736, 2004. - PubMed
    1. Arnold MM, Szczepanski J, Montejo N, Amigo JM, Wajnryb E, Sanchez-Vives MV. Information content in cortical spike trains during brain state transitions. J Sleep Res 22: 13–21, 2012. - PubMed
    1. Bjornsson CS, Oh SJ, Al-Kofahi YA, Lim YJ, Smith KL, Turner JN, De S, Roysam B, Shain W, Kim SJ. Effects of insertion conditions on tissue strain and vascular damage during neuroprosthetic device insertion. J Neural Eng 3: 196–207, 2006. - PubMed

Publication types

LinkOut - more resources