. 2015 May 1;113(9):3375-85.
doi: 10.1152/jn.00850.2014. Epub 2015 Feb 25.

Dissociable effects of local inhibitory and excitatory theta-burst stimulation on large-scale brain dynamics

Affiliations

Dissociable effects of local inhibitory and excitatory theta-burst stimulation on large-scale brain dynamics

Luca Cocchi et al. J Neurophysiol. .

Abstract

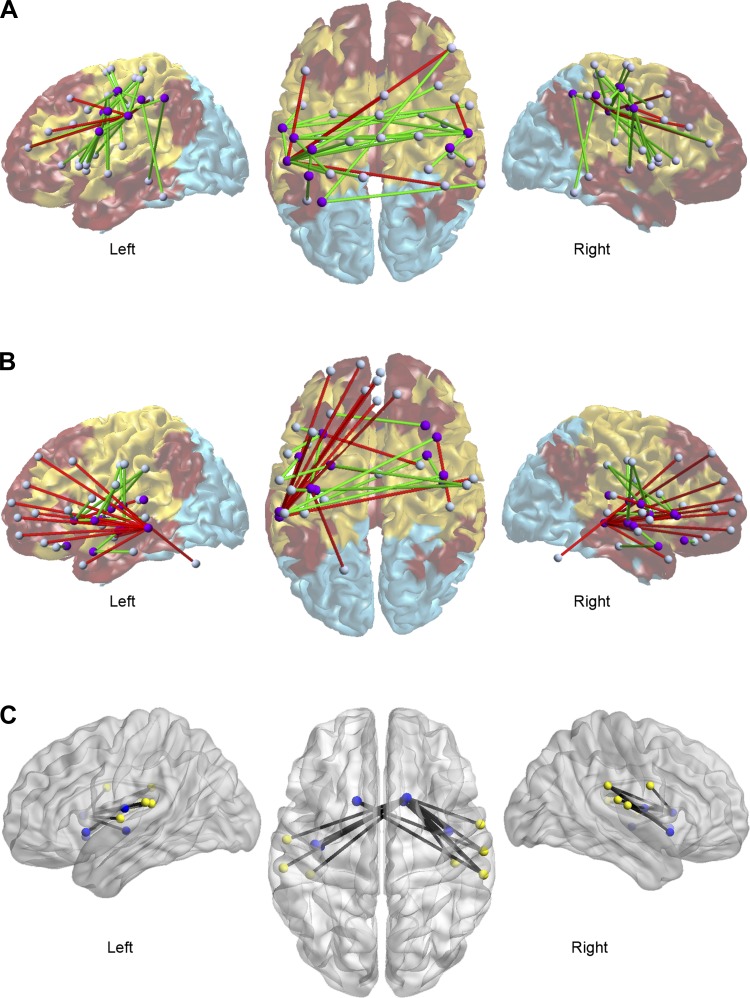
Normal brain function depends on a dynamic balance between local specialization and large-scale integration. It remains unclear, however, how local changes in functionally specialized areas can influence integrated activity across larger brain networks. By combining transcranial magnetic stimulation with resting-state functional magnetic resonance imaging, we tested for changes in large-scale integration following the application of excitatory or inhibitory stimulation on the human motor cortex. After local inhibitory stimulation, regions encompassing the sensorimotor module concurrently increased their internal integration and decreased their communication with other modules of the brain. There were no such changes in modular dynamics following excitatory stimulation of the same area of motor cortex nor were there changes in the configuration and interactions between core brain hubs after excitatory or inhibitory stimulation of the same area. These results suggest the existence of selective mechanisms that integrate local changes in neural activity, while preserving ongoing communication between brain hubs.

Keywords: TMS; brain network; connectivity; fMRI; hubs; modularity.


Figures

Fig. 1.
Fig. 1.
Nodes, modules, and rich club hubs. Nodes are network elements (e.g., brain regions, depicted as gray dots). In the context of this article, modules (in blue, brown, and yellow) are defined as clusters of brain regions (nodes) with strong internal interactions and weak external associations. Interactions between modules is supported by brain hubs (purple dots), i.e., regions that possess dense interconnections with other areas of the brain. Recent findings further suggest that communication across brain modules is disproportionately supported by a relatively small set of highly interconnected brain hubs, known as the “rich club” (van den Heuvel et al. 2011, 2012).
Fig. 2.
Fig. 2.
Experimental design for the theta-burst stimulation (TBS) and resting-state functional neuroimaging (rsfMRI) protocols. Participants undertook 2 experimental sessions comprising rsfMRI and TBS. The 2 sessions were scheduled at least 24 h apart. MEPs, motor-evoked potentials; cTBS, continuous TBS (inhibitory); iTBS, intermittent TBS (excitatory); T1, T1-weighted image.
Fig. 3.
Fig. 3.
Representative modular decomposition for participant 9.
Fig. 4.
Fig. 4.
Changes in motor cortex excitability after TBS. A: representative mean MEPs (participant 21) obtained from abductor pollicis brevis (APB), showing the effect of cTBS (red) and iTBS (green) on baseline (black) MEP amplitude. B: MEP amplitude (±SE) for each session (pre/post-TBS) and TBS type (iTBS/cTBS).
Fig. 5.
Fig. 5.
Changes in brain modular dynamics as a function of local changes in neural excitability. A: n = 23. Red: clusters showing a higher participation index (PI) at baseline. Green: clusters showing a lower within module degree (WMD) at baseline [all P < 0.05 familywise error rate (FWE) corrected]. Purple: brain activity induced by abduction of the left thumb (task > rest, P < 0.05 FDR correction at cluster level). Note that changes in PI and WMD largely overlap with the brain regions involved in abduction of the left thumb. This result suggests that connectivity changes occur mainly in areas that are functionally related to the targeted region (i.e., right motor cortex). B: red clusters represent a trend-level increase in PI following cTBS (P = 0.08, FWE). Clusters in which the WMD was decreased following cTBS are depicted in green (P = 0.04, FWE corrected). Brain regions that showed a change in both PI and WMD are shown in yellow. Purple: regions activated by abduction of the left thumb (task > rest, P < 0.05, FDR corrected at cluster level).
Fig. 6.
Fig. 6.
Changes in functional connectivity as a function of inhibitory stimulation (cTBS). Spheres represent the centroid of brain regions. A and B: dominant modular decomposition is projected on a reconstruction of the cortical surface shown in the background (note that this representation does not show the subcortical module; see Fig. 3). This decomposition was obtained by calculating the mode (across all participants and sessions) of the modular assignment for each region after alignment. A: purple regions showed a decrease in PI (i.e., between-module communication) and/or an increase in WMD (i.e., intramodular connectivity) following cTBS. Results showed increased functional connectivity (in green) within the sensorimotor module (in yellow) and decreased connectivity (in red) between this module and other modules of the brain. B: purple regions showed increased PI and/or reduced WMD following cTBS. Regions represented with purple spheres (insula, striatum, and left temporal cortex) increased their functional connectivity with the sensorimotor module and decreased their intra-modular connectivity. C depicts changes in the node assignment as a function of cTBS stimulation (inhibition). Following inhibitory stimulation of the right motor cortex pairs of nodes encompassing the sensorimotor (yellow spheres) and the subcortical (blue spheres) modules change their assignment.
Fig. 7.
Fig. 7.
Rich club dynamics and effect of TBS. A: rich club coefficient (Φ) at level of k is defined as the fraction of connections between nodes that have a degree (number of connections) equal to or higher than k out of the maximum number of connections that such nodes could share. The curve shown in blue is the Φ averaged over participants (n = 23, cTBS baseline. Similar results were found in the three additional conditions, see text). The black line represents the rich club of degree-preserving random reference graphs (mean of 1,000 random networks per participant). The red line shows the normalized rich club curve (i.e., ratio between actual rich club and surrogate rich clubs). A indicates the existence of rich clubs in the functional connectivity of the brain (i.e., red line is significantly greater than unity, as indicated by *P < 0.05 Bonferroni corrected one-tailed t-test). Note that above k > 35 the subgraph disconnected for a number of participants, suggesting that in the matrices considered, k > 35 represents the maximum degree. B: ranking of brain regions (x-axis) as a function of nodal degree (y-axis). The figure indicates the existence of a non-Gaussian distribution of brain region degrees, with few regions having a very high degree (i.e., rich club, at left. This observation was consistent across baselines and post-TBS resting-state periods). The anatomical location of brain regions showing the highest degree is presented in C (20 regions with the highest degree across sessions, in purple) and D (top 40 regions, in purple). Permutation testing showed a similar distribution of rich clubs across the four fMRI resting-state sessions. Likewise, the network-based statistic (NBS) showed that functional connectivity between rich clubs (top 20 and 40 regions) did not differ significantly between baseline and post-TBS sessions.

Similar articles

Cited by

References

    1. Alstott J, Breakspear M, Hagmann P, Cammoun L, Sporns O. Modeling the impact of lesions in the human brain. PLoS Comput Biol 5: e1000408, 2009. - PMC - PubMed
    1. Bestmann S, Baudewig J, Siebner HR, Rothwell JC, Frahm J. Functional MRI of the immediate impact of transcranial magnetic stimulation on cortical and subcortical motor circuits. Eur J Neurosci 19: 1950–1962, 2004. - PubMed
    1. Bestmann S, Feredoes E. Combined neurostimulation and neuroimaging in cognitive neuroscience: past, present, and future. Ann NY Acad Sci 1296: 11–30, 2013. - PMC - PubMed
    1. Bestmann S, Swayne O, Blankenburg F, Ruff CC, Haggard P, Weiskopf N, Josephs O, Driver J, Rothwell JC, Ward NS. Dorsal premotor cortex exerts state-dependent causal influences on activity in contralateral primary motor and dorsal premotor cortex. Cereb Cortex 18: 1281–1291, 2008. - PMC - PubMed
    1. Bestmann S, Swayne O, Blankenburg F, Ruff CC, Teo J, Weiskopf N, Driver J, Rothwell JC, Ward NS. The role of contralesional dorsal premotor cortex after stroke as studied with concurrent TMS-fMRI. J Neurosci 30: 11926–11937, 2010. - PMC - PubMed

Publication types

LinkOut - more resources