. 2015 Feb 11:6:107.
doi: 10.3389/fmicb.2015.00107. eCollection 2015.

Cell wall staining with Trypan blue enables quantitative analysis of morphological changes in yeast cells

Affiliations

Cell wall staining with Trypan blue enables quantitative analysis of morphological changes in yeast cells

Johannes Liesche et al. Front Microbiol. .

Abstract

Yeast cells are protected by a cell wall that plays an important role in the exchange of substances with the environment. The cell wall structure is dynamic and can adapt to different physiological states or environmental conditions. For the investigation of morphological changes, selective staining with fluorescent dyes is a valuable tool. Furthermore, cell wall staining is used to facilitate sub-cellular localization experiments with fluorescently-labeled proteins and the detection of yeast cells in non-fungal host tissues. Here, we report staining of Saccharomyces cerevisiae cell wall with Trypan Blue, which emits strong red fluorescence upon binding to chitin and yeast glucan; thereby, it facilitates cell wall analysis by confocal and super-resolution microscopy. The staining pattern of Trypan Blue was similar to that of the widely used UV-excitable, blue fluorescent cell wall stain Calcofluor White. Trypan Blue staining facilitated quantification of cell size and cell wall volume when utilizing the optical sectioning capacity of a confocal microscope. This enabled the quantification of morphological changes during growth under anaerobic conditions and in the presence of chemicals, demonstrating the potential of this approach for morphological investigations or screening assays.

Keywords: 3D structured illumination; Anaerobiosis; Calcofluor white; Saccharomyces cerevisiae; Trypan blue; cell volume; cell wall staining; super-resolution microscopy.


Figures

Figure 1
Figure 1
Excitation-emission scan and exemplary images of Trypan Blue-stained yeast cells (A), chitin (B), and yeast glucans (C). The scan was performed on a confocal microscope with freely selectable excitation and emission settings. Scale bars, 5 μm. The color bar represents the normalized fluorescence intensity with respect to the maximum and minimum level.
Figure 2
Figure 2
Absorption (A) and fluorescence (B, C) of cell wall components of fungi (brown lines/bars) and plants (green lines/bars) after Trypan Blue staining. (A,B) Cell wall components were dissolved at a concentration of 0.5% (w/v) in water or NaOH containing 10 μg ml−1 Trypan Blue and absorbance (A) and fluorescence (B) spectra were recorded. Inserts show spectra for Trypan Blue in aqueous solution. Fluorescence spectra were recorded with excitation at 620 nm. Control values from unstained samples were subtracted. In (C) purified powder of the indicated cell wall components was stained with 10 μg ml−1 Trypan Blue and imaged on a confocal microscope with the excitation wavelength of 620 nm. Mean fluorescence intensities of the in-focus surfaces are presented. Error bars represent standard deviation from 5 measurements. The differences between visibly stained components (gray value above 50) are all statistically significant (p < 0.01), while the difference between minimally stained components (gray value below 20) are not significant. Note that quantitative differences of fluorescence intensity values between spectrophotometric (B) and microscopic (C) analysis could be due to the different form (dissolved vs. powder) or conditions (neutral vs. acidic).
Figure 3
Figure 3
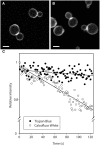
Comparison of cell wall staining with Trypan Blue (A) and Calcofluor White (B) and their respective signal bleaching (C). Stained cells were scanned repeatedly on a confocal microscope and the signal intensity was normalized to the signal at time zero. The connecting lines were obtained by linear regression. Scale bars in (A,B), 5 μm.
Figure 4
Figure 4
Trypan Blue staining enables cell and cell wall volume quantification. Image stacks of Trypan Blue stained yeast cells acquired by confocal microscopy were rendered in 3D (A). Based on the fluorescence signal, an object corresponding to the cell wall was defined, which is displayed here in 3D surface rendering mode (B). Comparison of cell volume of 35 cells (C) determined based on cell diameters in a single xy-image (1) or provided by 3D object detection based on the whole xyz-image stack (2); In (A, B), 1 unit corresponds to 0.8 μm.
Figure 5
Figure 5
Effect of growth conditions on cell size and wall volume analyzed by Trypan Blue staining. S. cerevisiae cells grown overnight under anaerobic conditions or in medium containing high concentrations (0.1 mg ml−1) of Calcofluor White (CFW) or Trypan Blue (TB) were stained with TB and analyzed by confocal fluorescence microscopy. Based on image 3D-renderning (cf. Figure 4), cell volume, wall volume, and cell/wall volume ratio were determined for the indicated number (n) of cells and expressed as percentage relative to untreated, aerobically grown cells (control cell volume, 123.6 μm3; control wall volume, 66 μm3; control wall/cell volume ratio, 0.53) (A). Representative images of TB-stained cells grown under control (B), anaerobic conditions (C), with Calcofluor White (D) or Trypan Blue (E) are shown. Cell wall ingrowth caused by Calcofluor White (D) are marked by arrows. Dead cells were excluded from the analysis based on an intracellular staining by TB. These cells accounted for about 4% of CFW-incubated cells and about 0.5% in all other cultures. Statistical significance is indicated in (A): p < 0.001 (+++), p < 0.01 (++), p < 0.05 (+). Scale bars, 5 μm.
Figure 6
Figure 6
Super-resolution images of Trypan Blue stained yeast cells. Cells were grown aerobically overnight in the absence (A) and presence (B) of 0.1 mg ml−1 Calcofluor White, then stained with Trypan Blue and visualized by the super-resolution microscopy technique 3D structured illumination. Scale bars, 1 μm.

References

    1. Aguilar-Uscanga B., Francois J. M. (2003). A study of the yeast cell wall composition and structure in response to growth conditions and mode of cultivation. Lett. Appl. Microbiol. 37, 268–274. 10.1046/j.1472-765X.2003.01394.x - DOI - PubMed
    1. Andrews P. D., Stark M. J. (2000). Type 1 protein phosphatase is required for maintenance of cell wall integrity, morphogenesis and cell cycle progression in Saccharomyces cerevisiae. J. Cell Sci. 113, 507–520. - PubMed
    1. Avelar-Freitas B. A., Almeida V. G., Pinto M., Mourão A., Massensini A. R., Marins-Filho O. A., et al. . (2014). Trypan blue exclusion assay by flow cytometry. Braz. J. Med. Biol. Res. 47, 307–315. 10.1590/1414-431X20143437 - DOI - PMC - PubMed
    1. Bhadauria V., Miraz P., Kennedy R., Banniza S., Wei Y. (2010). Dual trypan-aniline blue fluorescence staining methods for studying fungus-plant interactions. Biotech. Histochem. 85, 99–105. 10.3109/10520290903132196 - DOI - PubMed
    1. Bowman S. M., Free S. J. (2006). The structure and synthesis of the fungal cell wall. Bioessays 28, 799–808. 10.1002/bies.20441 - DOI - PubMed

LinkOut - more resources