. 2014;199(5-6):393-404.
doi: 10.1159/000371342. Epub 2015 Feb 18.

Hypoxia induces an undifferentiated phenotype of oral keratinocytes in vitro

Affiliations

Hypoxia induces an undifferentiated phenotype of oral keratinocytes in vitro

Hiroko Kato et al. Cells Tissues Organs. 2014.

Abstract

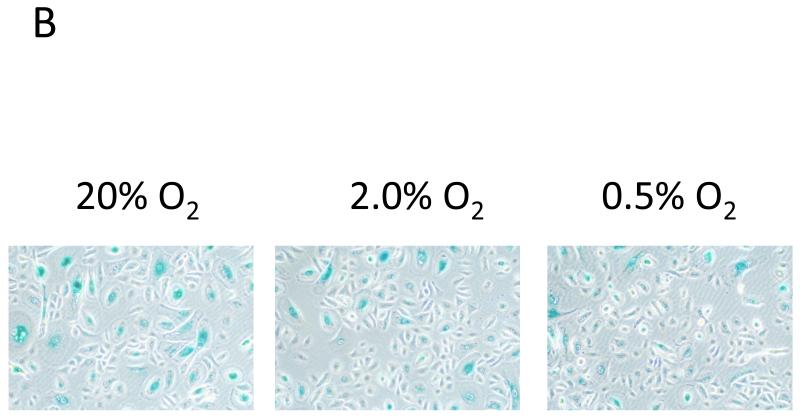
The aim of this study was to determine the effects of hypoxia on the proliferating potential and phenotype of primary human oral keratinocytes cultured at ambient oxygen tension (20%) or at different levels of hypoxia (2 and 0.5% O2). The effects of oxygen tensions on cellular metabolic activity, cell proliferation, clonogenicity and proliferation heterogeneity were measured. Cell cycle profiles were analyzed by a fluorescent-activated cell sorter, and p21(WAF1/CIP1) expression in the G0/G1 phase was also concomitantly quantitated. The expression levels of cell cycle regulatory proteins were examined by immunoblotting, and the cellular senescence was assessed by senescence-associated β-galactosidase staining. Basal and suprabasal keratinocyte phenotypes were determined by the expression levels of 14-3-3σ, p75(NTR) and α6 integrin. Despite having a lower metabolism, the proliferation rate and clonogenic potential were remarkably enhanced in hypoxic cells. The significantly higher percentage of cells in the G0/G1 phase under hypoxia and the expression patterns of cell cycle regulatory proteins in hypoxic cells were indicative of a state of cell cycle arrest in hypoxia. Furthermore, a decrease in the expression of p21(WAF1/CIP1) and p16(INK4A) and fewer β-galactosidase-positive cells suggested a quiescent phenotype rather than a senescent one in hypoxic cells. Compared with normoxic cells, the differential expression patterns of keratinocyte phenotypic markers suggest that hypoxic cells that generate minimal reactive oxygen species, suppress the mammalian target of rapamycin activity and express hypoxia-inducible factor-1α favor a basal cell phenotype. Thus, regardless of the predisposition to the state of cell cycle arrest, hypoxic conditions can maintain oral keratinocytes in vitro in an undifferentiated and quiescent state.


Figures

Figure 1
Figure 1
(A) Effects of three different oxygen tensions (20%, 2.0% and 0.5%) on the cellular metabolic activity of human oral keratinocytes up to 96 hours. The metabolic activity was assessed using a Cell-Counting kit-8 (N=10). Assays were performed in triplicate. Asterisks represent statistically significant differences determined by Steel-Dwass test (*p< 0.05). (B) Effects of three different oxygen tensions on the proliferation rate of human oral keratinocytes up to 6 days. Viable cells were stained with trypan blue and counted (N=8). Assays were performed in duplicate. Asterisks represent statistically significant differences determined by Tukey’s post-hoc test (*p< 0.05, **p< 0.01). (C) Effects of three different oxygen tensions on the colony forming efficiency of human oral keratinocytes. Cells were stained with crystal violet and the number of colonies were microscopically and macroscopically counted (N=9) as stated in the Materials and Methods. An asterisk represents statistically significant difference determined by Tukey’s post-hoc test (*p< 0.05). The statistical differences between normoxic and hypoxic cells were marginal except the microscopic quantification between 2.0% and 20%O2 culture condition. (D) Representative images of clonogenic assay. After cells were cultured for 4 days at 20, 2.0 and 0.5% O2, colonies were fixed and stained with Crystal Violet as aforementioned. (E) CFSE dye profile of cells cultured in normoxic and hypoxic conditions for 48 h. Their patterns were diverse among different oxygen tensions as well as individuals. The data shown are representative of six separate experiments. (a) 20% O2, (b) 2% O2, (c) 0.5% O2, (d) Overlay, (e) FITC standard beads. The values shown in (a), (b), (c) are the percentage of cells that could be experienced round of divisions of 2, 1 and 0 times according to the protocol of Chadli’s work.
Figure 1
Figure 1
(A) Effects of three different oxygen tensions (20%, 2.0% and 0.5%) on the cellular metabolic activity of human oral keratinocytes up to 96 hours. The metabolic activity was assessed using a Cell-Counting kit-8 (N=10). Assays were performed in triplicate. Asterisks represent statistically significant differences determined by Steel-Dwass test (*p< 0.05). (B) Effects of three different oxygen tensions on the proliferation rate of human oral keratinocytes up to 6 days. Viable cells were stained with trypan blue and counted (N=8). Assays were performed in duplicate. Asterisks represent statistically significant differences determined by Tukey’s post-hoc test (*p< 0.05, **p< 0.01). (C) Effects of three different oxygen tensions on the colony forming efficiency of human oral keratinocytes. Cells were stained with crystal violet and the number of colonies were microscopically and macroscopically counted (N=9) as stated in the Materials and Methods. An asterisk represents statistically significant difference determined by Tukey’s post-hoc test (*p< 0.05). The statistical differences between normoxic and hypoxic cells were marginal except the microscopic quantification between 2.0% and 20%O2 culture condition. (D) Representative images of clonogenic assay. After cells were cultured for 4 days at 20, 2.0 and 0.5% O2, colonies were fixed and stained with Crystal Violet as aforementioned. (E) CFSE dye profile of cells cultured in normoxic and hypoxic conditions for 48 h. Their patterns were diverse among different oxygen tensions as well as individuals. The data shown are representative of six separate experiments. (a) 20% O2, (b) 2% O2, (c) 0.5% O2, (d) Overlay, (e) FITC standard beads. The values shown in (a), (b), (c) are the percentage of cells that could be experienced round of divisions of 2, 1 and 0 times according to the protocol of Chadli’s work.
Figure 2
Figure 2
(A) Distribution of human oral keratinocytes cultured at three different oxygen tensions (20%, 2.0% and 0.5%) in various phases of the cell cycle. Bar chart showing the cell distribution (%) in G0/G1, S, and G2/M phases as determined by ModFit software. Data are mean percent ±standard deviations (SD) of 11 independent experiments. Asterisks represent statistically significant differences determined by Tukey’s post-hoc test (*p< 0.05, **p< 0.01) . (B) Representative dot plot images of flow cytometric analysis of DNA content and p21 WAF1/CIP1 expression. (C) Ratio of p21 WAF1/CIP1 positive cells within G0/G1 phase of normoxic and hypoxic oral keratinocytes (N = 12). Statistically significant differences were present between normoxic and hypoxic cells determined by Tukey’s post-hoc test (*p< 0.05).
Figure 2
Figure 2
(A) Distribution of human oral keratinocytes cultured at three different oxygen tensions (20%, 2.0% and 0.5%) in various phases of the cell cycle. Bar chart showing the cell distribution (%) in G0/G1, S, and G2/M phases as determined by ModFit software. Data are mean percent ±standard deviations (SD) of 11 independent experiments. Asterisks represent statistically significant differences determined by Tukey’s post-hoc test (*p< 0.05, **p< 0.01) . (B) Representative dot plot images of flow cytometric analysis of DNA content and p21 WAF1/CIP1 expression. (C) Ratio of p21 WAF1/CIP1 positive cells within G0/G1 phase of normoxic and hypoxic oral keratinocytes (N = 12). Statistically significant differences were present between normoxic and hypoxic cells determined by Tukey’s post-hoc test (*p< 0.05).
Figure 3
Figure 3
(A) Expression of cell cycle regulatory proteins. Western immunoblotting detection of cyclin D1, phospho-Rb, Rb, p16INK4 and Rb2/p130 in oral keratinocytes cultured in three different oxygen tensions for 48 hours. The results shown are representative of 4 separate experiments. β-actin is shown as a loading control. (B) Rb phosphorylation of cells cultured in normoxic and hypoxic conditions was quantified based on the densitometric analysis (N = 3). Statistically significant difference of the ratio of phosphorylated to total Rb protein was present between normoxic and hypoxic cells determined by Tukey’s post-hoc test (*p< 0.05).
Figure 3
Figure 3
(A) Expression of cell cycle regulatory proteins. Western immunoblotting detection of cyclin D1, phospho-Rb, Rb, p16INK4 and Rb2/p130 in oral keratinocytes cultured in three different oxygen tensions for 48 hours. The results shown are representative of 4 separate experiments. β-actin is shown as a loading control. (B) Rb phosphorylation of cells cultured in normoxic and hypoxic conditions was quantified based on the densitometric analysis (N = 3). Statistically significant difference of the ratio of phosphorylated to total Rb protein was present between normoxic and hypoxic cells determined by Tukey’s post-hoc test (*p< 0.05).
Figure 4
Figure 4
(A) Ratio of positive cells stained with SA-β-galactosidase at pH 6 under normoxia and hypoxia (N = 6). There was statistically significant difference between 2.0% and 20%O2 culture condition although the difference between 0.5% and 20% O2 pressure was marginal, which were determined by Tukey’s post-hoc test (*p< 0.05). (B) Representative images of SA-β-galactosidase staining after cells were cultured for 72 hours at 20, 2.0 and 0.5% O2.
Figure 4
Figure 4
(A) Ratio of positive cells stained with SA-β-galactosidase at pH 6 under normoxia and hypoxia (N = 6). There was statistically significant difference between 2.0% and 20%O2 culture condition although the difference between 0.5% and 20% O2 pressure was marginal, which were determined by Tukey’s post-hoc test (*p< 0.05). (B) Representative images of SA-β-galactosidase staining after cells were cultured for 72 hours at 20, 2.0 and 0.5% O2.
Figure 5
Figure 5
(A) Expression of basal and suprabasal keratinocyte phenotypic markers. Western immunoblotting detection of 14-3-3σ and p75NTR in oral keratinocytes cultured in three different oxygen tensions for 48 hours. The results shown are representative of 4 separate experiments. β-actin is shown as a loading control. (B) Ratio of α6 integrin positive cells under normoxia and hypoxia detected by flow cytometric analysis (N = 9). The α6 integrin expression ratio significantly increased at the oxygen tension of 0.5% compared with 20% O2 pressure while there was no statistical difference between 2.0% and 20% O2 culture condition determined by Tukey’s post-hoc test (*p< 0.05). (C) Total ROS production levels under normoxia and hypoxia measured by a microplate fluorometer (N = 10). Cells cultured at 20% O2 pressure generated total ROS and its level was close to a positive control cells incubated with 200μM of pyocyanin. In contrast, total ROS was barely detected in cells cultured in hypoxic conditions. There was a remarkable statistical difference between normoxic and hypoxic culture conditions determined by Tukey’s post-hoc test (*p< 0.001). (D) Expression of down-stream substrates of mTOR signaling pathway. Western immunoblotting detection of p-S6K, S6K, p-S6 and S6 in oral keratinocytes cultured in three different oxygen tensions for 48 hours. The results shown are representative of 3 separate experiments.
Figure 5
Figure 5
(A) Expression of basal and suprabasal keratinocyte phenotypic markers. Western immunoblotting detection of 14-3-3σ and p75NTR in oral keratinocytes cultured in three different oxygen tensions for 48 hours. The results shown are representative of 4 separate experiments. β-actin is shown as a loading control. (B) Ratio of α6 integrin positive cells under normoxia and hypoxia detected by flow cytometric analysis (N = 9). The α6 integrin expression ratio significantly increased at the oxygen tension of 0.5% compared with 20% O2 pressure while there was no statistical difference between 2.0% and 20% O2 culture condition determined by Tukey’s post-hoc test (*p< 0.05). (C) Total ROS production levels under normoxia and hypoxia measured by a microplate fluorometer (N = 10). Cells cultured at 20% O2 pressure generated total ROS and its level was close to a positive control cells incubated with 200μM of pyocyanin. In contrast, total ROS was barely detected in cells cultured in hypoxic conditions. There was a remarkable statistical difference between normoxic and hypoxic culture conditions determined by Tukey’s post-hoc test (*p< 0.001). (D) Expression of down-stream substrates of mTOR signaling pathway. Western immunoblotting detection of p-S6K, S6K, p-S6 and S6 in oral keratinocytes cultured in three different oxygen tensions for 48 hours. The results shown are representative of 3 separate experiments.
Figure 6
Figure 6
(A) Immunofluorescence staining showed only a few cells expressed HIF-1α in their nuclei in normoxic condition. In contrast, there were a large number cells expressed HIF-1α in their nuclei under 2.0% and 0.5% O2 tensions. Original magnification ×200, scale bar=100 μm (B) Higher expression of HIF-1α was detected from the whole cell lysates cultured in hypoxic conditions. β-actin is shown as a loading control.
Figure 6
Figure 6
(A) Immunofluorescence staining showed only a few cells expressed HIF-1α in their nuclei in normoxic condition. In contrast, there were a large number cells expressed HIF-1α in their nuclei under 2.0% and 0.5% O2 tensions. Original magnification ×200, scale bar=100 μm (B) Higher expression of HIF-1α was detected from the whole cell lysates cultured in hypoxic conditions. β-actin is shown as a loading control.

Similar articles

Cited by

References

    1. Bath C, Yang S, Muttuvelu D, Fink T, Emmersen J, Vorum H, Hjortdal J, Zachar V. Hypoxia is a key regulator of limbal epithelial stem cell growth and differentiation. Stem Cell Res. 2013;10:349–360. - PubMed
    1. Baris OR, Klose A, Kloepper JE, Weiland D, Neuhaus JF, Schauen M, et al. The mitochondrial electron transport chain is dispensable for proliferation and differentiation of epidermal progenitor cells. Stem Cells. 2011;29:1459–1468. - PubMed
    1. Blagosklonny MV. Hypoxia, MTOR and autophagy: converging on senescence or quiescence. Autophagy. 2013;9:260–262. - PMC - PubMed
    1. Buravkova LB, Rylova YV, Andreeva ER, Kulikov AV, Pogodina MV, Zhivotovsky B, et al. Low ATP level is sufficient to maintain the uncommitted state of multipotent mesenchymal stem cells. Biochim Biophys Acta. 2013;1830:4418–4425. - PubMed
    1. Carreau A, El Hafny-Rahbi B, Matejuk A, Grillon C, Kieda C. Why is the partial oxygen pressure of human tissues a crucial parameter? Small molecules and hypoxia. J Cell Mol Med. 2011;15:1239–1253. - PMC - PubMed

Publication types

Substances