. 2015:1282:261-9.
doi: 10.1007/978-1-4939-2438-7_22.

Studying the dynamics of coronavirus replicative structures

Affiliations

Studying the dynamics of coronavirus replicative structures

Marne C Hagemeijer et al. Methods Mol Biol. 2015.

Abstract

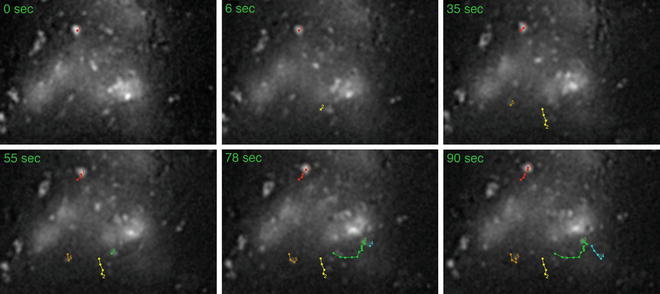
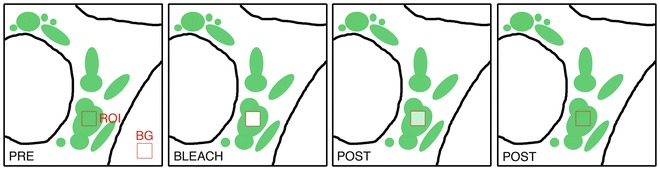
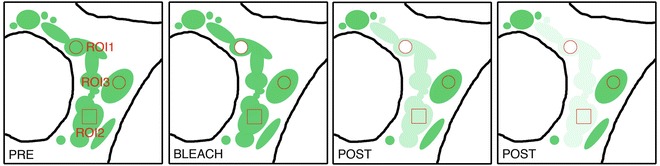
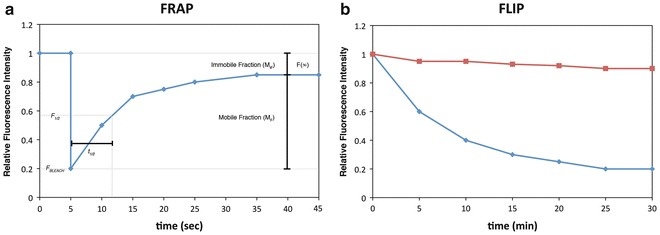
Coronaviruses (CoVs) generate specialized membrane compartments, which consist of double membrane vesicles connected to convoluted membranes, the so-called replicative structures, where viral RNA synthesis takes place. These sites harbor the CoV replication-transcription complexes (RTCs): multi-protein complexes consisting of 16 nonstructural proteins (nsps), the CoV nucleocapsid protein (N) and presumably host proteins. To successfully establish functional membrane-bound RTCs all of the viral and host constituents need to be correctly spatiotemporally organized during viral infection. Few studies, however, have investigated the dynamic processes involved in the formation and functioning of the (subunits of) CoV RTCs and the replicative structures in living cells. In this chapter we describe several protocols to perform time-lapse imaging of CoV-infected cells and to study the kinetics of (subunits of) the CoV replicative structures. The approaches described are not limited to CoV-infected cells; they can also be applied to other virus-infected or non-infected cells.


Figures

Fig. 1
Fig. 1
Time-lapse imaging of MHV-nsp2GFP in LR7 cells. LR7 cells were infected with MHV-nsp2GFP [MHV expressing an nsp2-GFP fusion protein [21]] and at 6 h p.i. a time-lapse experiment was performed as described in Subheadings 3.1 and 3.2. Nsp2-GFP-positive foci were manually tracked over time using MtrackJ [22] and examples of the displacement of these structures have been indicated by the different numbered and colored lines
Fig. 2
Fig. 2
Schematic overview of a FRAP experiment. A specific region of interest (ROI) targeting (part of) the FP-tagged replicative structure(s) is irreversibly photobleached and the recovery of fluorescence into the bleached area is monitored over time. In this example, the FP-tagged proteins are mobile as recovery of the fluorescence in the bleached area is observed [as has been previously observed for the MHV N protein [14]]. In the absence of recovery, the FP-tagged proteins are immobile [as has been observed for example for the MHV nsp2 protein [21]]. The green structures in the cell are a schematic representation of the replicative structures. BG background ROI for qualitative FRAP analysis
Fig. 3
Fig. 3
Schematic overview of a FLIP experiment. The replicative structure(s) is repeatedly photobleached in ROI1 (circle) and the loss of fluorescence is monitored in ROI2 (squared box) or ROI3 (circle) over time. In this example the fluorescence of the FP-tagged structure is lost over time in ROI2, but not ROI3, indicating continuity between the membrane compartments of ROI1 and ROI2, but not between those of ROI1 and ROI3. Another cell in the field of view may be used to monitor/correct for photobleaching during the FLIP assay
Fig. 4
Fig. 4
Fluorescence graphs of typical FRAP and FLIP experiments. Two examples of typical fluorescence graphs when performing FRAP (left graph) or FLIP (right graph) experiments. (a) F∞: the plateau level reached at the end of the experiment, M f: mobile fraction of the FP-tagged replicative structures, M IF: the immobile fraction of the FP-tagged proteins present at the replicative structures, t 1/2: halftime of the recovery. (b) The decrease of fluorescence (diamonds/blue line) indicates that continuity between membrane compartments exists. If no or hardly any decrease is observed, the different membrane compartments are not continuous (for example ROI3 in Fig. 3). The squares/red line represents the loss of fluorescence of a control cell that is not photobleached and serves as a control that the observed loss of fluorescence is due to migration of FP-tagged proteins into the bleached area and not due to general photobleaching of the cell itself

Similar articles

Cited by

References

    1. Deming DJ, Graham RL, Denison MR, et al. Processing of open reading frame 1a replicase proteins nsp7 to nsp10 in murine hepatitis virus strain A59 replication. J Virol. 2007;81:10280–10291. doi: 10.1128/JVI.00017-07. - DOI - PMC - PubMed
    1. Goldsmith CS, Tatti KM, Ksiazek TG, et al. Ultrastructural characterization of SARS coronavirus. Emerg Infect Dis. 2004;10:320–326. doi: 10.3201/eid1002.030913. - DOI - PMC - PubMed
    1. Graham RL, Sims AC, Brockway SM, et al. The nsp2 replicase proteins of murine hepatitis virus and severe acute respiratory syndrome coronavirus are dispensable for viral replication. J Virol. 2005;79:13399–13411. doi: 10.1128/JVI.79.21.13399-13411.2005. - DOI - PMC - PubMed
    1. Knoops K, Kikkert M, Worm SH, et al. SARS-coronavirus replication is supported by a reticulovesicular network of modified endoplasmic reticulum. PLoS Biol. 2008;6:e226. doi: 10.1371/journal.pbio.0060226. - DOI - PMC - PubMed
    1. Oostra M, te Lintelo EG, Deijs M, et al. Localization and membrane topology of coronavirus nonstructural protein 4: involvement of the early secretory pathway in replication. J Virol. 2007;81:12323–12336. doi: 10.1128/JVI.01506-07. - DOI - PMC - PubMed

LinkOut - more resources