. 2015 Apr 10;290(15):9571-87.
doi: 10.1074/jbc.M114.617837. Epub 2015 Feb 26.

Activated α2-macroglobulin binding to human prostate cancer cells triggers insulin-like responses

Affiliations

Activated α2-macroglobulin binding to human prostate cancer cells triggers insulin-like responses

Uma Kant Misra et al. J Biol Chem. .

Abstract

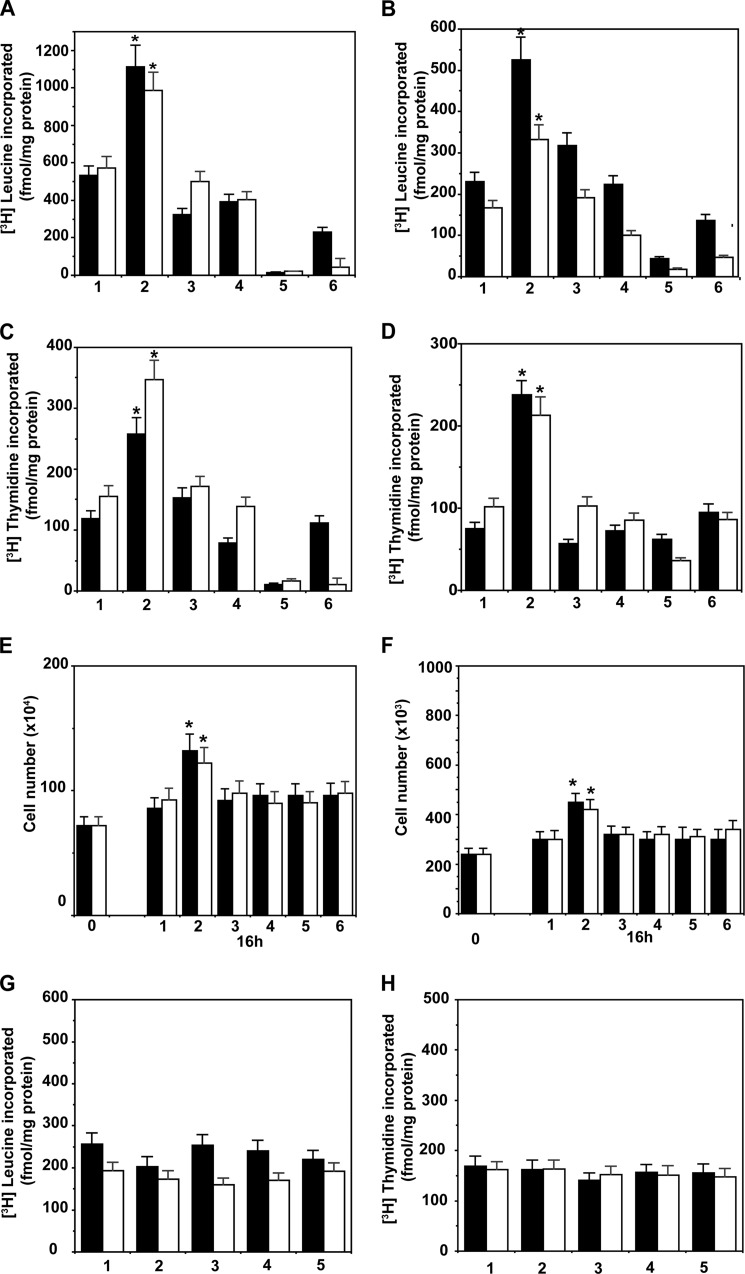
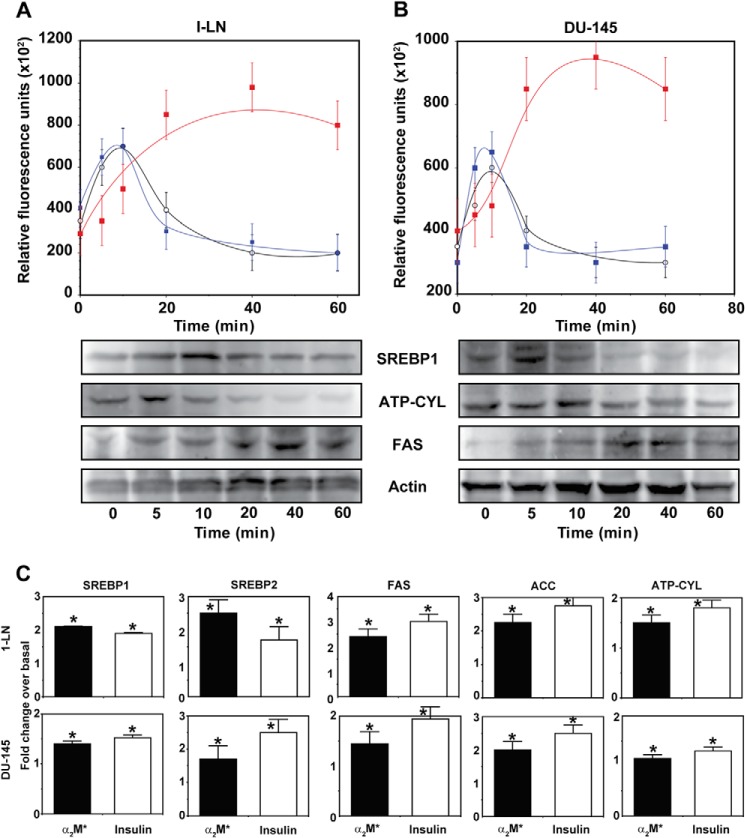
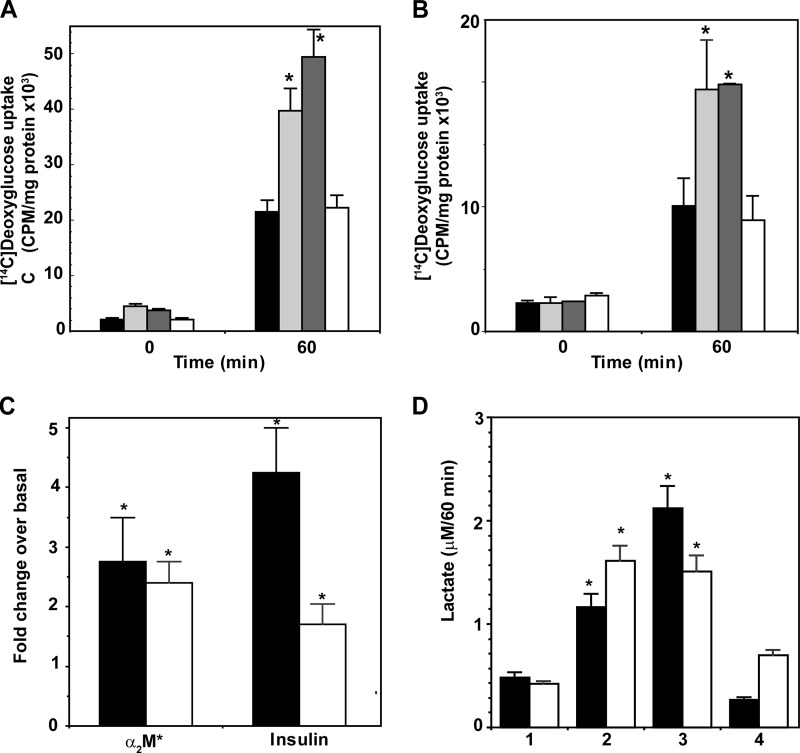
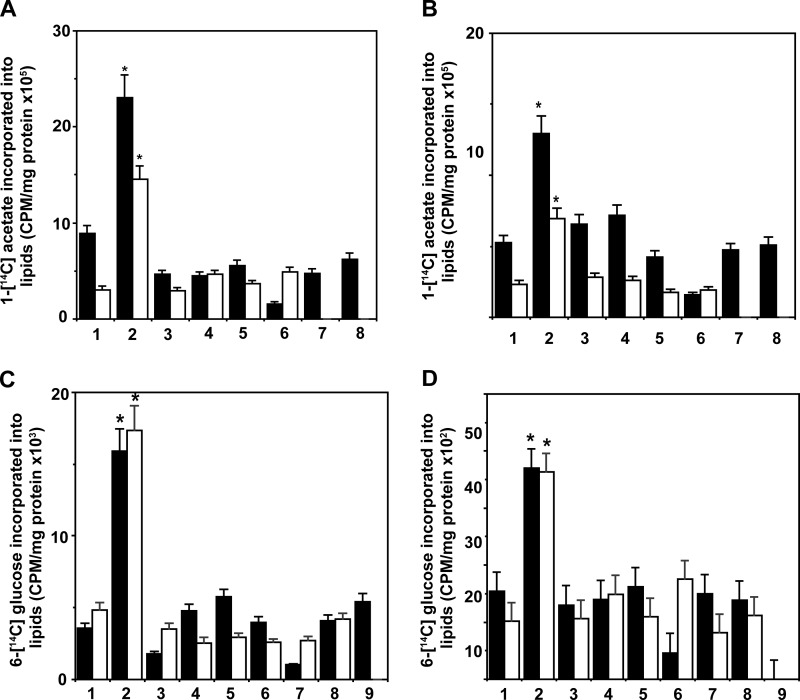
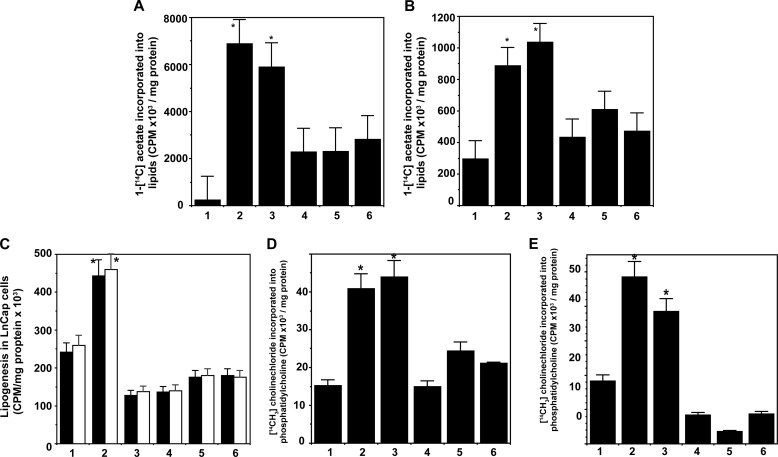
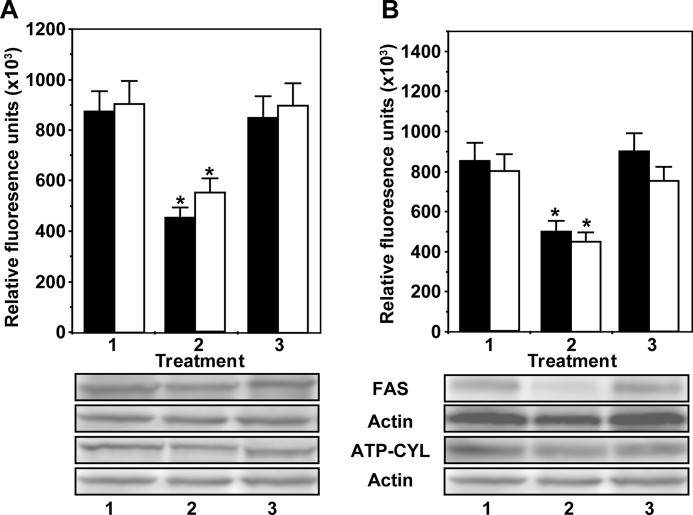
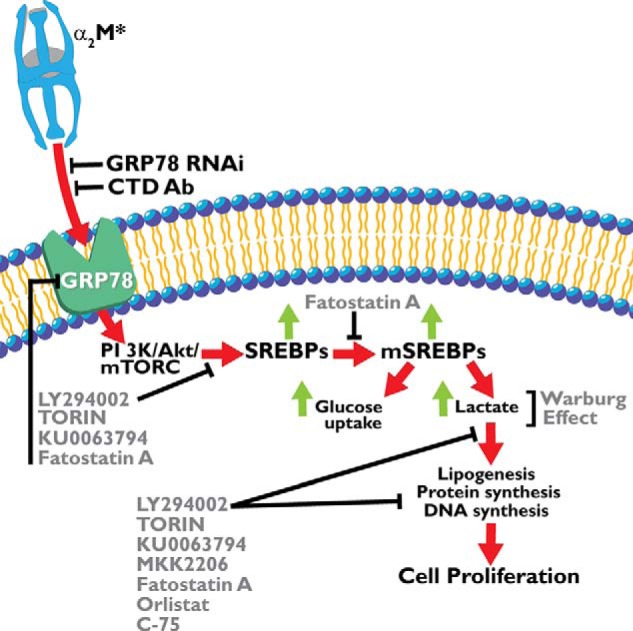
Ligation of cell surface GRP78 by activated α2-macroglobulin (α2M*) promotes cell proliferation and suppresses apoptosis. α2M*-treated human prostate cancer cells exhibit a 2-3-fold increase in glucose uptake and lactate secretion, an effect similar to insulin treatment. In both α2M* and insulin-treated cells, the mRNA levels of SREBP1-c, SREBP2, fatty-acid synthase, acetyl-CoA carboxylase, ATP citrate lyase, and Glut-1 were significantly increased together with their protein levels, except for SREBP2. Pretreatment of cells with α2M* antagonist antibody directed against the carboxyl-terminal domain of GRP78 blocks these α2M*-mediated effects, and silencing GRP78 expression by RNAi inhibits up-regulation of ATP citrate lyase and fatty-acid synthase. α2M* induces a 2-3-fold increase in lipogenesis as determined by 6-[(14)C]glucose or 1-[(14)C]acetate incorporation into free cholesterol, cholesterol esters, triglycerides, free fatty acids, and phosphatidylcholine, which is blocked by inhibitors of fatty-acid synthase, PI 3-kinase, mTORC, or an antibody against the carboxyl-terminal domain of GRP78. We also assessed the incorporation of [(14)CH3]choline into phosphatidylcholine and observed similar effects. Lipogenesis is significantly affected by pretreatment of prostate cancer cells with fatostatin A, which blocks sterol regulatory element-binding protein proteolytic cleavage and activation. This study demonstrates that α2M* functions as a growth factor, leading to proliferation of prostate cancer cells by promoting insulin-like responses. An antibody against the carboxyl-terminal domain of GRP78 may have important applications in prostate cancer therapy.

Keywords: Aerobic Glycolysis; Antibody Directed Against the Carboxyl-terminal Domain of GRP78; Cell Surface GRP78; Glycolysis; Lipogenesis; Prostate Cancer; Signal Transduction; Warburg Effect; α-2-Macroglobulin and Metabolic Regulation.


Figures

FIGURE 1.
FIGURE 1.
Inhibition of α2M* (black bars) and insulin (white bars)-induced protein synthesis in 1-LN (A) and DU-145 (B) prostate cancer cells is shown. DNA synthesis for 1-LN (C) and DU-145 (D) cells, respectively, is shown. Cell growth studies are shown in E and F, respectively. The bars in A–D are as follows: 1, buffer; 2, α2M* or insulin; 3, MKK-2206 then α2M* or insulin; 4, KU0063794 then α2M* or insulin; 5, C-75 then α2M* or insulin; and 6, orlistat then α2M* or insulin. Protein synthesis data are the mean ± S.E. from three experiments. The effects of inhibitors on cell growth of 1-LN (E) and DU-145 (F) cells stimulated with α2M* (black bars) or insulin (white bars) are shown. The bars at 16 h in E and F are as above. The effects of inhibitors alone on protein synthesis (G) and DNA synthesis (H) in 1-LN (black bars) and DU-145 (white bars) prostate cancer cells are shown. The bars in both G and H are as follows: 1, buffer; 2, MKK-2206; 3, KU0063794; 4, C-75; and 5, orlistat. The values in G and H are the mean ± S.E. from three experiments. Values significantly different at 5% level from buffer or inhibitor-treated cells are marked with an asterisk.
FIGURE 2.
FIGURE 2.
Effect of time of incubation of 1-LN (A) and DU-145 cells (B) with α2M* (100 pm) on the expression of SREBP1 (○), ATP citrate lyase (black bars), and fatty-acid synthase (▩) is shown. The values are expressed in arbitrary units ( × 102) and are the mean ± S.E. from three to four independent experiments. The abbreviations used in the figure are as follows: ATP-CYL, ATP citrate lyase; FAS, fatty-acid synthase; ACC, CoA carboxylase; and SREBP, sterol regulatory binding protein 1. Real time mRNA PCR of SREBP1, SREBP2, ATP citrate lyase, acetyl-CoA carboxylase, and fatty-acid synthase in 1-LN and DU-145 cells stimulated with α2M or insulin (C). The mRNA levels from three to four experiments are expressed as fold change over the mRNA levels of buffer-treated cells. The mRNA levels are expressed relative to β-actin. Values significantly different at 5% level from buffer-treated cells are marked with an asterisk.
FIGURE 3.
FIGURE 3.
1-[14C]Deoxyglucose uptake by 1-LN (A) and DU-145 (B) cells is shown. 1-[14C]Deoxyglucose uptake in cells treated with buffer (black bars), α2M* (light gray bars); insulin (dark gray bars), or anti-CTD antibody then α2M* for 60 min (white bars) is shown. 1-[14C]Deoxyglucose uptake is expressed as cpm/mg/supernatant and is the mean ± S.E. from four experiments. Values significantly different at the 5% level at the 60-min period from buffer and anti-CTD are indicated by an asterisk. C, Glut-mRNA levels determined by real time PCR in 1-LN (black bars) and DU-145 (white bars) cells treated with α2M* or insulin. Glut-1 mRNA levels are expressed as fold change over mRNA levels in buffer-treated cells and are significantly different (asterisk) at 5% levels from buffer-treated cells and are denoted by an asterisk. D, lactate secretion in1-LN (black bars) and DU-145 (white bars) cells treated with the following: 1, buffer; 2, α2M*; 3, insulin; or 4, anti-CTD then α2M*. Lactate secretion is expressed as micromolars/60 min and is the mean ± S.E. from three experiments. Values significantly different at the 5% level from buffer and anti-CTD-treated cells are indicated by an asterisk.
FIGURE 4.
FIGURE 4.
Induction of lipogenesis by α2M* or insulin in prostate cancer cells. A, 1-LN cells, inhibition of α2M* (black bars) or insulin (white bars)-induced lipogenesis from 1-[14C]acetate in 1-LN prostate cancer cells by fatty-acid synthase inhibitors. The bars in the figure are as follows: 1, buffer; 2, α2M* or insulin; 3, LY294002 (20 μm/25 min) and then α2M* or insulin; 4, rapamycin (100 nm/20 min) and then α2M or insulin; 5, torin and then α2M* or insulin; 6, C-75 and then α2M or insulin; 7, KU0063794 and then α2M* or insulin; and 8, anti-CTD and then α2M or insulin. B, inhibition of α2M* (black bars) or insulin (white bars)-induced lipogenesis from 1-[14C]acetate in DU-145 cells by the fatty-acid synthase inhibitors in DU-145 cells. The bars in the figure are same as in A. The values are the mean ± S.E. from three experiments in both cases. Values significantly different at the 5% level in A and B from buffer and inhibitor-treated cells are denoted by an asterisk. C, inhibition of α2M* (black bars) or insulin (white bars)-induced lipogenesis from 6-[14C]glucose in 1-LN prostate cancer cells pretreated with fatty-acid synthase inhibitors. The bars in the figure are as follows: 1, buffer; 2, α2M* or insulin; 3, LY294002 and then α2M* or insulin; 4, rapamycin and then α2M* or insulin; 5, torin and then α2M* or insulin; 6, C-75 and then α2M or insulin; 7, KU0063794 and then α2M* or insulin; 8, MKK2206 and then α2M* or insulin; 9, anti-CTD and then α2M*. D, suppression of α2M* (black bars) or insulin (white bars)-induced lipogenesis from 6-[14C]glucose in DU-145 cells pretreated with fatty-acid synthase inhibitors as in C. The results are the mean ± S.E. from three experiments. Values significantly different at the 5% levels in from buffer-treated and inhibitor-treated cells are denoted by an asterisk. Treatment of 1-LN or DU-145 cells with inhibitors alone did not effect 1-[14C]acetate or 6-[14C]glucose measurements (data not shown).
FIGURE 5.
FIGURE 5.
α2M (black bars) and insulin (white bars) up-regulate the incorporation of 1-[14C]acetate into a nonsaponifiable lipid fraction (cholesterogenesis) in 1-LN cells (A) and in DU-145 cells (B). The bars in A and B are as follows: 1, buffer; 2, α2M* and then α2M* or insulin; 3, LY294002 and then α2M* or insulin; 4, rapamycin and then α2M or insulin; 5, torin and then α2M* or insulin; 6, C-75 and then α2M* or insulin; 7, KU0063794 and then α2M* or insulin; 8, anti-CTD and then α2M*. The incorporation of 1-[14C]acetate into nonsaponifiable fractions (cholesterogenesis) in both A and B is expressed as cpm/mg cell protein and is the mean ± S.E. from three experiments. Values significantly different at the 5% level from buffer and inhibitor-treated cells in both A and B are denoted by an asterisk. Up-regulation of 1-[14C]acetate incorporation into saponifiable fractions (fatty acids) by α2M* (black bars) or insulin (white bars) in 1-LN cells (C) and DU-145 (D) cells. The bars in C and D are as follows: 1, buffer; 2, α2M* or insulin; 3, LY294002 and then α2M* or insulin; 4, rapamycin and then α2M* or insulin; 5, torin and then α2M* or insulin; 6, C-75 and then α2M* or insulin; 7, KU0063794 and then α2M* or insulin; 8, anti-CTD and then α2M*. The incorporation of 1-[14C]acetate into saponifiable fraction (fatty acids) in C and D is expressed as cpm/mg cell protein and is the mean ± S.E. from three experiments. Values significantly different from buffer and inhibitor-treated cells in both C and D are denoted by an asterisk.
FIGURE 6.
FIGURE 6.
Thin layer chromatography of 1-[lsqb]14C]acetate-labeled lipid extracts of 1-LN and DU-145 cells treated with α2M* or insulin. A, representative thin layer chromatogram of cell lipids of 1-LN cells. A similar pattern was obtained with DU-145 cells (data not shown). B, fatty-acid synthase inhibitors inhibit α2M-induced increased incorporation of 1-[14C]acetate into esterified cholesterol (black) triglycerides (red), fatty acids (green), cholesterol (blue), and phosphatidylcholine (white) fractions of 1-LN cells. The bars are in the figure are as follows: 1, buffer; 2, α2M*; 3, LY294002 and then α2M*; 4, rapamycin and then α2M*; 5, torin and then α2M*; 6, C-75 and then α2M*; 7, KU0063794 and then α2M*; 8, anti-CTD and then α2M*. C, inhibition of insulin-induced increase 1-[14C]acetate incorporation into cellular lipids fraction of 1-LN cells by prior treatment of cells with fatty-acid synthase inhibitors. Bars in the figure are as in B except treatment with anti-CTD or KU0063794, which was not performed. Fatty-acid synthase inhibitors suppress α2M* (D) and insulin-induced increase (E) of [14C]acetate incorporation into cellular lipids of DU-145 cells. The bars in figure in D are the same as in B, and the bars in figure in E are the same as in C. The incorporation of 1-[14C]acetate into various lipid fractions in B–E is expressed as cpm/mg protein and is mean ± S.E. from three experiments. Values significantly different at 5% levels from buffer and inhibitor-treated cells in B–E are denoted by an asterisk.
FIGURE 7.
FIGURE 7.
Inhibition of proteolytic cleavage of SREBP1 by fatostatin A on α2M*-dependent metabolic regulation. Fatostatin abrogates α2M* or insulin-induced protein and DNA synthesis in1-LN (black bars) and DU-145 (white bars) cells (A and B). The bars are as follows: 1, buffer; 2, α2M*; 3, insulin; 4, fatostatin A (20 μm/2 h) and then α2M*; 5, fatostatin A and then insulin; and 6, fatostatin. Similar results were obtained with LnCAP cells (C and D). The bars are as above and the mean ± S.E. from three experiments. Values significantly different at the 5% levels from buffer and inhibitor-treated cells are denoted by an asterisk. A representative immunoblot of three experiments showing cleaved SREBP1 (kDa ∼151) into mature cleaved SREBP1 (kDa ∼74) in α2M* or insulin-treated cells and its inhibition by fatostatin A (E and F). The lanes in immunoblots are as follows: lane 1, α2M*; lane 2, insulin; lane 3, fatostatin A then α2M*; lane 4, fatostatin A then insulin; or lane 5, buffer.
FIGURE 8.
FIGURE 8.
Fatostatin A suppresses α2M* or insulin-induced increased lipogenesis from 1-[14C]acetate in 1-LN (A) and DU-145 (B) and LnCap (C) prostate cancer cells. The bars in figure in A and B are as follows: 1, buffer; 2, α2M*; 3, insulin; 4, fatostatin A and then α2M*; 5, fatostatin A and then insulin; and 6, anti-CTD and then α2M*. The bars in figure in C are as follows: 1, buffer; 2, α2M*; 3, insulin; 4, torin and then α2M* or insulin; 5, C-75 and then α2M* or insulin; 6, fatostatin A and then α2M* or insulin; 7, fatostatin A. 1-[14C]Acetate incorporation in A–C is expressed as cpm/mg cell protein and is mean ± S.E. from three experiments. Values significantly different at 5% levels from buffer and inhibitor-treated cells in A–C are denoted by an asterisk. Inhibition of SREBP1 cleavage by fatostatin A suppresses α2M* or insulin-induced increased de novo phosphatidylcholine synthesis from [14CH3]choline in 1-LN (D) and DU-145 (E). The bars in both D and E are as follows: 1, buffer; 2, α2M*; 3, insulin; 4, fatostatin A and then α2M*; 5, fatostatin A and then insulin; 6, anti-CTD and then α2M*. The synthesis of phosphatidylcholine in both panels is expressed as cpm/mg cell protein and is the mean ± S.E. from three experiments. Values significantly different at 5% levels from buffer and fatostatin A-treated cells in both panels are denoted by an asterisk.
FIGURE 9.
FIGURE 9.
Down-regulation of cell surface GRP78 by RNAi suppresses α2M*-induced expression of ATP citrate lyase (black bars) and fatty-acid synthase (white bars) in 1-LN (A) and DU-145 (B) prostate cancer cells. The panels in both immunoblots are as follows: 1, Lipofectamine + α2M*; 2, GRP78 dsRNA (100 nm/48 h)/Lipofectamine and then α2M*; and 3, scrambled dsRNA (100 nm/48 h)/Lipofectamine and then α2M*. The changes in expression of target proteins are in arbitrary units and are the mean ± S.E. from four experiments. Values significantly different at the 5% level for GRP78 dsRNA-transfected cells compared with the controls are denoted by an asterisk. A representative immunoblot of fatty-acid synthase and ATP citrate lyase in 1-LN (A) and DU-145 (B) cells from four experiments is shown below the respective bar diagrams.
FIGURE 10.
FIGURE 10.
Schematic representation of cellular events involved in α2M*-induced aerobic glycolysis in prostate cancer cells. The abbreviations are as in the cleaved or active form, except for mSREBPS1, which indicates the mature form.

Similar articles

Cited by

References

    1. Jemal A., Thomas A., Murray T., Thun M. (2002) Cancer statistics. CA Cancer J. Clin. 52, 23–47 - PubMed
    1. Abate-Shen C., Shen M. M. (2000) Molecular genetics of prostate cancer. Genes Dev. 14, 2410–2434 - PubMed
    1. Montano X., Djamgoz M. B. (2004) Epidermal growth factor, neurotrophins and the metastatic cascade in prostate cancer. FEBS Lett. 571, 1–8 - PubMed
    1. Schlessinger J. (2000) Cell signaling by receptor tyrosine kinases. Cell 103, 211–225 - PubMed
    1. Manning B. D., Cantley L. C. (2007) AKT/PKB signaling: navigating downstream. Cell 129, 1261–1274 - PMC - PubMed

MeSH terms