. 2015 Apr 15;75(8):1635-44.
doi: 10.1158/0008-5472.CAN-14-3016. Epub 2015 Feb 26.

IL10 and PD-1 Cooperate to Limit the Activity of Tumor-Specific CD8+ T Cells

Affiliations

IL10 and PD-1 Cooperate to Limit the Activity of Tumor-Specific CD8+ T Cells

Zhaojun Sun et al. Cancer Res. .

Abstract

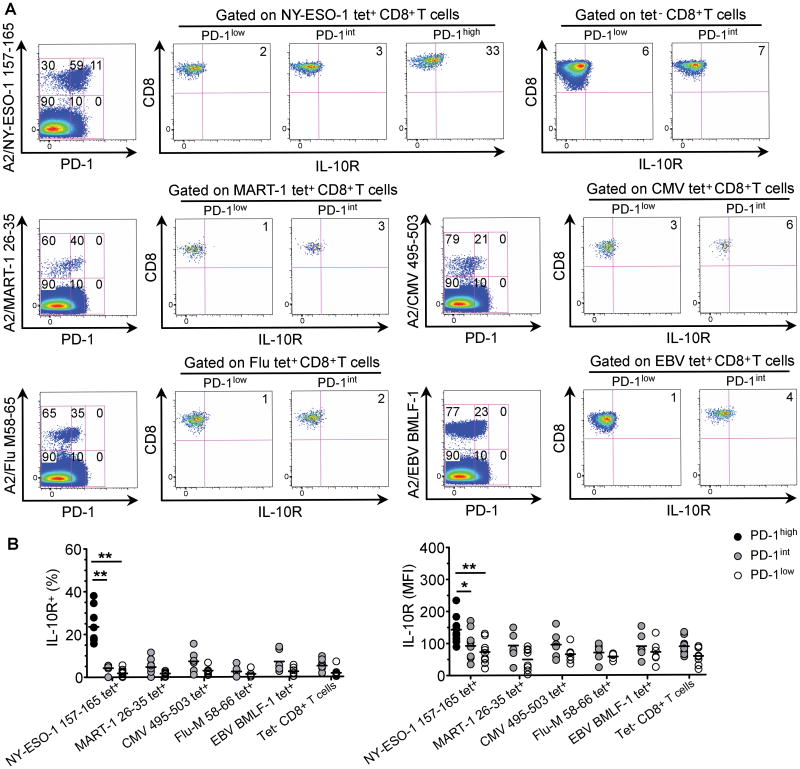
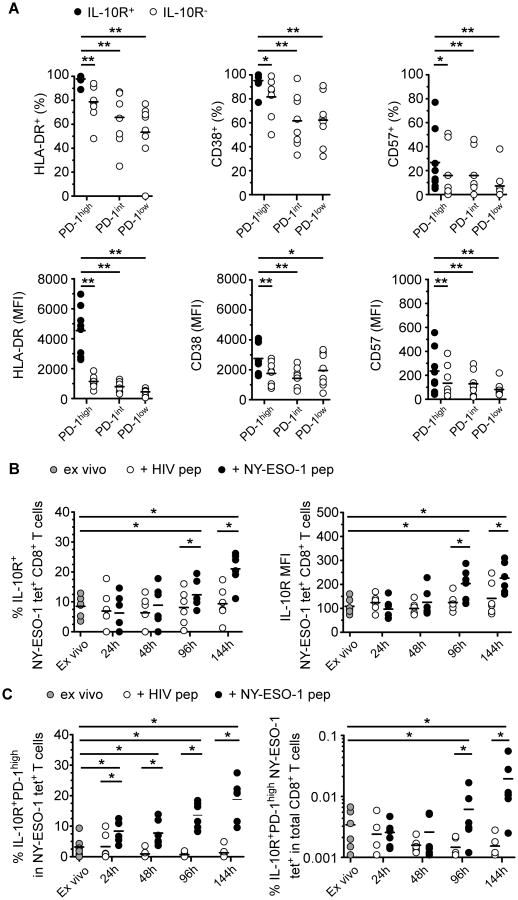
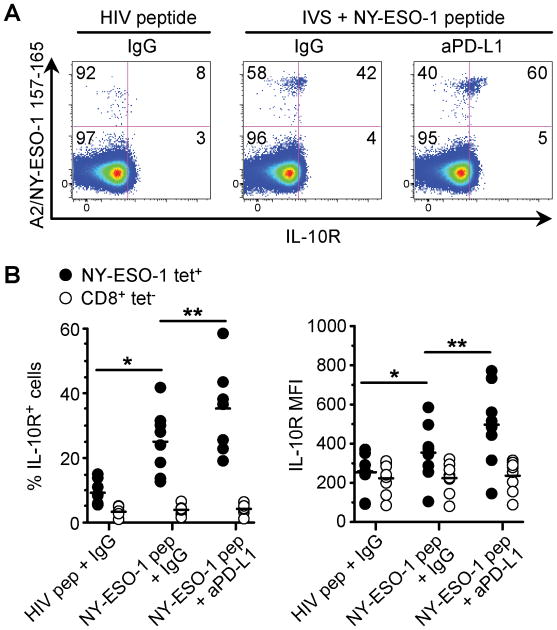
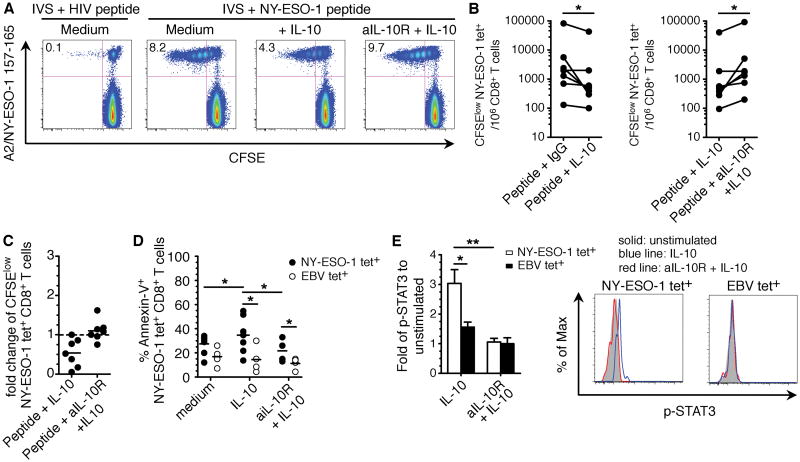
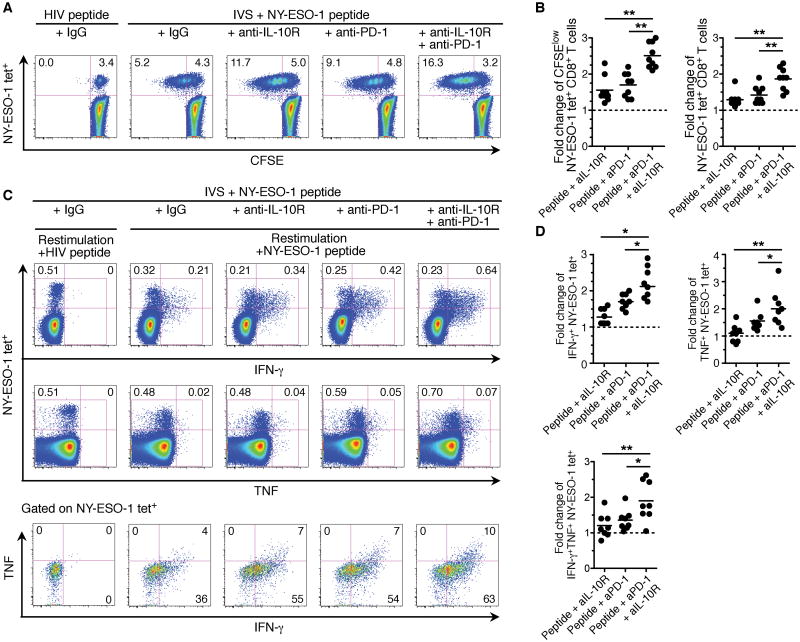
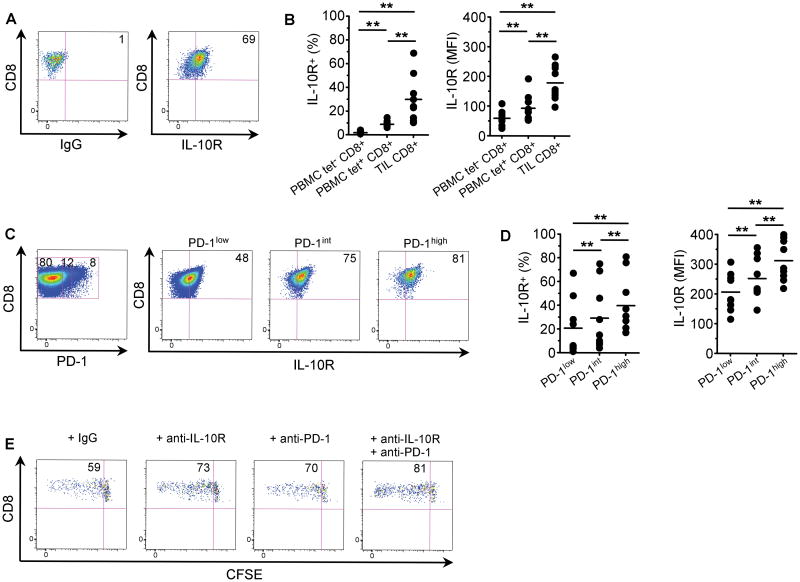
Immune checkpoint inhibitors show great promise as therapy for advanced melanoma, heightening the need to determine the most effective use of these agents. Here, we report that programmed death-1(high) (PD-1(high)) tumor antigen (TA)-specific CD8(+) T cells present at periphery and at tumor sites in patients with advanced melanoma upregulate IL10 receptor (IL10R) expression. Multiple subsets of peripheral blood mononucleocytes from melanoma patients produce IL10, which acts directly on IL10R(+) TA-specific CD8(+) T cells to limit their proliferation and survival. PD-1 blockade augments expression of IL10R by TA-specific CD8(+) T cells, thereby increasing their sensitivity to the immunosuppressive effects of endogenous IL10. Conversely, IL10 blockade strengthened the effects of PD-1 blockade in expanding TA-specific CD8(+) T cells and reinforcing their function. Collectively, our findings offer a rationale to block both IL10 and PD-1 to strengthen the counteraction of T-cell immunosuppression and to enhance the activity of TA-specific CD8(+) T cell in advanced melanoma patients.


Conflict of interest statement

The authors disclose no potential conflicts of interest.

Figures

Figure 1
Figure 1
IL-10R is upregulated by PD-1high NY-ESO-1–specific CD8+ T cells. A and B, Dot plots from one representative patient (A) and summary data for all nine patients with advanced melanoma (B) showing ex vivo IL-10R expression by PD-1high and/or, PD-1int and PD-1low subsets of A2/NY-ESO-1 157–165, A2/MART-1 26–35, A2/CMV 495-503, A2/Flu-M 58–66, A2/EBV BMLF1 280–288 tet+ and total tet- CD8+ T cells. * P < 0.05 and ** P < 0.01. Horizontal bars depict the mean percentage or MFI of IL-10R expression. Data shown are representative of two independent experiments performed in duplicate.
Figure 2
Figure 2
NY-ESO-1–specific CD8+ T cells upregulate IL-10R and PD-1 upon TCR activation. A, Pooled data from melanoma patients (n = 8) showing the percentage (%) (left) and MFI (right) of ex vivo expression of HLA-DR, CD38 and CD57 on IL-10R+ and IL-10R- subsets in PD-1high and on IL-10R- subsets in PD-1int and PD-1low NY-ESO-1–specific CD8+ T cells. B, IL-10R expression on NY-ESO-1 tet+ CD8+ T cells assessed ex vivo and after indicated hours following in vitro stimulation with cognate peptide (NY-ESO-1 peptide) or irrelevant peptide (HIV peptide), (n=6). C, The percentage of IL-10R+PD-1high in NY-ESO-1 tet+ CD8+ T cells (left) and in total CD8+ T cells (right) tested in B. Data shown are representative of at least two independent experiments. * P < 0.05 and ** P < 0.01. Horizontal bars depict the mean percentage or MFI of cells that express the corresponding molecule.
Figure 3
Figure 3
NY-ESO-1–specific CD8+ T cells upregulate IL-10R expression upon PD-1 pathway blockade. A and B, Dot plots from one representative patient (A) and summary data for eight patients with melanoma showing the percentage (%) (B, left) and MFI (B, right) of IL-10R expression by total A2/NY-ESO-1 157–165 tet+ and total tet- CD8+ T cells after culture. PBMCs of melanoma patients were stimulated with NY-ESO-1 peptide in the presence of blocking mAbs against PD-L1 or isotype control antibodies, before tetramer and IL-10R labeling. * P < 0.05 and ** P < 0.01. Horizontal bars depict the mean percentage or MFI of IL-10R expression. Data shown are representative of two independent experiments performed in duplicate.
Figure 4
Figure 4
IL-10 inhibits NY-ESO-1–specific CD8+ T cell proliferation after prolonged antigen stimulation. A and B, Dot plots from a representative patient (A) and summary for seven patients with melanoma (B) showing the variation in the frequencies of CFSElo NY-ESO-1–specific CD8+ T cells for 106 CD8+ T cells. CFSE-labeled PBMCs from patients were incubated with NY-ESO-1 157–165 peptide and rIL-10 or blocking mAb against IL-10R (aIL-10R) plus rhIL-10 or an isotype control antibody (IgG) before the evaluation of A2/NY-ESO-1 157–165 tet+ CD8+ T cell proliferation by flow cytometry. C, Fold change of the frequencies of CFSElo NY-ESO-1–specific CD8+ T cells after IVS with cognate peptide and rhIL-10 or aIL-10R plus rhIL-10. The ratios of the percentages of CFSElo NY-ESO-1–specific CD8+ T cells in the presence of rhIL-10 or in the presence of aIL-10R plus rhIL-10 and IgG isotype control are shown. D, Pooled data showing the percentage of Annexin-V+ determined by flow cytometry for A2/NY-ESO-1 157–165 tet+ CD8+ T cells (n = 7) or A2/EBV BMLF1 280–288 tet+ CD8+ T cells (n = 4), which were incubated for 6 d with NY-ESO-1 157–165 peptide or BMLF1 280–288 peptide and rhIL-10 or aIL-10R plus rhIL-10 or IgG. E, p-STAT3 expression measured by flow cytometry in A2/NY-ESO-1 157–165 tet+ CD8+ T cells or A2/EBV BMLF1 280–288 tet+ CD8+ T cells from melanoma patients (n = 5) treated or not with aIL-10R and then stimulated or not with IL-10.
Figure 5
Figure 5
IL-10R blockade adds to PD-1 blockade to increase the expansion and functions of NY-ESO-1–specific CD8+ T cells. A, Representative flow cytometry analysis from one melanoma patient showing the percentages of CFSElo NY-ESO-1–specific CD8+ T cells among total CD8+ T cells in CFSE-based proliferation assay (n = 9). B, Fold change of the frequencies of CFSElo (left) and total (right) NY-ESO-1–specific CD8+ T cells after IVS with cognate peptide and aPD-1 and/or aIL-10R. The ratio of the percentages of CFSElo and total NY-ESO-1–specific CD8+ T cells in the presence of indicated antibody treatment and isotype control antibody is shown. C, Representative flow cytometry analysis from one melanoma patient showing the percentages of IFN-γ- and TNF-producing NY0-ESO-1–specific CD8+ T cells among total CD8+ T cells (upper) and the percentages of IFN-γ+TNF+ NY-ESO-1–specific CD8+ T cells among NY-ESO-1–specific CD8+ T cells (lower). PBMCs were incubated with NY-ESO-1 157–165 peptide or with HIVpol 476–484 peptide and aPD-1 and/or aIL-10R or an isotype control antibody (IgG), prior to evaluating intracellular cytokine production of NY-ESO-1–specific CD8+ T cells upon stimulation with cognate peptide, (n=8). D, Fold change of the frequencies of IFN-γ +, TNF+ and IFN-γ+TNF+ NY-ESO-1–specific CD8+ T cells after IVS with cognate peptide and aPD-1 and/or aIL-10R. The ratio of the frequency of cytokine-producing NY-ESO-1–specific T cells from melanoma patients in the presence of indicated antibody treatment and isotype control antibody is shown. Data shown are representative of two independent experiments performed in duplicate.
Figure 6
Figure 6
IL-10R is highly upregulated by PD-1+ CD8+ TILs. A and B, Dot plots from one representative patient (A) and summary data (B) showing ex vivo IL-10R expression by NY-ESO-1 tet- CD8+ T cells from PBMCs of healthy donors (n=9) and by CD8+ TILs from melanoma patients (n=9). C and D, Dot plots from one representative patient (C) and summary data for all nine patients with advanced melanoma (D) showing ex vivo IL-10R expression by PD-1high, PD-1int and PD-1low subsets of CD8+ TILs. E, Flow cytometry analysis from one melanoma patient showing the percentages of CFSElo CD8+ TILs among total CD8+ TILs. CFSE-labeled CD8+ TILs were incubated with anti-CD3-pulsed non-T cell fraction of one melanoma tumor single cell suspension in the presence of anti-IL-10R and/or anti-PD-1 or IgG control antibodies before the evaluation of the CD8+ T cells proliferation by flow cytometry. * P < 0.05 and ** P < 0.01. Horizontal bars depict the mean percentage or MFI of IL-10R expression by NY-ESO-1 tet- CD8+ T cells or CD8+ TILs. Data shown are representative of two independent experiments performed in duplicate.

References

    1. Boon T, Coulie PG, Van den Eynde BJ, van der Bruggen P. Human T cell responses against melanoma. Annual review of immunology. 2006;24:175–208. - PubMed
    1. Wherry EJ, Ahmed R. Memory CD8 T-cell differentiation during viral infection. Journal of virology. 2004;78:5535–45. - PMC - PubMed
    1. Wherry EJ. T cell exhaustion. Nature immunology. 2011;12:492–9. - PubMed
    1. Barber DL, Wherry EJ, Masopust D, Zhu B, Allison JP, Sharpe AH, et al. Restoring function in exhausted CD8 T cells during chronic viral infection. Nature. 2006;439:682–7. - PubMed
    1. Blackburn SD, Shin H, Haining WN, Zou T, Workman CJ, Polley A, et al. Coregulation of CD8+ T cell exhaustion by multiple inhibitory receptors during chronic viral infection. Nature immunology. 2009;10:29–37. - PMC - PubMed

Publication types

MeSH terms