. 2015 Feb 27:5:8629.
doi: 10.1038/srep08629.

The multi-targeted tyrosine kinase inhibitor vandetanib plays a bifunctional role in non-small cell lung cancer cells

Affiliations

The multi-targeted tyrosine kinase inhibitor vandetanib plays a bifunctional role in non-small cell lung cancer cells

Yan Zhou et al. Sci Rep. .

Abstract

Vandetanib, a multikinase inhibitor, is a target of drug treatments for non-small cell lung cancer (NSCLC). However, phase II and III clinical trials have not conclusively demonstrated the curative effects of vandetanib for NSCLC, and the reasons for this are unknown. In the present study, we use the NSCLC cell line Calu-6 as a model to determine the cellular and biological effects of vandetanib. Our results demonstrate that vandetanib impairs Calu-6 cell migration and invasion. We find that vandetanib can directly inhibit RET activity, which influences the Rho-JNK pathway. Overexpression of a constitutively active Rho GTPase antagonizes the inhibitory effects of vandetanib on Calu-6 cells invasion and JNK pathway activation. In addition, vandetanib induces autophagy by increasing the level of reactive oxygen species (ROS) in Calu-6 cells, and blockade of autophagy or ROS effectively enhances the cell death effect of vandetanib. In this study, we find vandetanib is of a double effect in some NSCLC cells, presenting new possibilities for the pharmacological treatment of NSCLC and introducing a novel role for vandetanib in treatment options.


Figures

Figure 1
Figure 1. Vandetanib alters the mesenchymal morphology of Calu-6 cells.
(A) Calu-6 cells were incubated for 24 h in the presence or absence of vandetanib (1 μM), gefitinib (1 μM), lapatinib (1 μM) or crizotinib (1 μM). Cell viability was measured using the CCK8 assay. (B) Calu-6 cells were treated as described above, and their morphology was examined with a light microscope. Scale bar: 50 μm.
Figure 2
Figure 2. Vandetanib affects the actin cytoskeleton and cell junctions of Calu-6 cells.
(A) Calu-6 cells were treated with or without 1 μM vandetanib for 24 h. F-actin and vimentin staining was performed as described in the Methods section and imaged using a confocal laser scanning microscope. Scale bar: 50 μm. (B) Calu-6 cells were treated as described above. Immunofluorescent staining of β-catenin was observed using a confocal microscope. Scale bar: 50 μm. (C) Calu-6 cells were treated as described above. Immunofluorescent staining of claudin1 and ZO1 was observed with a confocal microscope. Scale bar: 50 μm. (D) Cell lysates were prepared 24 h after the addition of vandetanib (1 μM, 2 μM, 3 μM and 4 μM) to Calu-6 cells. Untreated cells grown for 24 h were employed as a control. Western blot analysis was performed using specific antibodies against β-catenin, ZO1 and claudin1. β-actin was employed as the loading control. The protein levels of claudin1 were quantified relative to the loading control using Alphaview SA software. The presented blots were derived from multiple gels. The membranes were cut based on molecular weights and probed with the antibody of interest.
Figure 3
Figure 3. Vandetanib inhibits the cell migration and invasion of Calu-6 cells.
(A) Calu-6 cells were treated with or without various concentrations of vandetanib, and their migration ability was subsequently determined using a wound-healing assay. Black solid lines denote the margins of the wound. Scale bar: 100 μm. (B) The number of cells that migrated to close the wounded area during 0 h, 3 h, 9 h, 18 h and 24 h were counted. The data are presented as the mean ± S.D. based on three independent experiments. **P < 0.01. (C) A 2-chamber assay was used to evaluate the invasion ability of Calu-6 cells. Scale bar: 100 μm. (D) The number of cells that travelled from the upper transwell chamber to the lower chamber was counted. The data are presented as the mean ± S.D. based on three independent experiments. **P < 0.01.
Figure 4
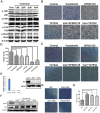
Figure 4. The Rho GTPase-JNK pathway is required for the inhibitory effects of vandetanib on Calu-6 cells invasion.
(A) Calu-6 cells were treated with the various concentrations of vandetanib for 24 h and then analyzed by western blotting with antibodies against the phosphorylated or total forms of JNK, ERK, p38, and Stat3. β-actin was used as the loading control. (B) Calu-6 cells were incubated for 24 h in the presence or absence of vandetanib (1 or 2 μM), SP600125 (50 or 100 μM), and Y27632 (5 or 10 μM). The morphology of the Calu-6 cells was examined under a light microscope. Scale bar: 50 μm. (C) Calu-6 cells were treated as described above. Cell invasion was captured with a light microscope. Scale bar: 50 μm. (D) The number of invasive cells that travelled from the upper transwell chamber to the lower chamber was counted. The data are presented as the mean ± S.D. based on three independent experiments. *P < 0.05, **P < 0.01, ***P < 0.001. (E) Left: The mRNA expression levels of RET in different NSCLC cell lines were detected using q-PCR. Right: The protein expression levels of RET in different NSCLC cell lines were detected via western blotting. GAPDH was used as the loading control. (F) Calu-6 cells were treated as in Figure 4A and then analyzed by western blotting with antibodies against the phosphorylated or total form of RET. GAPDH was used as the loading control. (G) Calu-6 cells were transfected with plasmids carrying GFP, RhoA Q63L, RAC1 Q61L and CDC42 Q61L for 24 h, and the cells were then treated with 1 μM vandetanib for another 24 h. A 2-chamber assay was used to evaluate the invasive ability of the cells. The invasive cells were examined with a light microscope. Scale bar: 50 μm. (H) The number of invasive cells was counted. The data are presented as the mean ± S.D. based on three independent experiments. **P < 0.01, ***P < 0.001. Van: vandetanib. All of the presented western blots were derived from multiple gels. The membranes were cut based on molecular weights and probed with the antibody of interest.
Figure 5
Figure 5. Autophagy was induced by vandetanib and inhibited by 3-MA and CQ in Calu-6 cells.
(A) Calu-6 cells were transfected with the GFP-LC3 plasmid and then treated with 1 μM vandetanib for 24 h. GFP-LC3 puncta were examined via confocal microscopy. Scale bar: 50 μm. (B) The number of GFP-LC3 puncta in each Calu-6 cell was counted, and at least 100 cells were included for each group. The data are presented as the mean ± S.D. based on three independent experiments. **P < 0.01. (C) Calu-6 cells were treated with various concentrations of vandetanib for 24 h, and their whole-cell lysates were then subjected to western blotting with an anti-LC3 antibody. β-actin served as a loading control. (D) Calu-6 cells were treated with 1 μM vandetanib in the presence or absence of 5 mM 3-MA or 10 μM CQ for 24 h and then subjected to western blot analysis with an anti-LC3 antibody. The protein levels of LC3-II were quantified in relation to the loading control using Alphaview SA software. Van: vandetanib. The presented blots were derived from multiple gels. The membrane were cut based on the molecular weight and probed with the antibody of interest.
Figure 6
Figure 6. Autophagy induced by vandetanib is suppressed by inhibition of ROS in Calu-6 cells.
(A) Cell lysates of Calu-6 cells were prepared following treatment with various concentrations of vandetanib for 24 h. Western blot analysis was performed to examin the expression of p-AKT and p-mTOR. β-actin was used as the loading control. (B) Calu-6 cells treated with or without various concentrations of vandetanib for 24 h were stained with 10 μM DCFH-DA and analyzed via FACS (left panel). The histogram represents the effect of vandetanib on ROS production (right panel). The data are presented as the mean ± S.D. based on three independent experiments. *P < 0.05. (C) Calu-6 cells were treated with 1 μM vandetanib in the presence or absence of NAC for 24 h and then stained with DCFH-DA and analyzed via FACS (left panel). The histogram shows the percentage of ROS+ cells induced by vandetanib (right panel). The data are presented as the mean ± S.D. based on three independent experiments. **P < 0.01. (D) Fluorescent microscopy images of GFP-LC3 in Calu-6 cells treated with 1 μM vandetanib in the presence or absence of NAC for 24 h. Scale bar: 50 μm. (E) The number of GFP-LC3 puncta in each Calu-6 cell was counted, and at least 100 cells were included for each group. The data are presented as the mean ± S.D. based on three independent experiments. **P < 0.01. (F) Calu-6 cells were treated with 1 μM vandetanib in the presence or absence of the ROS scavenger NAC (10 mM) and then subjected to western blot analysis to examine the expression of LC3. The protein levels of LC3-II were quantified in relation to the loading control β-actin using Alphaview SA software. (G) Cells were treated as described above and then subjected to western blotting to examine the expression of p-AKT and AKT. β-actin served as a loading control. The presented blots shown were derived from multiple gels. The membranes were cut based on molecular weights and probed with the antibody of interest.
Figure 7
Figure 7. Inhibition of autophagy and ROS enhanced the chemosensitivity of vandetanib in Calu-6 cells.
(A) and (B) Calu-6 cells were treated with 1 μM vandetanib in the presence or absence of 3-MA, CQ or NAC for 24 h. Cell viability was measured using the CCK8 assay. The data are presented as the mean ± S.D. based on three independent experiments. **P < 0.01.
Figure 8
Figure 8. Molecular model of the effects of vandetanib on Calu-6 cells.
Under normal culture conditions, growth factors (GF) interact with RTK, which then activates the Rho GTPase-JNK signaling pathway required for cell migration and invasion (left). Following vandetanib treatment, the fibroblastic morphology of Calu-6 cells is altered to a ‘cobble-stone'-like phenotype, and the capacity for cell migration and invasion is suppressed through inhibition of Rho GTPase-JNK signaling. Vandetanib also increases ROS levels, inducing autophagy and leading to chemoresistance. NAC or autophagy inhibitors enhance the chemosensitivity of cells to vandetanib (right).

References

    1. Blais N. & Kassouf E. Maintenance therapies for non-small cell lung cancer. Front Oncol 4, 213 (2014). - PMC - PubMed
    1. da Cunha Santos G., Shepherd F. A. & Tsao M. S. EGFR mutations and lung cancer. Annu Rev Pathol 6, 49–69 (2011). - PubMed
    1. Mok T. S. et al. Gefitinib or carboplatin-paclitaxel in pulmonary adenocarcinoma. N Engl J Med 361, 947–57 (2009). - PubMed
    1. Maemondo M. et al. Gefitinib or chemotherapy for non-small-cell lung cancer with mutated EGFR. N Engl J Med 362, 2380–8 (2010). - PubMed
    1. Sequist L. V. et al. Genotypic and histological evolution of lung cancers acquiring resistance to EGFR inhibitors. Sci Transl Med 3, 75ra26 (2011). - PMC - PubMed

Publication types

MeSH terms