

Time-driven Activity-based Costing More Accurately Reflects Costs in Arthroplasty Surgery
- PMID: 25721575
- PMCID: PMC4686520
- DOI: 10.1007/s11999-015-4214-0
Time-driven Activity-based Costing More Accurately Reflects Costs in Arthroplasty Surgery
Abstract
Background: Cost estimates derived from traditional hospital cost accounting systems have inherent limitations that restrict their usefulness for measuring process and quality improvement. Newer approaches such as time-driven activity-based costing (TDABC) may offer more precise estimates of true cost, but to our knowledge, the differences between this TDABC and more traditional approaches have not been explored systematically in arthroplasty surgery.
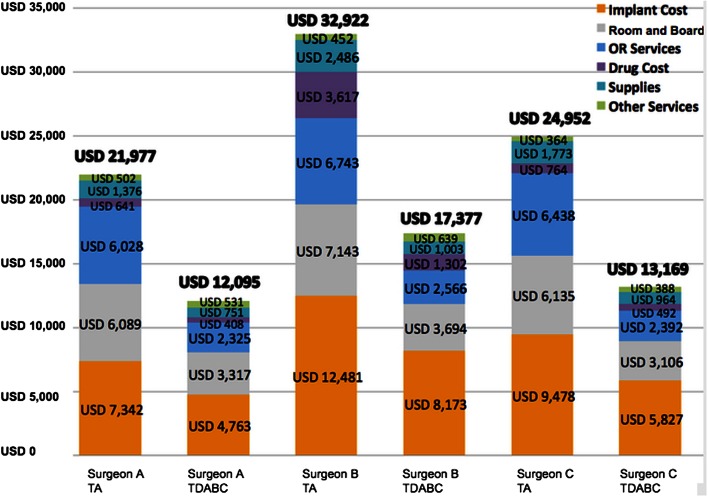
Questions/purposes: The purposes of this study were to compare the costs associated with (1) primary total hip arthroplasty (THA); (2) primary total knee arthroplasty (TKA); and (3) three surgeons performing these total joint arthroplasties (TJAs) as measured using TDABC versus traditional hospital accounting (TA).
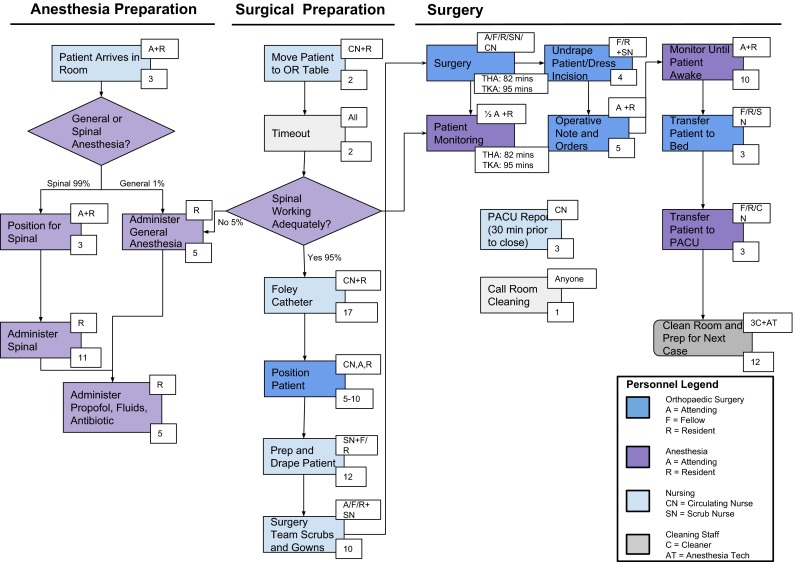
Methods: Process maps were developed for each phase of care (preoperative, intraoperative, and postoperative) for patients undergoing primary TJA performed by one of three surgeons at a tertiary care medical center. Personnel costs for each phase of care were measured using TDABC based on fully loaded labor rates, including physician compensation. Costs associated with consumables (including implants) were calculated based on direct purchase price. Total costs for 677 primary TJAs were aggregated over 17 months (January 2012 to May 2013) and organized into cost categories (room and board, implant, operating room services, drugs, supplies, other services). Costs derived using TDABC, based on actual time and intensity of resources used, were compared with costs derived using TA techniques based on activity-based costing and indirect costs calculated as a percentage of direct costs from the hospital decision support system.
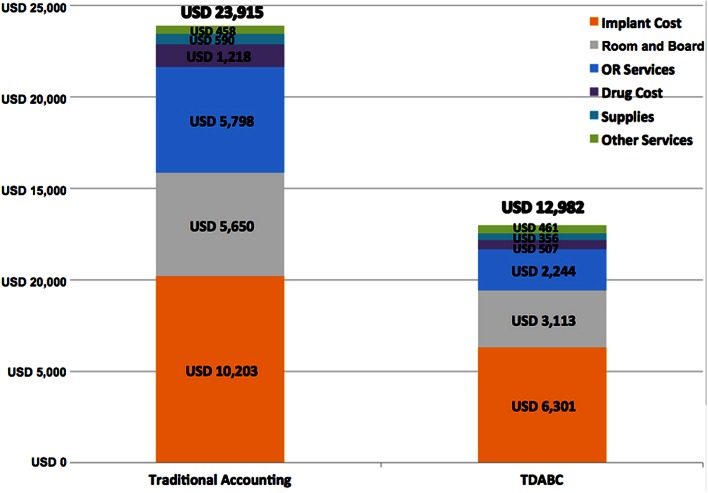
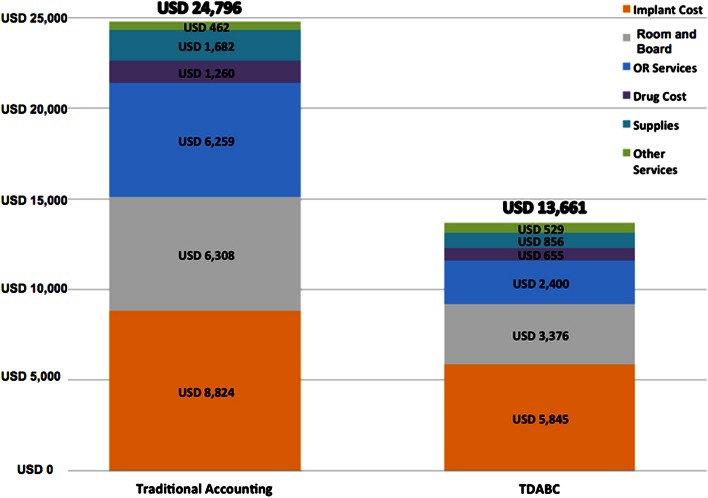
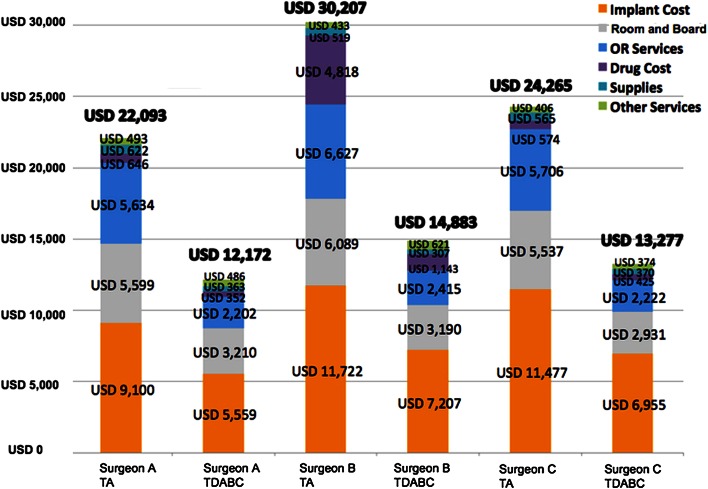
Results: Substantial differences between cost estimates using TDABC and TA were found for primary THA (USD 12,982 TDABC versus USD 23,915 TA), primary TKA (USD 13,661 TDABC versus USD 24,796 TA), and individually across all three surgeons for both (THA: TDABC = 49%-55% of TA total cost; TKA: TDABC = 53%-55% of TA total cost). Cost categories with the most variability between TA and TDABC estimates were operating room services and room and board.
Conclusions: Traditional hospital cost accounting systems overestimate the costs associated with many surgical procedures, including primary TJA. TDABC provides a more accurate measure of true resource use associated with TJAs and can be used to identify high-cost/high-variability processes that can be targeted for process/quality improvement.
Level of evidence: Level III, therapeutic study.
Figures
Comment in
-
CORR Insights(®): Time-driven Activity-based Costing More Accurately Reflects Costs in Arthroplasty Surgery.Clin Orthop Relat Res. 2016 Jan;474(1):16-8. doi: 10.1007/s11999-015-4295-9. Epub 2015 May 27. Clin Orthop Relat Res. 2016. PMID: 26013146 Free PMC article. No abstract available.
-
Editor's Spotlight/Take 5: Time-driven Activity-based Costing More Accurately Reflects Costs in Arthroplasty Surgery.Clin Orthop Relat Res. 2016 Jan;474(1):3-7. doi: 10.1007/s11999-015-4606-1. Epub 2015 Oct 30. Clin Orthop Relat Res. 2016. PMID: 26519194 Free PMC article. No abstract available.
References
-
- Donovan CJ, Hopkins M, Kimmel BM, Koberna S, Montie CA. How Cleveland Clinic used TDABC to improve value. Healthc Financ Manage. 2014;68:84–88. - PubMed
-
- Kaplan RS, Anderson SR. Time-driven activity-based costing. Harv Bus Rev. 2004;82(131):138. - PubMed
-
- Kaplan RS, Anderson SR. The innovation of time-driven activity-based costing. Journal of Cost Management. 2007;21.
Publication types
MeSH terms
LinkOut - more resources
Full Text Sources
Other Literature Sources
Medical
