. 2016 May;221(4):1911-25.
doi: 10.1007/s00429-015-1012-0. Epub 2015 Feb 27.

Frontotemporal correlates of impulsivity and machine learning in retired professional athletes with a history of multiple concussions

Affiliations

Frontotemporal correlates of impulsivity and machine learning in retired professional athletes with a history of multiple concussions

R Goswami et al. Brain Struct Funct. 2016 May.

Abstract

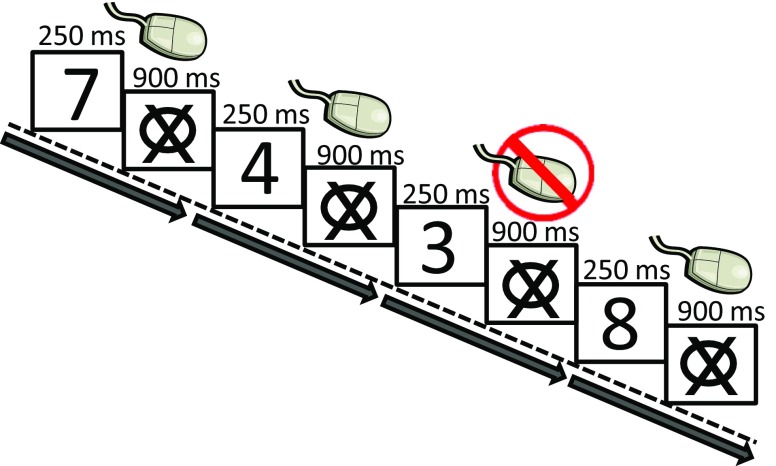
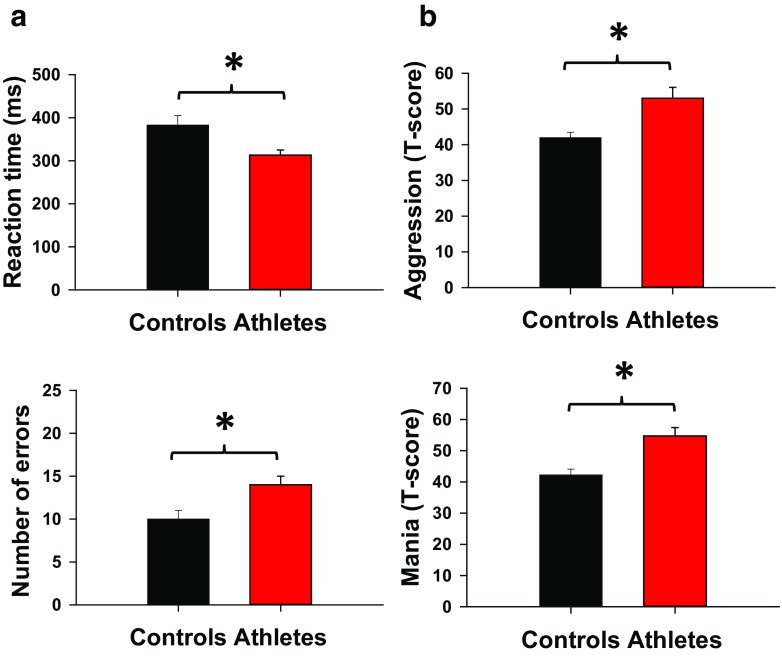
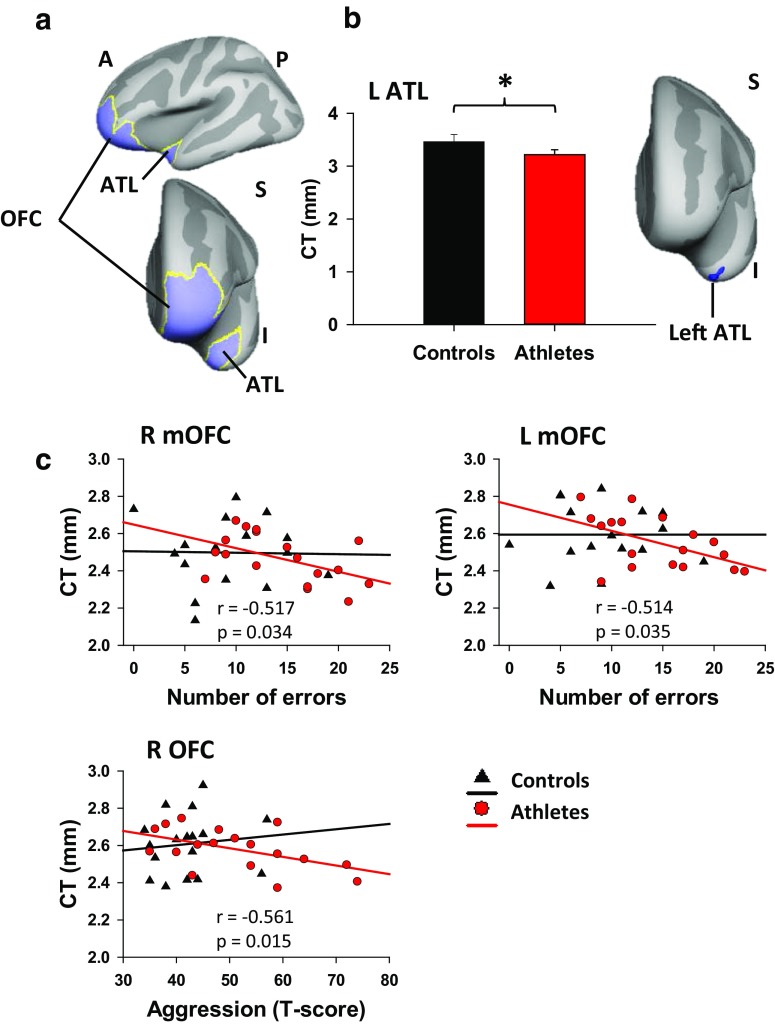
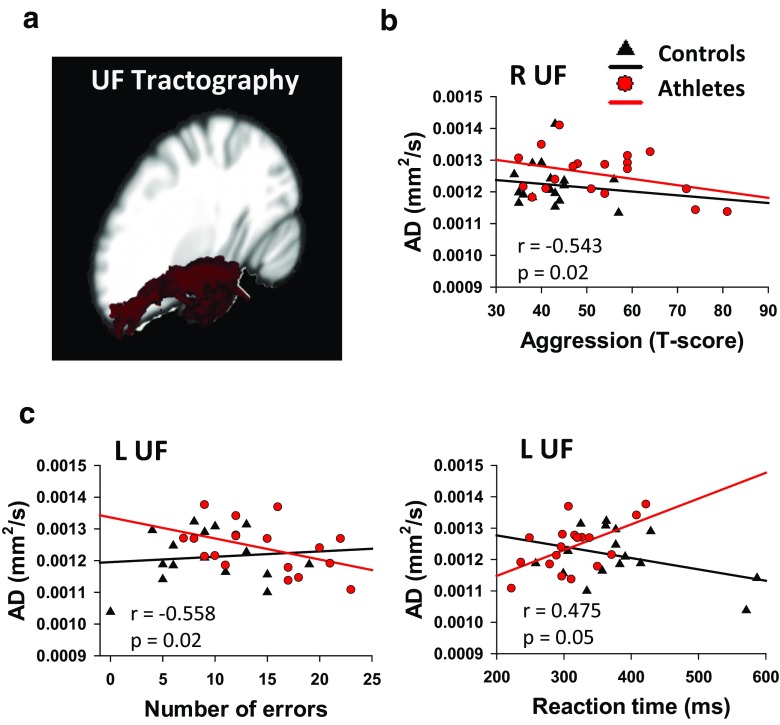
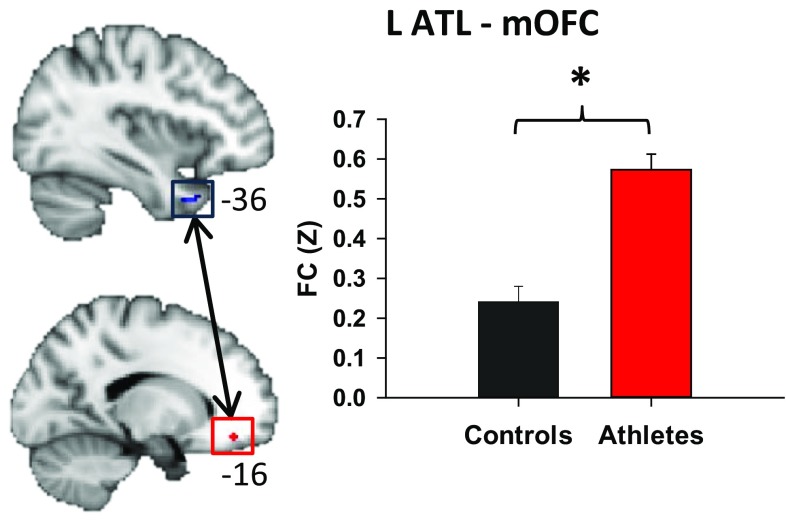
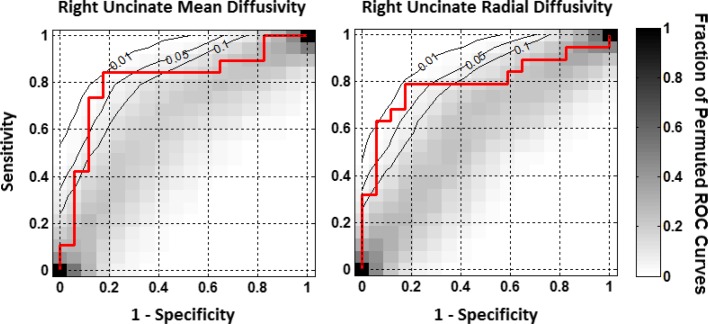
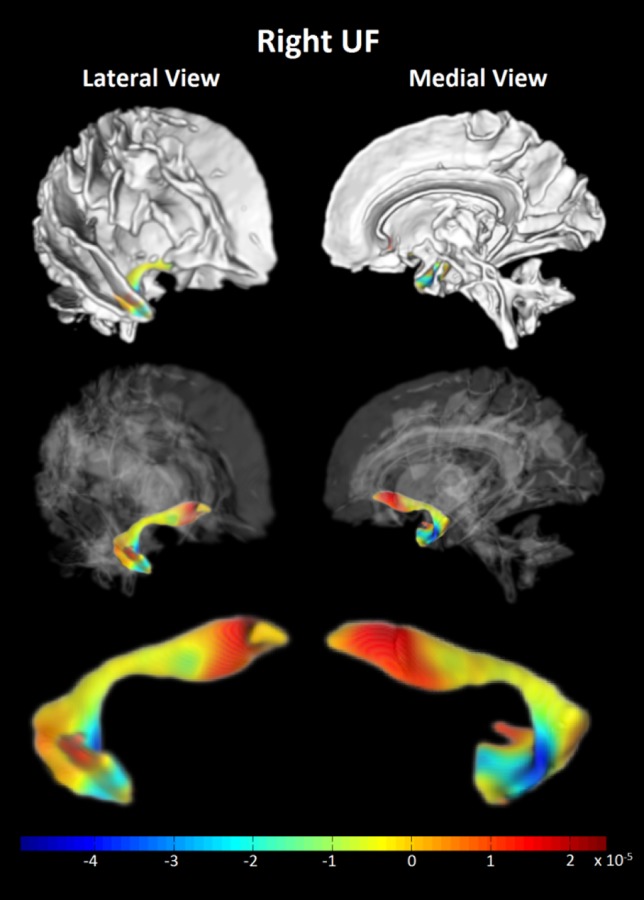
The frontotemporal cortical network is associated with behaviours such as impulsivity and aggression. The health of the uncinate fasciculus (UF) that connects the orbitofrontal cortex (OFC) with the anterior temporal lobe (ATL) may be a crucial determinant of behavioural regulation. Behavioural changes can emerge after repeated concussion and thus we used MRI to examine the UF and connected gray matter as it relates to impulsivity and aggression in retired professional football players who had sustained multiple concussions. Behaviourally, athletes had faster reaction times and an increased error rate on a go/no-go task, and increased aggression and mania compared to controls. MRI revealed that the athletes had (1) cortical thinning of the ATL, (2) negative correlations of OFC thickness with aggression and task errors, indicative of impulsivity, (3) negative correlations of UF axial diffusivity with error rates and aggression, and (4) elevated resting-state functional connectivity between the ATL and OFC. Using machine learning, we found that UF diffusion imaging differentiates athletes from healthy controls with significant classifiers based on UF mean and radial diffusivity showing 79-84 % sensitivity and specificity, and 0.8 areas under the ROC curves. The spatial pattern of classifier weights revealed hot spots at the orbitofrontal and temporal ends of the UF. These data implicate the UF system in the pathological outcomes of repeated concussion as they relate to impulsive behaviour. Furthermore, a support vector machine has potential utility in the general assessment and diagnosis of brain abnormalities following concussion.

Keywords: Concussion; Connectivity; Cortical thickness; Impulsivity; Machine learning; Uncinate fasciculus.


Figures

Fig. 1
Fig. 1
Illustration of go/no-go task. Faster reaction time and more errors were identified as an index of reduced response inhibition
Fig. 2
Fig. 2
a go/no-go (SART) results for reaction time and number of errors (out of a possible number of 25). Athletes had faster reaction time and greater number of errors compared to controls (p < 0.05). b PAI results indicated higher aggression and mania in athletes versus controls. Data are presented as mean ± SEM; *p < 0.05
Fig. 3
Fig. 3
a Masks used in the cortical thickness analysis (CTA) were restricted to the orbitofrontal cortex (OFC; Brodmann Area 10, 11, 47) and anterior temporal lobe (ATL; Brodmann area 38) shown in blue. b Cortical thinning of the left ATL in the athletes compared to controls in a region of the ATL (blue cluster) (p < 0.05, corrected for multiple comparisons). Data are presented as mean ± SEM; *p < 0.05. c In the athletes, the number of go/no-go errors was correlated with cortical thickness of the right (r = −0.517, p = 0.034) and left (r = −0.514, p = 0.035) medial OFC. As well, greater aggression was correlated with reduced cortical thickness of the right OFC (r = −0.561, p = 0.015). A anterior, P posterior, S superior, I inferior, L left, R right, mOFC medial OFC, CT cortical thickness
Fig. 4
Fig. 4
a Representation of probabilistic tractography group average of the uncinate fasciculus (UF). b Lower right UF axial diffusivity (AD) was correlated with more aggression in athletes (r = −0.543, p = 0.02). c Left UF AD differed between athletes and controls showing a a significant correlation with more errors (r = −0.558; p = 0.02), and a close trend for correlating with faster reaction time (r = 0.475; p = 0.05) in athletes. L left, R right
Fig. 5
Fig. 5
ROIs in the anterior temporal lobe (ATL) based on the region of cortical thinning observed in athletes (in blue), and orbitofrontal cortex (OFC) drawn as a 2-mm sphere (in red). On right, the bar graph depicts higher functional connectivity (FC) between the left ATL and left medial OFC in athletes versus controls (p < 0.05). L left
Fig. 6
Fig. 6
Receiver operating characteristic (ROC) curves from SVM radial basis function classifier training on the two significant DTI metrics (Table 1) measured at voxels of the right uncinate fasciculi. The actual ROC curves are depicted in red. Shown in grey scale is the proportion of 10,000 ROC curves from classifiers trained on data with the control/patient labels randomly permuted, as indicated by the vertical bar at right. The black lines are contours of this null distribution at p = 0.01, 0.05, and 0.1. Red ROC curves that penetrate the 0.05 contour are considered to be statistically significant
Fig. 7
Fig. 7
Contrasts of the spatial pattern of mean diffusivity (MD) along the right uncinate fasciculus (UF) for athletes versus controls are shown. The figure is a 3 × 2 grid of renderings of the right hemisphere white matter skeleton and UF from two different viewpoints: the lateral view of the right hemisphere from the anterior right side of the subject (left column), and medial view of the right hemisphere from the left of the subject (right column). The top row shows the entire right hemisphere WM skeleton as computed by TBSS, with the probabilistic tractography-based segmentation of the UF mostly obscured by other tracts. The 2nd row makes the non-UF white matter transparent to reveal the position of the UF in context. The bottom row is a magnification of the UF to better reveal the pattern of covariances between the MD at each voxel and group (−1 for controls, +1 for athletes), represented by the colour. A region of high positive covariance (red), indicating higher MD in athletes than in controls, can be seen at the orbitofrontal end of the tract. A region of high negative covariance (blue), indicating lower MD in athletes versus controls, can be seen at the anterior temporal end

References

    1. Aribasala BS, Cowie CJA, He J, Wood J, Mendelow AD, Mitchell P, Blamire AM. Classification of traumatic brain injury patients using multi-parametric automatic analysis of quantitative MRI scans. Lect Notes in Comput Sci (MIAR) 2010;6326:51–59. doi: 10.1007/978-3-642-15699-1_6. - DOI
    1. Baldassarre L, Mourão-Miranda J, Pontil M (2012) Structured sparsity models for brain decoding from fMRI data. In: Proceedings of the second international workshop on pattern recognition in neuroimaging, 2012
    1. Bechara A, Damasio H, Damasio AR. Emotion, decision making and the orbitofrontal cortex. Cereb Cortex. 2000;10(3):295–307. doi: 10.1093/cercor/10.3.295. - DOI - PubMed
    1. Behzadi Y, Restom K, Liau J, Liu TT. A component based noise correction method (CompCor) for BOLD and perfusion based fMRI. Neuroimage. 2007;37(1):90–101. doi: 10.1016/j.neuroimage.2007.04.042. - DOI - PMC - PubMed
    1. Berlin HA, Rolls ET, Kischka U. Impulsivity, time perception, emotion and reinforcement sensitivity in patients with orbitofrontal cortex lesions. Brain. 2004;127(Pt 5):1108–1126. doi: 10.1093/brain/awh135. - DOI - PubMed

Publication types

MeSH terms

LinkOut - more resources