. 2015 Feb 27:6:6375.
doi: 10.1038/ncomms7375.

Generation of cellular immune memory and B-cell immunity is impaired by natural killer cells

Affiliations

Generation of cellular immune memory and B-cell immunity is impaired by natural killer cells

Carolyn Rydyznski et al. Nat Commun. .

Abstract

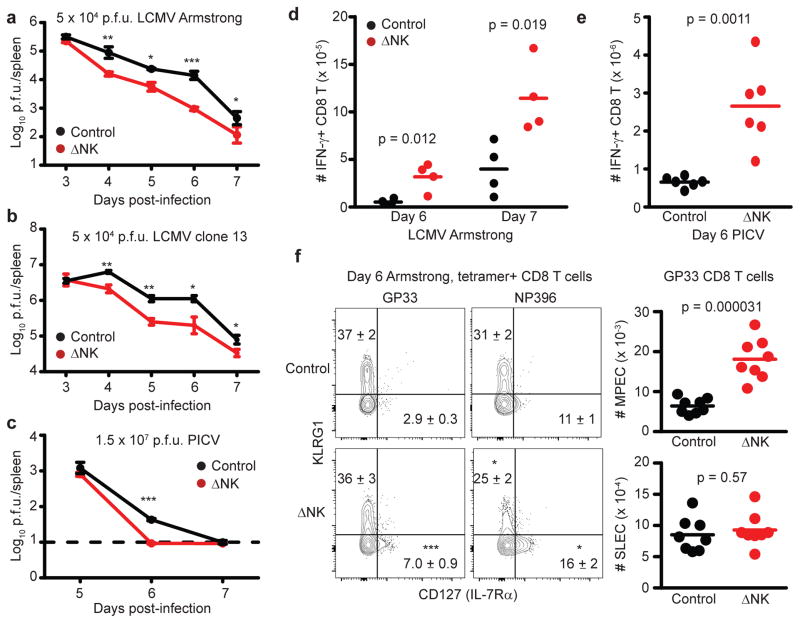
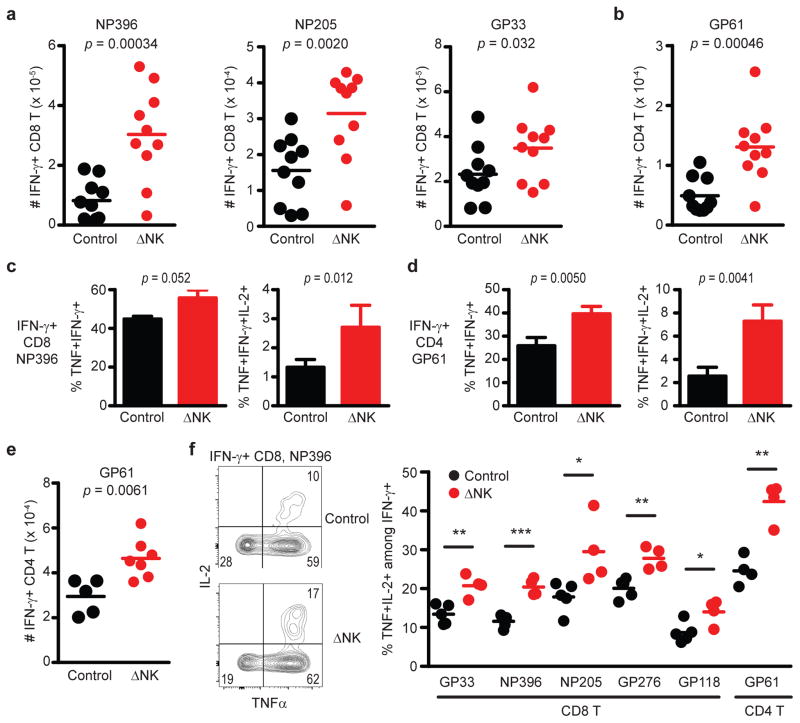
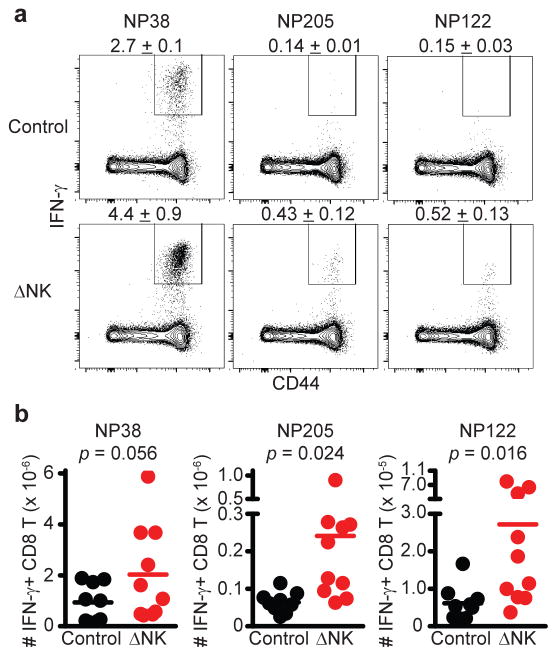
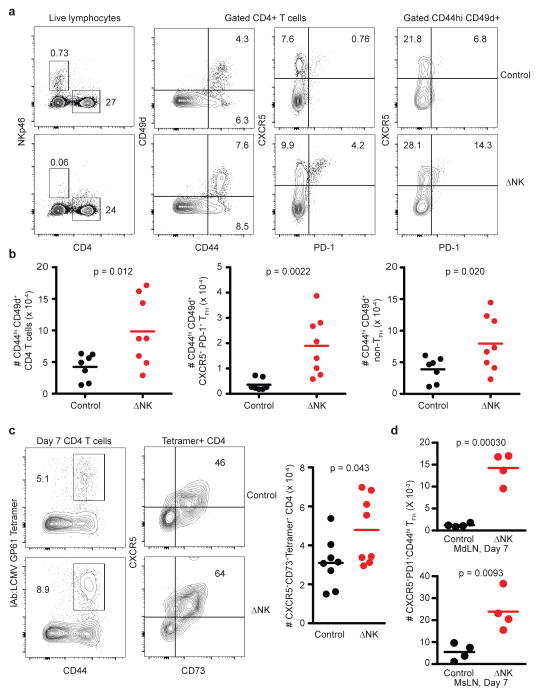
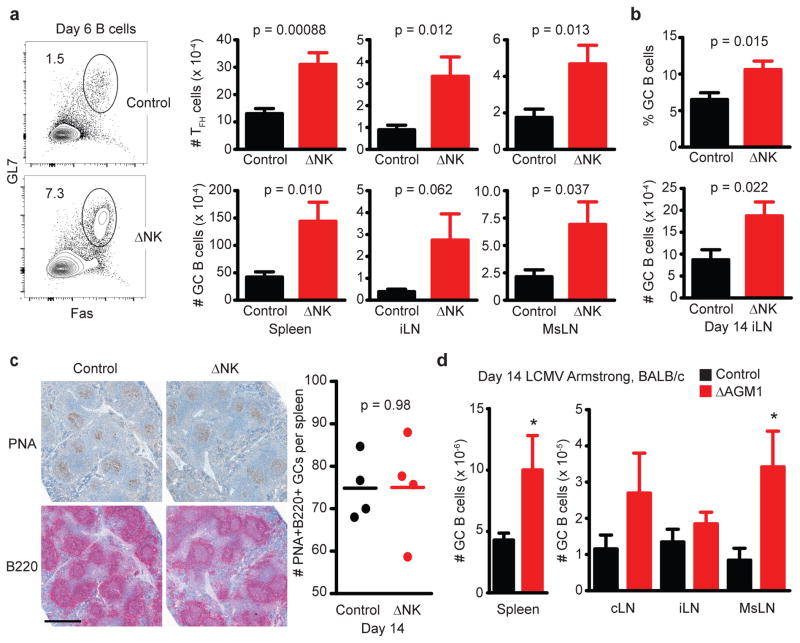
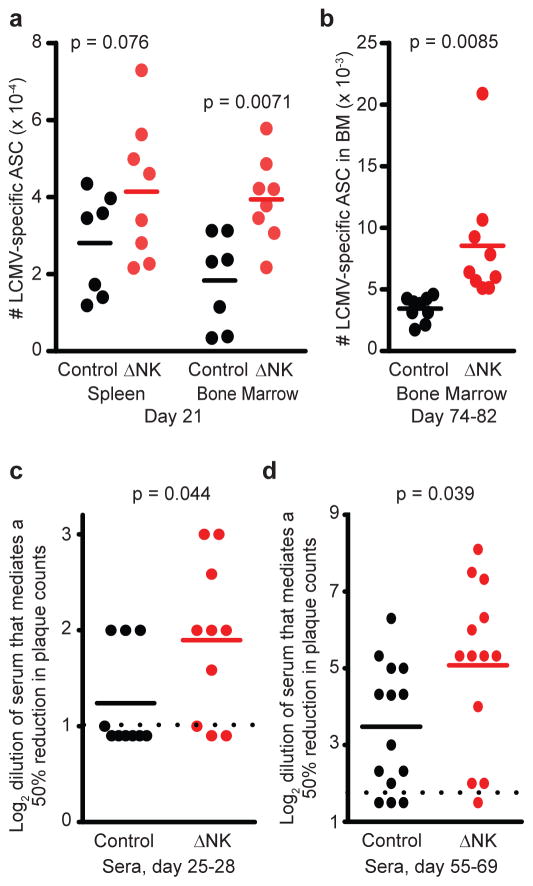
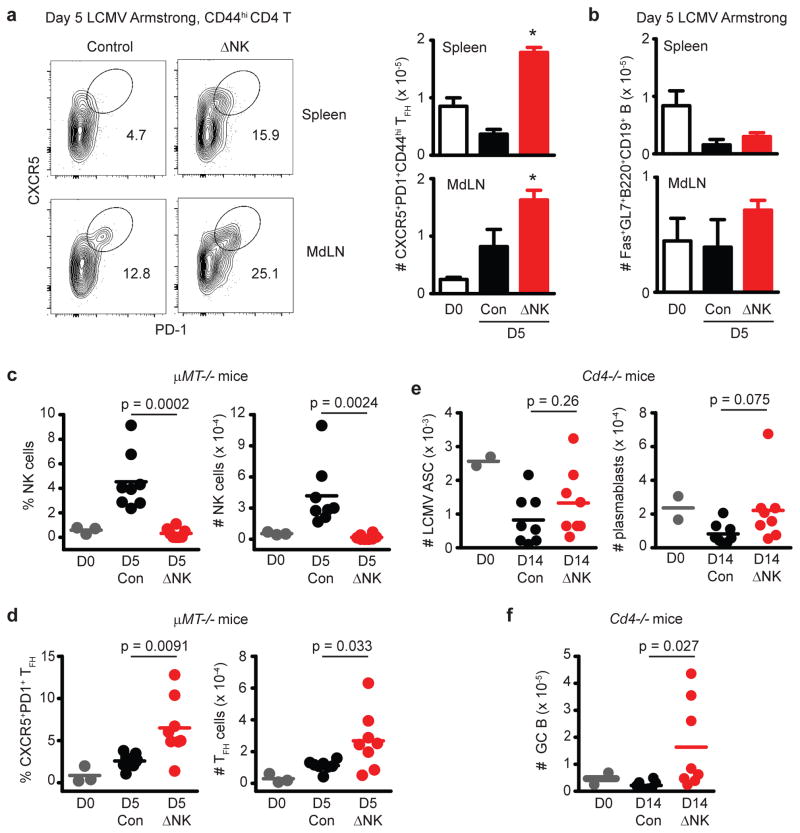
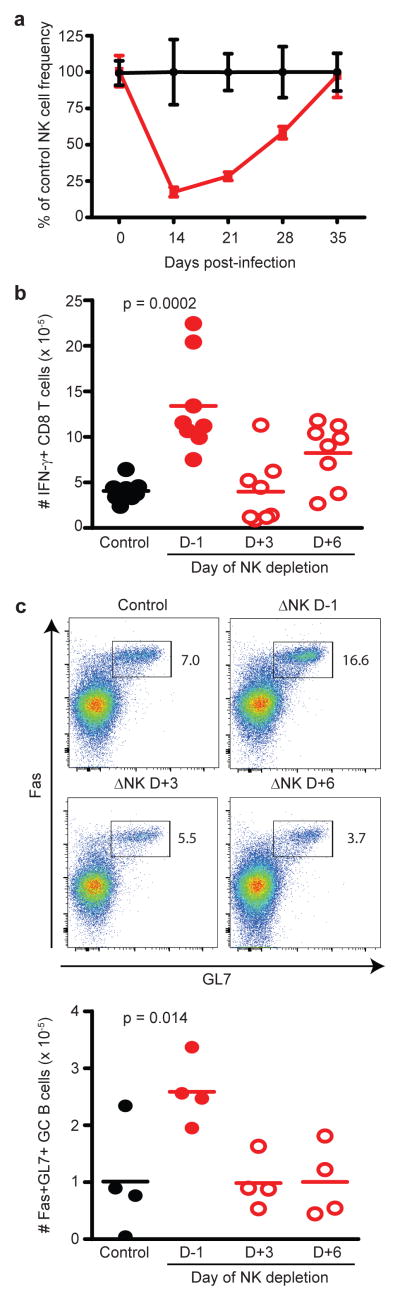
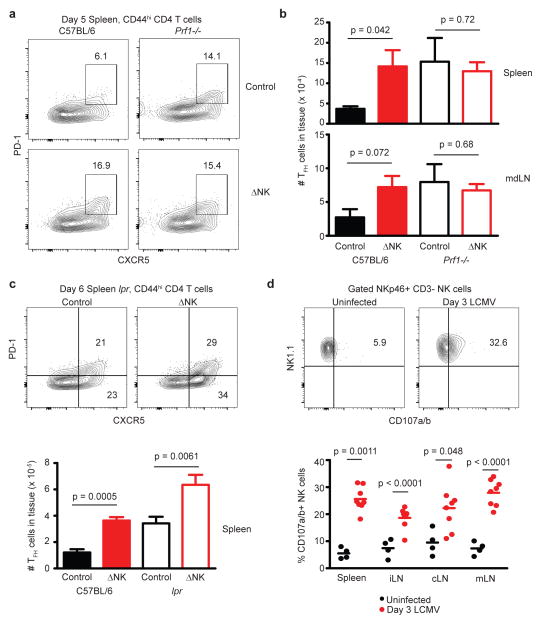
The goal of most vaccines is the induction of long-lived memory T and B cells capable of protecting the host from infection by cytotoxic mechanisms, cytokines and high-affinity antibodies. However, efforts to develop vaccines against major human pathogens such as HIV and HCV have not been successful, thereby highlighting the need for novel approaches to circumvent immunoregulatory mechanisms that limit the induction of protective immunity. Here, we show that mouse natural killer (NK) cells inhibit generation of long-lived virus-specific memory T- and B cells as well as virus-specific antibody production after acute infection. Mechanistically, NK cells suppressed CD4 T cells and follicular helper T cells (T(FH)) in a perforin-dependent manner during the first few days of infection, resulting in a weaker germinal centre (GC) response and diminished immune memory. We anticipate that innovative strategies to relieve NK cell-mediated suppression of immunity should facilitate development of efficacious new vaccines targeting difficult-to-prevent infections.


Conflict of interest statement

Competing financial interests

The authors declare no competing financial interests.

Figures

Figure 1
Figure 1. NK cells limit T cell-mediated antiviral immunity during acute infection
C57BL/6 mice (n = 8 per group) were either treated i.p. with 25 μg NK cell-depleting anti-NK1.1 antibody (ΔNK) or a non-depleting isotype control (Control) one day before i.p. infection with (a,d,f) 5 × 10⁴ p.f.u. of LCMV Armstrong, (b) 5 × 10⁴ p.f.u. of LCMV clone 13, or (c,e) 1.5 × 10⁷ p.f.u. of PICV (n = 3–4 per group). Statistical differences between groups were determined by Student’s t-test and are denoted as *p<0.05, **p<0.01, ***p<0.001, or labeled p value. (a-c) Viral titers in the spleen (± s.e.m.) were determined at various time points p.i., where dotted line denotes limit of detection. (D,E) At days 6 or 7 after (d) LCMV Armstrong (n = 4) or (e) day 6 of PICV infection (n = 6), the quantities of IFN-γ-expressing (d) LCMV NP396-specific or (e) PICV NP38-specific CD44hi CD8 T cells were determined in the spleen by intracellular cytokine staining after in vitro restimulation with virus-derived peptides. (f) On day 6 of LCMV Armstrong infection (n = 8), virus-specific CD8 T cells were determined by staining with LCMV GP33- or NP396-loaded MHC class I tetramers. FACS plots display expression of KLRG1 and CD127 by gated CD8+ CD44hi tetramer-reactive CD8 T cells with mean (± s.e.m.) proportion (in FACS plots) and number (graphs) of SLEC (KLRG1+ CD127) and MPEC (KLRG1 CD127+) phenotype cells among tetramer-reactive CD8 T cells. All data are representative of two to three independent experiments.
Figure 2
Figure 2. Magnitude and quality of antiviral memory T cell responses are impaired by NK cells
C57BL/6 mice (n = 9–10 per group) were either treated i.p. with 25 μg anti-NK1.1 antibody (ΔNK) or isotype control (Control) one day before i.p. infection with 5 × 10⁴ p.f.u. of (a-d) LCMV clone 13 or (e,f) LCMV Armstrong. (a,b) The numbers of splenic IFN-γ+ LCMV-specific (a) CD8 and (b) CD4 T cells were determined 49–52 days p.i. by intracellular cytokine staining after in vitro restimulation with virus-derived peptides. The fraction of IFN-γ+ LCMV (c) NP396-specific CD8 and (d) GP61-specific CD4 T cells (± s.e.m.) co-expressing TNF-α (left) or TNF-α and IL-2 (right) is graphed (n = 10 per group). (e) The number of IFN-γ+ GP61-specific CD4 T cells was determined in the spleen 36 days after infection with LCMV Armstrong. (f) The fraction of IFN-γ+ CD8 and CD4 T cells co-expressing TNF-α and IL-2 at day 202 of LCMV Armstrong infection is graphed for mice (n = 4–5 per group) treated with isotype (Control) or anti-NK1.1 antibody (ΔNK) one day before infection. Significant differences between groups were determined by Student’s t-test and are displayed as *p<0.05, **p<0.01, ***p<0.001, or actual p value. Data in (a-d) are pooled from two independent experiments, while (e,f) are representative of two similar experiments.
Figure 3
Figure 3. Greater magnitude and breadth of memory CD8 T cell responses when primed in absence of NK cells
Following selective depletion of NK cells (ΔNK) or treatment with control antibody (Control), C57BL/6 mice were infected with 1.5 × 10⁷ p.f.u. of PICV i.p. At day 73 p.i., the (a) proportion (mean ± s.e.m., n = 5 per group) and (b) number (n = 9–10 per group) of IFN-γ-expressing PICV-specific CD8 T cells was determined in the spleen by intracellular cytokine staining after in vitro restimulation with virus-derived peptides. Data in (a) are representative of two independent experiments, while data from two experiments are pooled in (b). Statistical differences between groups were determined by Student’s t-test.
Figure 4
Figure 4. NK cells suppress TFH responses during infection
Groups of C57BL/6 mice were infected with 5 × 10⁴ p.f.u. (i.p.) of (a-c) LCMV Armstrong (n = 7–8 per group) or (d) 3 × 10⁵ c.f.u. (i.p.) of L. monocytogenes (n = 4 per group) one day after treatment with anti-NK1.1 (ΔNK) or isotype control (Control). (a,b) At day 6 p.i., live singlet lymphocytes in the inguinal LN (left panel, a) were determined to be NK cells (NKp46+CD4) or CD4 T cells (NKp46CD4+). Gated CD4 T cells (middle panels, b) were analyzed for activation markers CD44 and CD49d or TFH markers PD-1 and CXCR5. Activated (CD44hiCD49d+) CD4 T cells (right panel, a) were further analyzed for expression of PD-1 and CXCR5. Representative FACS plots and proportions are shown in (a), while total numbers of activated (left panel, b: CD44hiCD49d+), TFH (middle panel, b: CD44hiCD49d+ CXCR5+PD-1+), and non-TFH (right panel, b: CD44hiCD49d+CXCR5PD-1) splenic CD4 T cells for individual mice are shown in (b). (c) At day 7 of infection, splenic CD4 T cells (left panel) were stained with anti-CD44 and LCMV GP61-loaded MHC class II tetramers to determine LCMV-specific CD4 T cells. These cells were examined for markers of TFH phenotype CD73 and CXCR5 (middle panel). The total number of LCMV GP61-specific TFH cells (CD73+CXCR5+CD44hiTetramer+) in 8 individual mice per group is plotted in right panel. (d) Number of TFH (CD44hiCD49d+CXCR5+PD-1+) in the mediastinal (MdLN) and mesenteric (MsLN) LNs at day 7 of L. monocytogenes infection. Data are pooled from two independent experiments, and statistically significant differences were determined by Student’s t-test.
Figure 5
Figure 5. NK cells suppress germinal center responses after acute virus infection
(a–c) C57BL/6 mice were depleted of NK cells with anti-NK1.1 or administered an equivalent amount of isotype control antibody (Control) one day prior to infection with 5 × 10⁴ p.f.u. LCMV Armstrong i.p. (a) Six to seven days p.i., the proportions and numbers of GC (Fas+GL7+) B cells (B220+CD19+) and TFH cells (± s.e.m.) were determined in the spleen (n = 12 per group), inguinal (iLN; n = 12-16 per group), and mesenteric (MsLN; n = 12–16 per group) nodes. (b) The fraction and number of TFH cells in the iLN at day 14 of infection (n = 8 per group). (c) PNA and anti-B220 staining of GC reactions in formalin-fixed spleen sections at day 14 of infection (scale bar = 500 microns). PNA+B22O+ GC areas were enumerated in a complete spleen section from 4 mice per group. (d) The frequency of GC B cells in the spleen and lymph nodes at day 14 of LCMV Armstrong (5 × 10⁴ p.f.u. i.p.) infection in groups of BALB/c mice (n = 8 per group) that received normal rabbit serum (control) or 20 μL anti-asialoGM1 (ΔAGM1) one day prior to infection. All results are representative of two similar experiments. Significant differences between control and NK cell-depleted groups are displayed as *p<0.05 or given p value, as determined by Student’s t-test.
Figure 6
Figure 6. Enhanced LCMV-specific antibody responses in absence of NK cells
C57BL/6 mice (n = 7–9 per group) were depleted of NK cells (ΔNK) or treated with isotype antibody (control) one day prior to i.p. infection with 5 × 10⁴ p.f.u. LCMV Armstrong. (a) 21 or (b) 74 – 82 days p.i., spleen and bone marrow cells were collected and subjected to ELISPOT analysis of antibody-secreting cell (ASC) frequencies. (c) Sera from mice (n = 10 per group) at day 28 p.i. was analyzed for the ability to neutralize LCMV in a plaque-reduction assay, which is graphed as log2 of the greatest dilution that could mediate a ≥ 50% reduction in plaque-forming units. (d) Neutralizing antibody titers were also determined as in (c) for sera from mice (n = 13–14 per group) 55 – 69 days after LCMV Armstrong infection. Dotted lines represent limit of detection. Data are pooled from 2 to 3 independent experiments, and statistical significance of differences determined by Student’s t-test.
Figure 7
Figure 7. Inhibition of humoral immunity by NK cells involves CD4 T cells
C57BL/6 mice were depleted of NK cells (ΔNK) or treated with isotype antibody (Control, Con) one day prior to i.p. infection with 5 × 10⁴ p.f.u. of LCMV Armstrong. Significant differences between control and NK cell-depleted groups were determined by Student’s t-test and are displayed as *p<0.05 or actual p value. On day 5 after Armstrong infection, frequencies of (a) TFH (CXCR5+PD1+CD44hiCD4+) cells and (b) GC (Fas+GL7+B220+CD19+) B cells (± s.e.m.) were determined (n = 4 per group) in the spleen and mediastinal LN (MdLN). Results are representative of two similar experiments. (c,d) μMT-/- mice (n = 3 for naïve; n = 8 per group for infected) were depleted of NK cells (ΔNK) or treated with control antibody (Con) one day prior to infection with 5 × 10⁴ p.f.u. (i.p.) LCMV Armstrong, or left uninfected (D0). The proportion (left) and number (right) of (c) NKp46+CD3 NK cells or (d) CD44hiCXCR5+PD1+ CD4 T cells was determined in the spleen day 5 of infection. (e,f) Cd4−/− mice were depleted of NK cells (ΔNK) or treated with control antibody (Con) one day prior to infection with 5 ×10⁴ p.f.u. (i.p.) LCMV Armstrong (n = 2 for naïve; n = 8 per group for infected). (e) The numbers of plasmablast cells (CD138+IgDCD19+B220+), LCMV-specific antibody-secreting cells, and (f) GC (Fas+IgDCD19+B220+) B cells were determined in the spleen at day 14 of infection. All results are pooled from two independent experiments.
Figure 8
Figure 8. NK cell suppression of humoral and cellular immunity occurs at early stage of infection
Prior to infection (D-1) with 5 × 10⁴ p.f.u. (i.p.) of the Armstrong strain of LCMV, C57BL/6 mice (n = 4 per group) were treated with 25 μg of anti-NK1.1 (ΔNK) or isotype (control) antibody. (a) The frequencies of NK cells (± s.e.m.) were determined in peripheral blood at various times post-infection, and are plotted as a fraction of non-depleted control mice at each time point. (b,c) Additional groups of mice were administered a single dose of anti-NK1.1 depleting antibody at later time points (day 3 (D+3) or day 6 (D+6) p.i.). (b) LCMV-specific CD8 T cell responses in the spleen (n = 8 per group) were measured by intracellular cytokine staining at day 14 p.i. after in vitro restimulation with virus-derived peptides. (c) Numbers of GC B cells (n = 4 per group) were determined in the iLN at day 14 p.i. Results are pooled from two independent experiments, and statistically significant differences were determined by Student’s t-test.
Figure 9
Figure 9. NK cell suppression of TFH responses depends upon perforin
(a–c) Groups of C57BL/6, prf1-/-, or lpr mice (n = 8 per group) were depleted of NK cells (ΔNK) or administered control antibody (Control) one day prior to infection with LCMV Armstrong (5 × 10⁴ p.f.u.). (a) Representative staining of TFH markers CXCR5 and PD-1 on activated (CD44hi) CD4 T cells in the spleen 5 days p.i. (b) Numbers of TFH cells (PD-1+CXCR5+CD44hiCD4+) in the spleen and mdLN at day 5 p.i. (± s.e.m.). (c) Proportion and number of TFH cells (± s.e.m.) in the spleen at day 6 of infection of C57BL/6 and lpr mice. (d) Ex vivo degranulation measured by CD107a/b staining of NKp46+CD3 NK cells in the spleen and LNs of uninfected or LCMV-infected (day 3 p.i.), and total number of degranulating (CD107a/b+) NK cells (n = 8 per group) is plotted. Results are pooled from two independent replicate experiments, and statistically significant differences were determined using Student’s t-test.

References

    1. Plotkin SA. Correlates of protection induced by vaccination. Clinical and vaccine immunology: CVI. 2010;17:1055–1065. - PMC - PubMed
    1. Swadling L, Klenerman P, Barnes E. Ever closer to a prophylactic vaccine for HCV. Expert opinion on biological therapy. 2013;13:1109–1124. - PMC - PubMed
    1. Kwong PD, Mascola JR, Nabel GJ. The changing face of HIV vaccine research. Journal of the International AIDS Society. 2012;15:17407. - PMC - PubMed
    1. Lanier LL. Evolutionary struggles between NK cells and viruses. Nat Rev Immunol. 2008;8:259–268. - PMC - PubMed
    1. Welsh RM, Waggoner SN. NK cells controlling virus-specific T cells: Rheostats for acute vs. persistent infections. Virology. 2013;435:37–45. - PMC - PubMed

Publication types