. 2015 Feb 27:6:6381.
doi: 10.1038/ncomms7381.

3D hotspots of recurrent retroviral insertions reveal long-range interactions with cancer genes

Affiliations

3D hotspots of recurrent retroviral insertions reveal long-range interactions with cancer genes

Sepideh Babaei et al. Nat Commun. .

Abstract

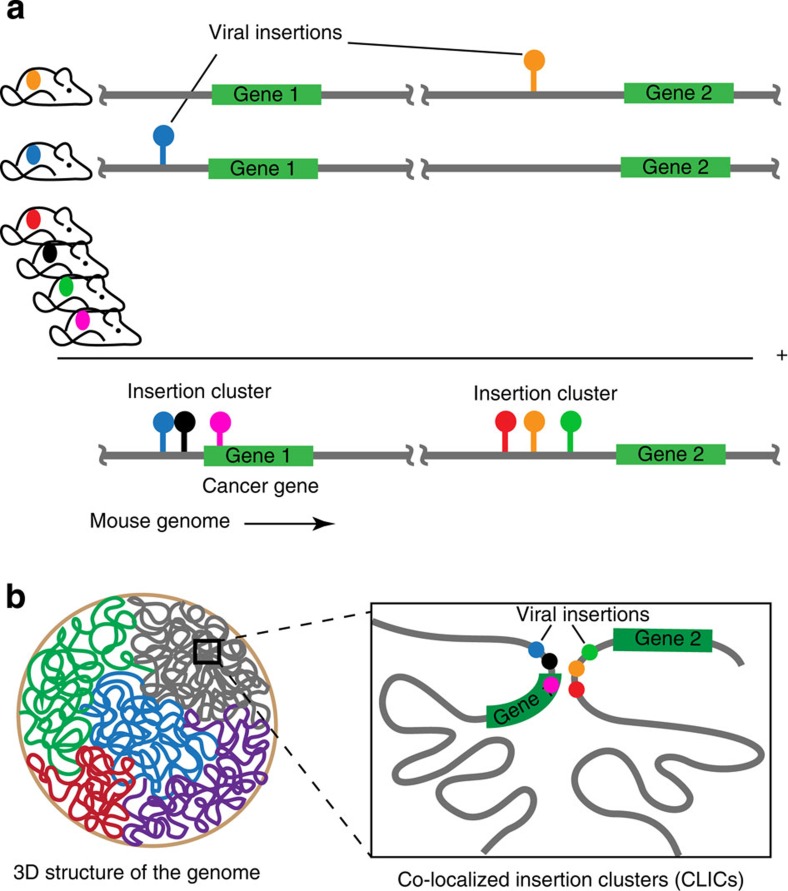
Genomically distal mutations can contribute to the deregulation of cancer genes by engaging in chromatin interactions. To study this, we overlay viral cancer-causing insertions obtained in a murine retroviral insertional mutagenesis screen with genome-wide chromatin conformation capture data. Here we find that insertions tend to cluster in 3D hotspots within the nucleus. The identified hotspots are significantly enriched for known cancer genes, and bear the expected characteristics of bona fide regulatory interactions, such as enrichment for transcription factor-binding sites. In addition, we observe a striking pattern of mutual exclusive integration. This is an indication that insertions in these loci target the same gene, either in their linear genomic vicinity or in their 3D spatial vicinity. Our findings shed new light on the repertoire of targets obtained from insertional mutagenesis screening and underline the importance of considering the genome as a 3D structure when studying effects of genomic perturbations.


Conflict of interest statement

There are no competing financial interests.

Figures

Figure 1
Figure 1. Illustration of insertions in the 1D and 3D genome.
(a) A cancer candidate gene is traditionally determined by searching for a gene that harbours frequent mutations in its genomic vicinity across multiple independent tumours. (b) Genomically distal insertions can affect gene activity by 3D conformation of the genome. For instance, insertions that deregulate gene 1 may be dispersed across a pair of co-localized insertion clusters (CLICs) that engage in frequent chromatin interactions. As a consequence, the mutation signal of the insertion cluster in the genomic vicinity of gene 1 is diluted and may not reach the required significance threshold to be called a CIS. Moreover, gene 2 is not necessarily the actual target gene of the insertion cluster in its neighbourhood. Thus, while searching for candidate target genes, insertions can be associated to the wrong target gene or left without a clear target.
Figure 2
Figure 2. Normalized Hi-C contact matrix.
(a) Hi-C contact matrix of chromosome 2. (b) Rank-normalized Hi-C contact matrix. (c) The insertion count per bin on each chromosome together with the value of the first principle component (PC1) of the correlation matrix of the normalized Hi-C contacts (at 200 kb resolution). A positive or negative value of PC1 indicates open or closed chromatin compartments, respectively.
Figure 3
Figure 3. Comparison of Hi-C contact score distributions.
(a) Bin-pair categories based on the insertion count (S) per 200-kb bin. Bins are divided into non-inserted (NI; Si=0), inserted (I; 0<SiNm) or recurrently inserted (RI; Si>Nr) categories. (b) Distribution of rank-normalized Hi-C interactions for six bin-pair categories for chromosome 1. The other chromosomes are plotted in Supplementary Fig. 5. We select Nm=2 and Nr=5 (see Supplementary Fig. 4). (c) Boxplot comparing Hi-C interaction of the six bin-pair categories including 15 unique combinations. This is done for all chromosomes, that is, each box represents 20 values. The y axis represents the difference between the median Hi-C score of bin-pair category A and bin-pair category B. A starred circle indicates a significant difference between medians for that chromosome (Wilcoxon rank-sum test; P value<10−10). The bin-pair categories that are compared are schematically illustrated under each box. Boxes are sorted based on their medians.
Figure 4
Figure 4. Properties of CLICs and CLIC loci.
(a) Kernel-smoothed insertion count (80-kb Gaussian kernel) along the mouse genome. ICs are identified as peaks. The red line shows the median peak height (5.2), below which insertions are considered to be background insertions, that is, not contributing to tumor development. Genes associated to CISs with peak height >40 are shown (23 CISs). Among the top CISs, 19 genes that are also detected by our CLIC analysis are indicated in red. The 31 known cancer genes that are discovered as CLIC loci are indicated in blue. The insertion density in the genomic vicinity of these genes is not sufficient to be detected as CIS genes. (b) Venn diagram indicating overlap of CLIC loci with CIS and Cancer Gene Census (CGC) genes. (c) Patterns of mutual exclusive insertions in CLIC loci that form CLICs with the Notch1, Ikzf1, Jdp2 and Ccnd3 loci. A red colour indicates that an insertion occurred in the corresponding sample (y axis) and CLIC locus (x axis) (d) Boxplots of Mean-Manhattan distances between significant CLIC loci (that is, actual CLICs) and non-significant combinations of CLIC loci. This distance is defined as the fraction of samples with one of two loci inserted and captures mutual exclusivity. CLICs exhibit a highly significant (Wilcoxon rank-sum test; P value=10−66) pattern of mutual exclusive insertions.
Figure 5
Figure 5. CLIC loci on chromosome 2.
(a) Circos plot of chromosome 2. The purple track indicates the chromosome. Light green, orange, dark green, purple and red tracks indicate topologically associated domains (TADs), enhancers, DNase I hypersensitive sites (DHSs), transcription factor-binding sites (TFBSs; for cMyc, CTCF, Taf3, Zfx and Mcaf1), and insertion sites, respectively. Tick marks appear every 5 Mb on the chromosome. The ICs are indicated by light red. Links indicate significant Hi-C contacts between ICs. CIS and CGC genes are indicated by red and blue, respectively. (b) CLICs containing the Notch1 locus. Tick marks appear every 100 kb on the chromosome. Genes in each CLIC locus are indicated by black.

References

    1. Homouz D. & Kudlicki A. S. The 3D organization of the yeast genome correlates with co-expression and reflects functional relations between genes. PLoS ONE 8, e54699 (2013). - PMC - PubMed
    1. Gerstein M. B. et al. Architecture of the human regulatory network derived from ENCODE data. Nature 489, 91–100 (2012). - PMC - PubMed
    1. Shen Y. et al. A map of the cis-regulatory sequences in the mouse genome. Nature 488, 116–120 (2012). - PMC - PubMed
    1. Sanyal A., Lajoie B. R., Jain G. & Dekker J. The long-range interaction landscape of gene promoters. Nature 489, 109–113 (2012). - PMC - PubMed
    1. Jin F. et al. A high-resolution map of the three-dimensional chromatin interactome in human cells. Nature 503, 290–294 (2013). - PMC - PubMed

Publication types

MeSH terms

LinkOut - more resources