Review
. 2015 Feb 27;116(5):909-22.
doi: 10.1161/CIRCRESAHA.116.302888.

Are there genetic paths common to obesity, cardiovascular disease outcomes, and cardiovascular risk factors?

Affiliations
Review

Are there genetic paths common to obesity, cardiovascular disease outcomes, and cardiovascular risk factors?

Tuomo Rankinen et al. Circ Res. .

Abstract

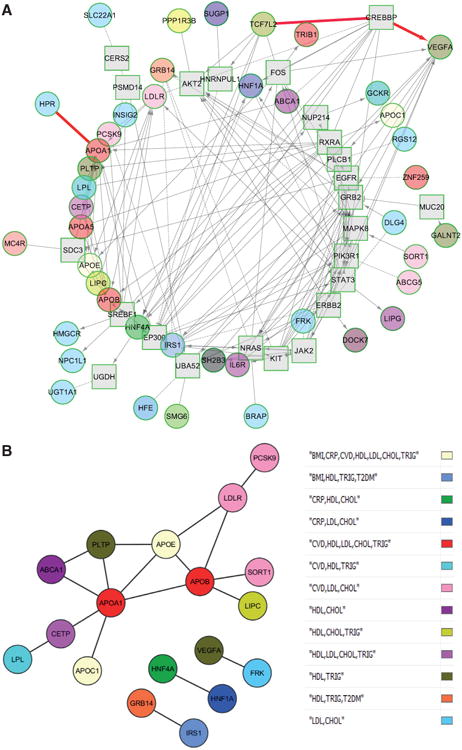
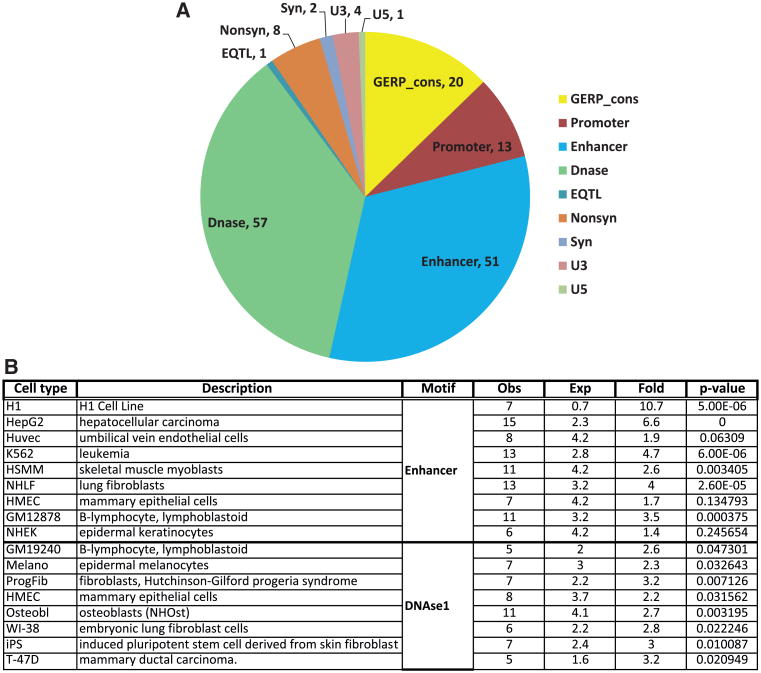
Clustering of obesity, coronary artery disease, and cardiovascular disease risk factors is observed in epidemiological studies and clinical settings. Twin and family studies have provided some supporting evidence for the clustering hypothesis. Loci nearest a lead single nucleotide polymorphism (SNP) showing genome-wide significant associations with coronary artery disease, body mass index, C-reactive protein, blood pressure, lipids, and type 2 diabetes mellitus were selected for pathway and network analyses. Eighty-seven autosomal regions (181 SNPs), mapping to 56 genes, were found to be pleiotropic. Most pleiotropic regions contained genes associated with coronary artery disease and plasma lipids, whereas some exhibited coaggregation between obesity and cardiovascular disease risk factors. We observed enrichment for liver X receptor (LXR)/retinoid X receptor (RXR) and farnesoid X receptor/RXR nuclear receptor signaling among pleiotropic genes and for signatures of coronary artery disease and hepatic steatosis. In the search for functionally interacting networks, we found that 43 pleiotropic genes were interacting in a network with an additional 24 linker genes. ENCODE (Encyclopedia of DNA Elements) data were queried for distribution of pleiotropic SNPs among regulatory elements and coding sequence variations. Of the 181 SNPs, 136 were annotated to ≥ 1 regulatory feature. An enrichment analysis found over-representation of enhancers and DNAse hypersensitive regions when compared against all SNPs of the 1000 Genomes pilot project. In summary, there are genomic regions exerting pleiotropic effects on cardiovascular disease risk factors, although only a few included obesity. Further studies are needed to resolve the clustering in terms of DNA variants, genes, pathways, and actionable targets.

Keywords: cluster analysis; gene networks; genetic pleiotropism.


Conflict of interest statement

Disclosures: Dr Bouchard is an advisor to Pathway Genomics, San Diego, CA. The other authors report no conflicts.

Figures

Figure 1
Figure 1. Pleiotropy of genes with primary association to (A) coronary artery disease (CAD) and (B) body mass index (BMI)
Genes were identified based on their proximity to genome-wide association study–associated CAD and BMI single nucleotide polymorphisms (SNPs). Traits and genes are represented in columns and rows, respectively. The association of a gene to each trait is indicated in red with the color intensity proportional to the number of trait-associated SNPs mapping to that gene. The heatmap is based on a 2-way average linkage hierarchical clustering such that genes and traits are clustered based on the similarities of trait-wide associations. Heatmaps for the other cardiovascular disease traits are depicted in Online Figure I. BMI indicates body mass index; CAD, coronary artery disease; CHOL, total cholesterol; CRP, C-reactive protein; HDL, high-density lipoprotein cholesterol; HTN, hypertension; LDL, low-density lipoprotein cholesterol; T2DM, type 2 diabetes mellitus; and TRIG, triglycerides.
Figure 2
Figure 2. Enrichment of biological pathways and toxicity gene signatures among pleiotropic genes
A, Distribution of pleiotropism among the LXR/RXR signaling pathway genes. Column 1 shows the gene names and columns 2 to 10 list the traits. The association of a gene with a trait (as identified in genome-wide association study meta-analysis) is indicated with shading (cell value=1) and a lack of association in white (cell value=0). B, Distribution of pleiotropism among genes in the coronary heart disease toxicity signature. Column descriptions are identical to that in (A).BMI indicates body mass index; BP, blood pressure; CAD, coronary artery disease; CRP, C-reactive protein; HDL-C, high-density lipoprotein cholesterol; LDL-C, low-density lipoprotein cholesterol; T2DM, type 2 diabetes mellitus; TC, total cholesterol; and TG, triglycerides.
Figure 3
Figure 3. Interaction networks underlying pleiotropic genes
A, Interaction networks underlying pleiotropic genes. The ReactomeFI tool was used to identify interaction networks enriched for the pleiotropic genes. Genes are colored according to their trait-association status, described in the legend. Query genes are shown as circles, whereas linker genes are shown as squares. The edges connecting the genes (lines, dashed lines, and arrows) represent the different types of interactions among the genes. The interactions involving HPR and APOA1 and TCF7L2, CREBBP, and VEGFA are highlighted in red. B, Statistically significant protein–protein interaction (PPI) network of direct interactions. Genes are color-coded according to their pleiotropy. Statistical significance was ascertained by permutation testing of the InWeb PPI network, as described in the text.
Figure 4
Figure 4. Analysis of potential regulatory functions of single nucleotide polymorphisms (SNPs) located in pleiotropic regions
A, Pie chart based on all SNPs (genome-wide association study+linkage disequilibrium). Pie chart showing the distribution of different regulatory features among the selected SNPs. The name of each regulatory feature is indicated, followed by the number of SNPs associated with that feature (some SNPs are associated with multiple features). B, Enrichment of enhancers and DNAse hypersensitive sites among pleiotropic SNPs. Analysis for enrichment of enhancers and DNAse hypersensitive sites among SNPs in different cell models used by the ENCODE (Encyclopedia of DNA Elements) project. Column 1, name of cell line; column 2, description of cell line; column 3, observed number of regulatory features; column 4, number expected by chance; column 5, fold-enrichment of observed/expected; column 6, significance of enrichment P value; and column 7, type of regulatory feature.

References

    1. Lozano R, Naghavi M, Foreman K, et al. Global and regional mortality from 235 causes of death for 20 age groups in 1990 and 2010: a systematic analysis for the Global Burden of Disease Study 2010. Lancet. 2012;380:2095–2128. doi: 10.1016/S0140-6736(12)61728-0. - DOI - PMC - PubMed
    1. Ajani UA, Ford ES, Mokdad AH. Prevalence of high C-reactive protein in persons with serum lipid concentrations within recommended values. Clin Chem. 2004;50:1618–1622. doi: 10.1373/clinchem.2004.036004. - DOI - PubMed
    1. Physical Activity Guidelines Advisory Committee. Physical Activity Guidelines Advisory Committee Report, 2008. Washington, DC: U.S. Department of Health and Human Services; 2008. - PubMed
    1. Bouchard C, Perusse L. Genetics of causes and manifestations of the metabolic syndrome. In: Crepaldi G, editor. 6th European Symposium on Metabolism: The Plurimetabolic Syndrome. Amsterdam, The Netherlands: Elsevier Science Publishers; 1994.
    1. Nelson TL, Vogler GP, Pedersen NL, Hong Y, Miles TP. Genetic and environmental influences on body fat distribution, fasting insulin levels and CVD: are the influences shared? Twin Res. 2000;3:43–50. - PubMed

Publication types

MeSH terms