

doi: 10.1016/j.ccep.2014.11.013.
Electrocardiographic imaging of heart rhythm disorders: from bench to bedside
Affiliations
- PMID: 25722753
- PMCID: PMC4337422
- DOI: 10.1016/j.ccep.2014.11.013
Item in Clipboard
Electrocardiographic imaging of heart rhythm disorders: from bench to bedside
Card Electrophysiol Clin.
2015 Mar.
Abstract
Noninvasive electrocardiographic imaging (ECGI; also called ECG mapping) can reconstruct potentials, electrograms, activation sequences, and repolarization patterns on the epicardial surface of the heart with high resolution. ECGI can possibly be used to quantify synchrony, identify potential responders/nonresponders to cardiac resynchronization therapy, and guide electrode placement for effective resynchronization therapy. This article provides a brief description of the ECGI procedure and selected previously published examples of its application in important clinical conditions, including heart failure, cardiac resynchronization therapy, atrial arrhythmias, and ventricular tachycardia.
Figures
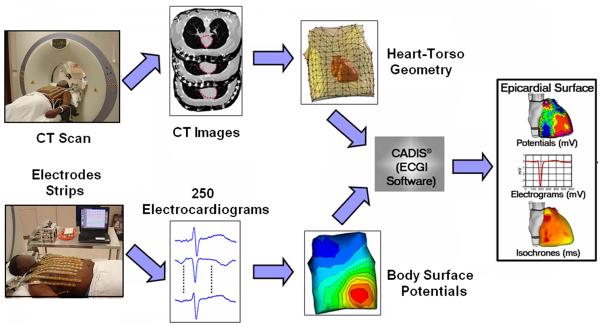
The ECGI procedure. Bottom: recording the body surface electric data with
250 electrodes. Top: obtaining the geometric data using CT. The ECGI software
algorithms combine the electric and geometric data to produce maps of potentials,
electrograms, activation and repolarization on the epicardial surface of the heart.
(Adapted from Ramanathan C, Ghanem RN, Jia P, Ryu K, Rudy Y. Noninvasive
electrocardiographic imaging for cardiac electrophysiology and arrhythmia. Nat Med.
2004;10:422–428; with permission.)
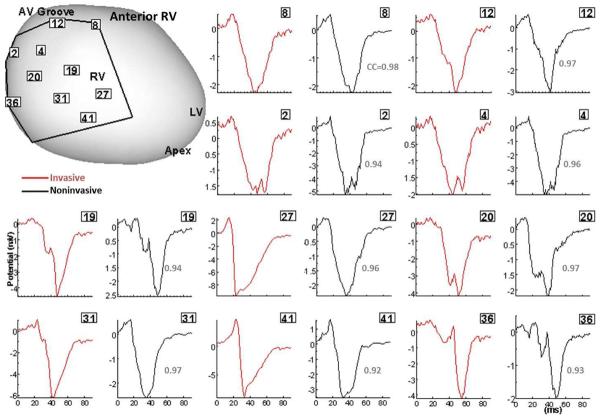
Validation of ECGI in patients undergoing intraoperative cardiac mapping (sinus rhythm).
Invasive (red) and noninvasive ECGI reconstructed (black) QRS epicardial electrograms from
corresponding positions on anterior RV (framed numbers) are shown side by side.
Correlation coefficients (CC) are provided for each pair. The intraoperative recording
patch boundaries and electrode positions are marked on the heart image. Similar results
were obtained for posterior LV. RV, right ventricle; LV, left ventricle; LAD, left
anterior descending coronary artery; AV, atrialventricular. (From Ghanem RN, Jia P,
Ramanathan C, Ryu K, Markowitz A, Rudy Y. Noninvasive Electrocardiographic Imaging (ECGI):
comparison to intraoperative mapping in patients. Heart Rhythm. 2005;2:339–354;
with permission.)
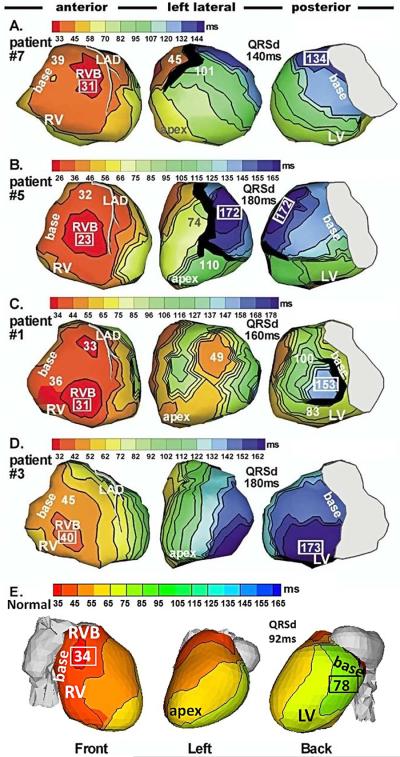
Epicardial activation maps of native rhythm in four representative HF patients (A to D)
and in a normal heart (E). Three views are shown for each heart, as indicated at the
bottom. Thick black lines indicate conduction block. All HF maps show sequential
activation of right ventricle (RV) followed by greatly delayed left ventricular (LV)
activation (left bundle branch block, LBBB pattern). RV activation is normal in all
patients. LV activation patterns vary among patients; importantly, there is wide variation
in the region of latest LV activation. Normal activation (panel E) is highly synchronized,
without conduction delays or block. Numbers indicate activation times (from QRS onset) in
milliseconds. Earliest and latest ventricular activation times are indicated by framed
numbers. RVB, right ventricular epicardial breakthrough; QRSd = QRS duration (Adapted from
Jia P, Ramanathan C, Ghanem RN, Ryu K, Varma N, Rudy Y. Electrocardiographic imaging of
cardiac resynchronization therapy in heart failure: observations of variable
electrophysiologic responses. Heart Rhythm.2006;3:296–310; with permission.)
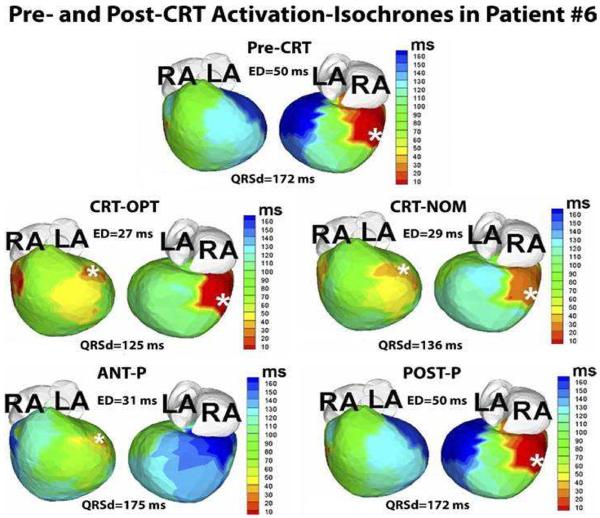
Guidance of lead placement with ECGI. Activation maps for 5 pacing regimes (Pre-CRT,
CRT-OPT, CRT-NOM, ANT-P, POST-P) are shown in 2 views, anterior (left) and inferior
(right). This patient is an 8-year-old male with hypoplastic left heart syndrome, mitral
atresia, and double outlet right ventricle who had a DDD epicardial pacemaker implanted at
the age of 3 months for postoperative complete heart block. The pacing lead was placed in
a right posterior area (white asterisk, pre-CRT panel). At 4 years of age, he had a
fenestrated extra-cardiac Fontan operation. Over the following several years he developed
worsening HF. His pre-CRT activation map (top panel) showed a severely elevated electrical
dyssynchrony (ED) index (ED = 50ms; text for ED definition), with severely delayed
activation of the left anterior basal and inferior basal areas of the ventricle (dark
blue, pre-CRT). These areas were designated as suitable sites for the resynchronization
lead. The patient underwent surgical implant of an epicardial lead at the left anterior
basal area. Repeated ECGI 3 months after implant showed a dramatically improved synchrony
during optimal BiV pacing, with ED dropping to the normal range (ED = 27ms; CRT-OPT);
improvement with nominal BiV pacing(without optimization of inter-ventricular pacing
delay) was slightly less (ED = 29ms; CRT-NOM). LA, left atrium; RA, right atrium; ANT-P,
anterior lead pacing only; POST-P, posterior lead pacing only. White asterisks denote
sites of pacing leads. (From Silva JN, Ghosh S, Bowman TM, Rhee EK, Woodard PK, Rudy Y.
Cardiac Resynchronization Therapy in Pediatric Congenital heart Disease: Insights from
Noninvasive Electrocardiographic Imaging. Heart Rhythm 2009;6:1178–1185; with
permission.)
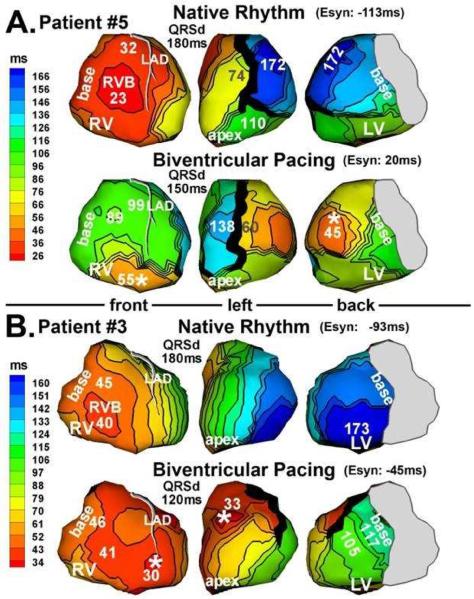
Activation maps from 2 patients (panel A and panel B) who responded to CRT. Native rhythm
(top) and BiV pacing (bottom) maps are shown for each patient. Format is similar to that
in Figure 3. Pacing sites are marked by asterisks.
(From Jia P, Ramanathan C, Ghanem RN, Ryu K, Varma N, Rudy Y. Electrocardiographic imaging
of cardiac resynchronization therapy in heart failure: observations of variable
electrophysiologic responses. Heart Rhythm.2006;3:296–310; with permission.)
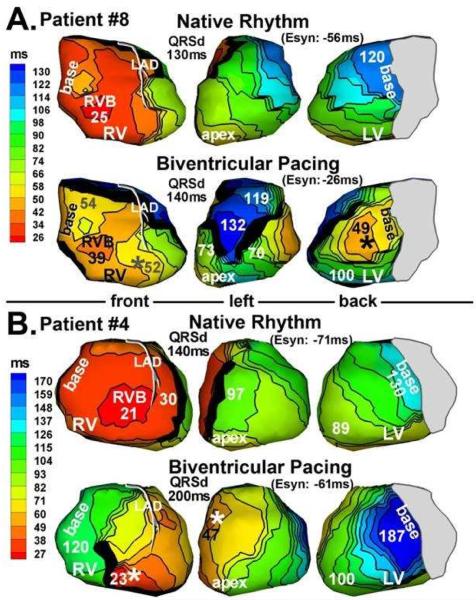
Activation maps from 2 patients (panel A and panel B) who did not respond to CRT. Native
rhythm (top) and BiV pacing (bottom) maps are shown for each patient. Format is similar to
that in Figure 3. Pacing sites are marked by
asterisks. (From Jia P, Ramanathan C, Ghanem RN, Ryu K, Varma N, Rudy Y.
Electrocardiographic imaging of cardiac resynchronization therapy in heart failure:
observations of variable electrophysiologic responses. Heart Rhythm.2006;3:296–310;
with permission.)
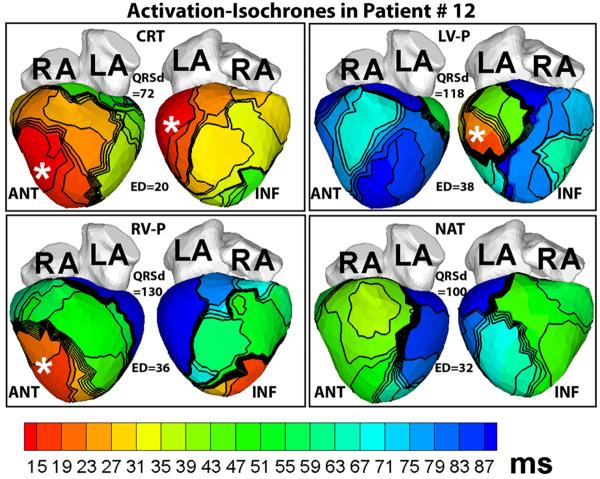
Activation maps in a patient who had a normal QRSd despite LBBB pattern before implant.
Note the large electrical dyssynchrony (ED = 32ms) in the native rhythm (NAT panel) in
spite of a normal QRS duration (QRSd = 100ms). Cardiac resynchronization therapy (CRT
panel) restored electrical synchrony (ED = 20ms) in the normal range. Pacing sites are
indicated by asterisks. Each panel shows anterior (ANT, left) and inferior (INF, right)
four-chamber views. RV-P and LV-P indicate RV pacing only or LV pacing only, respectively.
(From Ghosh S, Silva JN, Canham RM, et al. Electrophysiologic substrate and
intra¬ventricular left ventricular dyssynchrony in nonischemic heart failure
patients undergoing cardiac resynchronization therapy. Heart Rhythm 2011;8:692–699;
with permission.)
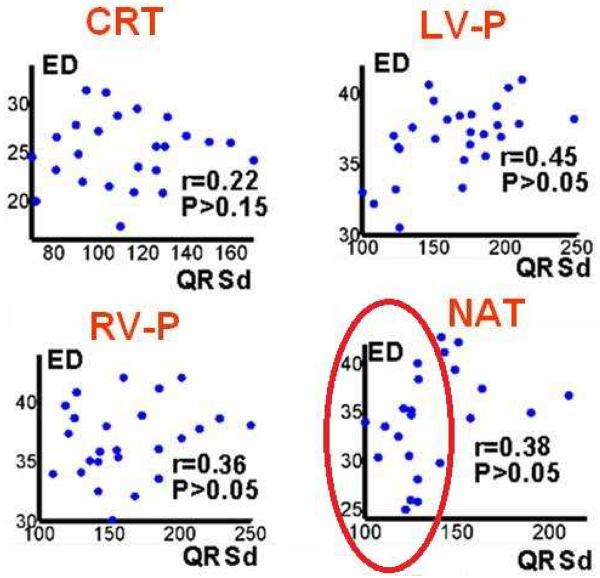
Scatter plots of electrical dyssynchrony (ED) versus QRSd for CRT rhythm; left
ventricular paced rhythm (LV-P); right ventricular paced rhythm (RV- P); and native sinus
rhythm (NAT). r is Pearson correlation coefficient; P<0.05 is considered
significant correlation. (From Ghosh S, Silva JN, Canham RM, et al. Electrophysiologic
substrate and intra¬ventricular left ventricular dyssynchrony in nonischemic heart
failure patients undergoing cardiac resynchronization therapy. Heart Rhythm
2011;8:692–699; with permission.)
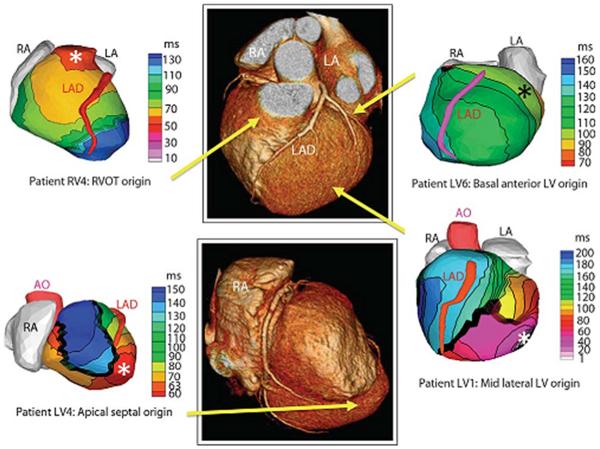
Examples of noninvasive ECGI isochrones maps for localization of VT site of origin.
Epicardial isochrone maps are shown for four patients with earliest epicardial activation
marked with an asterisk. EP study-determined sites of origin are indicated under the ECGI
maps. Yellow arrows point to VT origin on a representative CT scan. RA, right atrium; LA,
left atrium; AO, aorta; LAD, left anterior descending coronary artery; LV, left ventricle:
RVOT, right ventricular outflow tract. (From Wang Y, Cuculich PS, Zhang J, Desouza KA,
Vijayakumar R, Chen J, Faddis MN, Lindsay BD, Smith TW, Rudy Y. Noninvasive
electroanatomic mapping of human ventricular arrhythmias with electrocardiographic imaging
(ECGI). Science Transl Med 2011;3:1–10; with permisson.)
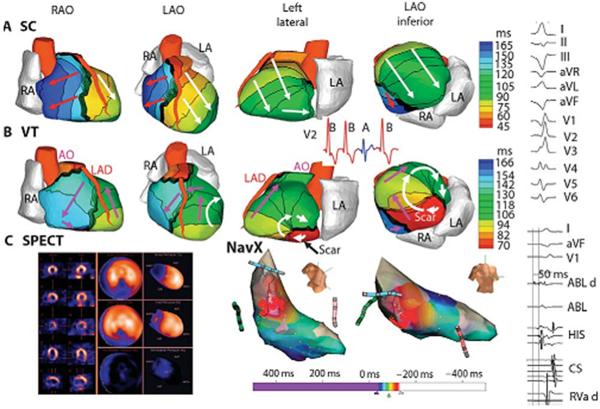
Example of ECGI reentrant VT from inferobasal scar. (A) Four views of
activation sequence during a sinus capture (SC) beat (blue on the V2 ECG). Arrows indicate
direction of the activation wavefronts. (B) Activation sequence during VT
beats (red on the V2 ECG). White arrows indicate a clockwise lateral loop (left lateral
and left anterior oblique inferior views); purple arrows show propogation into the RV in a
counterclockwise fasshion. (C) (left) SPECT images showing a scar at the
inferobasal LV region (blue). (Right) Limited invasive endocardial map of VT activation
(red, early;blue late). (Right column) (Top) Twelve-lead surface ECG during VT. (Lower)
Ablation catheter signals. The earliest electrogram signal is seen at the inferoseptal
border zone, 50 ms before the onset of the surface QRS. ABL d, bipolar electrogram at the
distal ablation catheter; HIS, AV junction/His bundle; CS, coronary sinus; RVa d, right
ventricular apex. (From Wang Y, Cuculich PS, Zhang J, Desouza KA, Vijayakumar R, Chen J,
Faddis MN, Lindsay BD, Smith TW, Rudy Y. Noninvasive electroanatomic mapping of human
ventricular arrhythmias with electrocardiographic imaging (ECGI). Science Transl Med
2011;3:1–10; with permisson.)
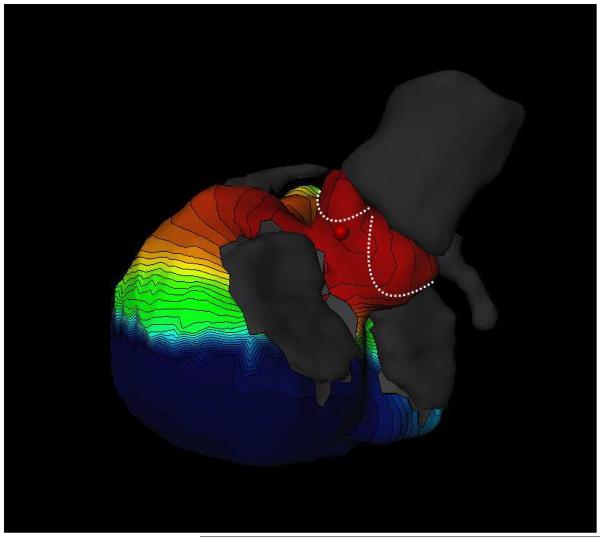
Focal ventricular ectopy. Noninvasive electocardiographic mapping demonstrating early
activation from the region of the aortic cusps. (Courtesy of Meleze Hocini, Bordeaux,
France.)
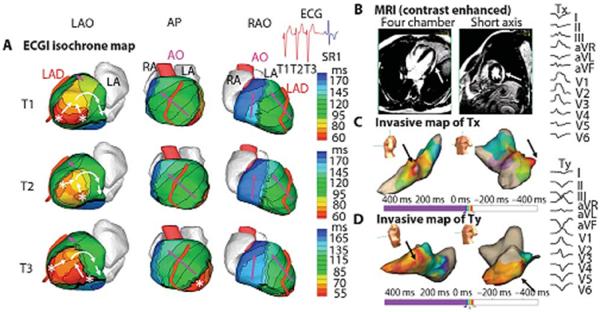
Example of ECGI of reentrant VT in LV lateral wall in infiltrative cardiomyopathy.
(A). ECGI isochrone map. Activation patterns for three consecutive VT beats
(T1, T2, and T3). ECGI identified two distinct areas of early epicardial activation (white
asterisks), which differered from beat to beat. The propagation pattern varied somewhat
depending on the relative contribution of the two sources, but for all beats, the
wavefront turned clockwise and propagated to the LV lateral base with a high degree of
curvature, where it reached a line of block in the infero-lateral base. (B) A
gadolinium-enhanced MRI revealed a patch of myocardial enhancement in the lateral LV
(white arrows), consistent with focal myocarditis or cardiac sarcoid. (C)
Invasive electroanatomic map created during the presenting VT (arbitrarily named Tx). The
region of earliest activation is shown by black arrows. (D) Invasive electroanatomic map
created during a different VT (arbitrarily named Ty) after initial ablation at the site of
earliest activation. The earliest activation (black arrows) is shifted more apically.
(Right) Twelve-lead ECGs of two VT morphologies (Tx and Ty). AP, anterior-posterior view;
SR1, first sinus rhythm beat after VT. (From Wang Y, Cuculich PS, Zhang J, et al.
Noninvasive electroanatomic mapping of human ventricular arrhythmias with
electrocardiographic imaging (ECGI). Science Transl Med 2011;3:1–10; with
permisson).
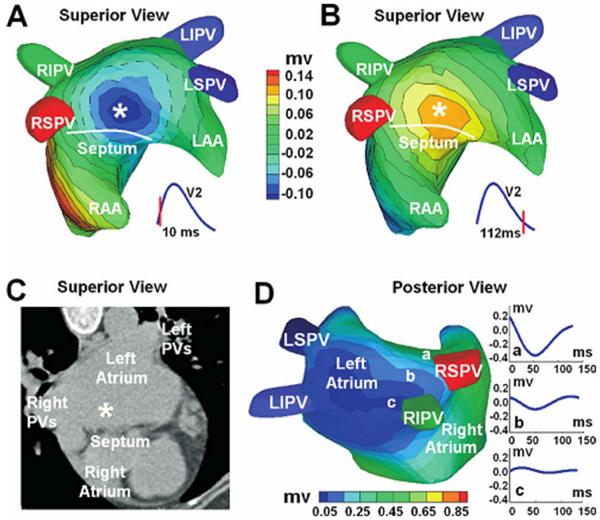
ECGI three-dimensional voltage and electrogram maps of focal atrial tachycardia (AT).
A and B: Atrial epicardial potential maps at 10 and 112 ms after the onset
of the surface P wave. Panel A captures the epicardial breatkthrough pattern during
activation, and panel B shows the repolarization pattern with reverse polarity. The
white asterisk indicates the site of earliest activation as predicted
by ECGI. Panel C shows the ECGI-determined earliest activation site (white
asterisk) on a CT image of the atria. Panel D is an electrogram magnitude map
(peak-to-peak) reconstructed by ECGI (posterior view). The dark
blue represents a region of low-magnitude electrograms, indicating a scar
region. Three electrograms selected from a nonscar region (a) and from the scar region (b,
c) are shown. Location of the low-magnitude electrograms is consistent with prior PV
isolations and left atrial substrate modification. RIPV = right inferior PV; LIPV = left
inferior PV; RSPV = right superior PV; LSPV = superior PV; LAA = left atrial appendage;
RAA = right atrial appendage. (From Wang Y, Cuculich PS, Woodard PK, et al. Focal atrial
tachycardia after pulmonary vein isolation: noninvasive mapping with electrocardiographic
imaging (ECGI). Heart Rhythm 2007;4:1082–1084; with permisson.)
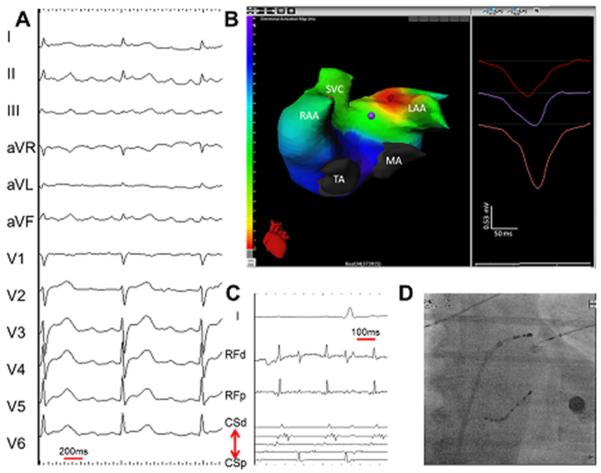
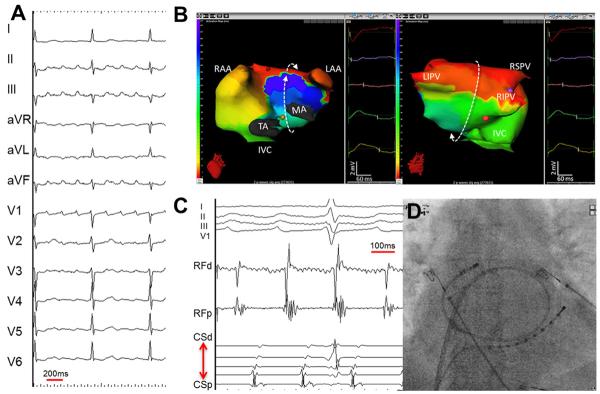
Focal left atrial tachycardia. (A) A 12-lead electrocardiogarm of clinical tachycardia.
(B) an ishochronal activation electrocardiomap of a basal left atrial appendage source
centrifugal AT. The morphology of the virtual unipolar electrogram at the source displays
typical QS morphology. (C) Intracardiac electrograms from the lateral left atrium and
coronary sius recorded during ablation of the left atrial source centrifugal AT. (D)
Postero-anterior fluoroscopic image showing the location of intracardiac catheters. LAA =
left atrial apendage; MA = mitral annulus; RAA = right atrial appendage; SVC = superior
vena cava; TA = tricuspid annulus. (From Shah AJ, Hocini M, Xhaet O, et al. Validation of
novel 3-dimensional eletrocardiographic mapping of atrial tachycardias. Invasive mapping
and ablation. A multicenter study. J Am Coll Cardiol 2013:62-889-97; with permisson)
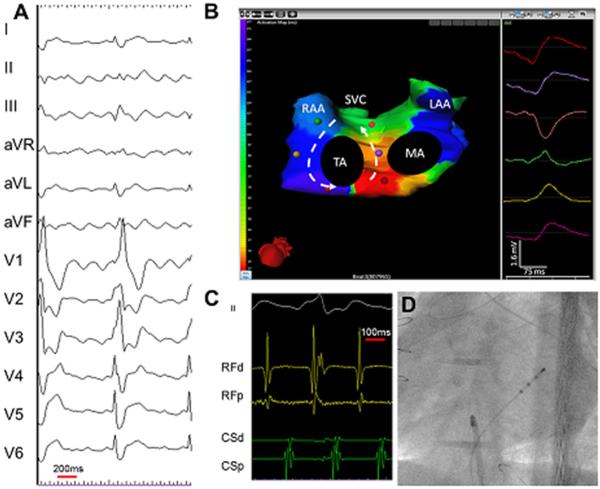
Cavotricuspid isthmus-dependent atrial tachycardia. (A) A 12- lead electrocardiogram of
clinical tachycardia from a patient who previously underwent extensive ablation for atrial
fibrillation. (B) An isochronal activation electrocardiomap of counterclockwise
cavotricuspid isthmus-dependent atrial tachycardia (AT). Typically, the interatrial groove
is activated from below upward followed by sequential activation of the right atrial free
wall from above downward. The left atrial breakthroughs at the coronary sinus and the
Bachman bundle result in septal-to-lateral activation of the anterior and posterior left
atrium. The morphology of the virtual unipolar electrograms displayed from atrial sites
distributed around the tricuspid annulus concurs with this activation pattern. The color
of the unipolar electrogram corresponds to the color of the spot marked on the biatrial
geometry. On the color scale, the earliest activation site is red and the
latest is purple. The color map shows 160 ms of activation. The cycle length
here is 244 ms. The remainder of the cycle length is within the slow conduction zone
(cavotricuspid isthmus), on either side of which purple meets
red. (C) Intracardiac electrograms from the isthmus and coronary sinus
recorded during the ablation of cavotricuspid isthmus-dependent AT. (D) Postero-anterior
fluoroscopic image showing the location of intracardiac catheters. LAA = left atrial
apendage; MA = mitral annulus; RAA = right atrial appendage; SVC = superior vena cava; TA
= tricuspid annulus. (From Shah AJ, Hocini M, Xhaet O, et al. Validation of novel
3-dimensional eletrocardiographic mapping of atrial tachycardias. Invasive mapping and
ablation. A multicenter study. J Am Coll Cardiol 2013:62-889-97; with permisson)
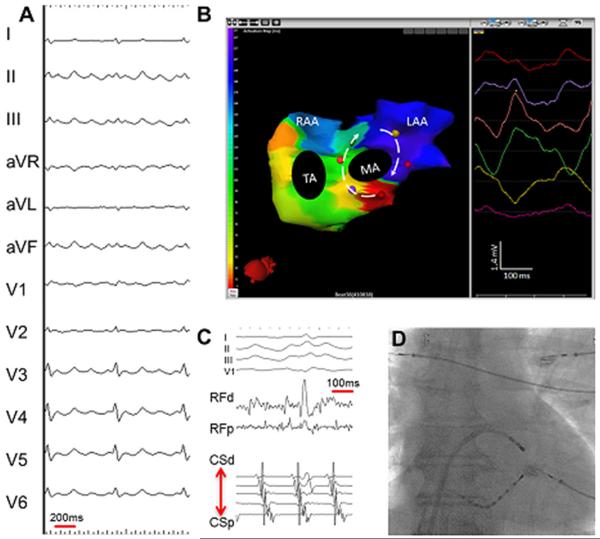
Perimitral AT. (A) A 12-lead electrocardiogram of clinical tachycardia. (B) An isochronal
activation electrocardiomap of clockwise perimitral AT. Typically, the coronary sinus and
contiguous posterior-inferior left atrium are activated from a lateral to septal
direction, and the Bachmann bundle activation proceeds in the opposite direction, covering
almost the entire tacycardia cycle length. The morphology of the virtual unipolar
electrograms displayed from 6 atrial sites distributed around the mitral annlus confirms
the activation pattern. The right atrial free wall is typically activated from above
downard during perimitral AT. The cavotricuspid isthmus is activated laterally (toward the
right atrial free wall) from the septum (coronary sinus ostium level) without substantial
conduction delay confirming the bystander role of the right atrium in perimitral AT. (C)
Intracardiac electrograms from the lateral mitral isthmus and coronary sinus recorded
during the ablation of perimitral AT. (D) Postero-anterior fluoroscopic image showing the
location of intracardiac catheters. LAA = left atrial apendage; MA = mitral annulus; RAA =
right atrial appendage; SVC = superior vena cava; TA = tricuspid annulus. (From Shah AJ,
Hocini M, Xhaet O, et al. Validation of novel 3-dimensional eletrocardiographic mapping of
atrial tachycardias. Invasive mapping and ablation. A multicenter study. J Am Coll Cardiol
2013:62-889-97; with permisson).
Left atrial roof-dependent AT. (A) A 12-lead electrocardiogram of clinical tachycardia.
(B) an ishochronal activation of electrocardiomap of a typical macro-reentrant
roof-dependent AT. The below to upward activation of the anterior wall of the left atrium
is shown on the left and the top to bottom activation of the posterior left atrium is
shown on the right. The bystander right atrial free wall is activated from above downward.
The entire tachycardia cycle length is covered along the AT circuit, and the morphologies
of the virtual unipolar electorgrams displayed from 5 atrial sites distributed along the
trajectory of the macro-rentry concur with this activation pattern (C) intracardiac
electrograms from the left atrial roof and coronary sinus recorded during the ablation of
roof-dependent AT. (D) Postero-anterior fluoroscopic image showing the location of the
intracardiac catheters. LAA = left atrial apendage; MA = mitral annulus; RAA = right
atrial appendage; SVC = superior vena cava; TA = tricuspid annulus. (From Shah AJ, Hocini
M, Xhaet O, et al. Validation of novel 3-dimensional eletrocardiographic mapping of atrial
tachycardias. Invasive mapping and ablation. A multicenter study. J Am Coll Cardiol
2013:62-889-97; with permisson)
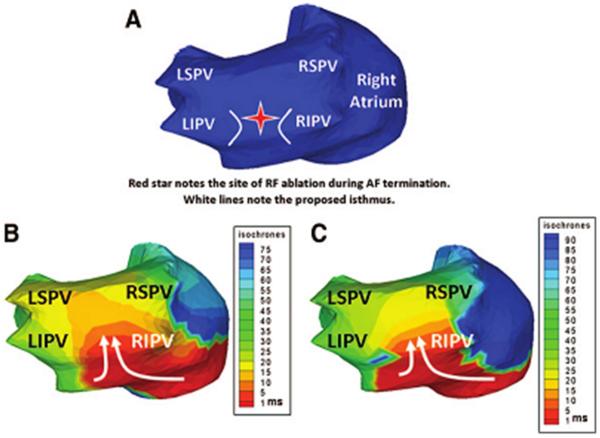
Noninvasive ECGI of AF using a critical isthmus in the posterior LA during AF
radiofrequency ablation. (A) Posterior view of the atria with a red star marking the
location of the ablation that terminated AF. B and C, ECGI ishochrone maps during AF at
two separate time points immediately before successful ablation. For both images a
wavefront enters the posterior LA (white arrows) through a protected isthmus. LSPV
indicates left superior pulmonary vein (PV); LIPV, left inferior PV; RSPV right superior
PV; and RIPV, right inferior PV. (From Cuculich PS, Wang Y, Lindsay BD, et al. Noninvasive
characterization of epicardial activation in humans with diverse atrial fibrillation
patterns. Circulation 2010;122:1364–1372; with permisson)
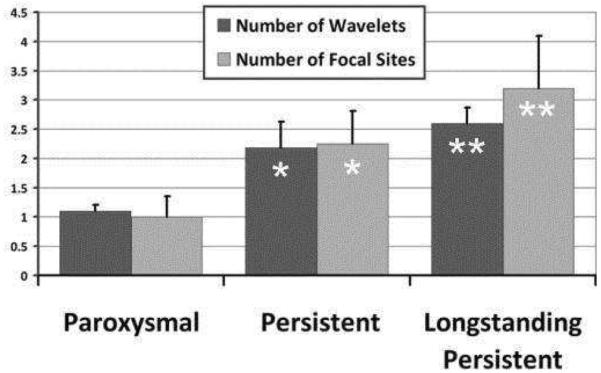
AF complexity. Increasing complexity of AF stratified by clinical classification of
paroxysmal, persistent, and long-standing persistent AF. With increasing AF duration, ECGI
imaged more focal sites and wavelets (ANOVA for wavelet P=0.11; focal sites, P=0.031).
Asterisk denotes P < 0.05 compared to paroxysmal. Double asterisk denotes P
< 0.05 compared to both paroxysmal and persistent. (Adapted from Cuculich PS, Wang
Y, Lindsay BD, et al. Noninvasive characterization of epicardial activation in humans with
diverse atrial fibrillation patterns. Circulation 2010;122:1364–1372; with
permisson).
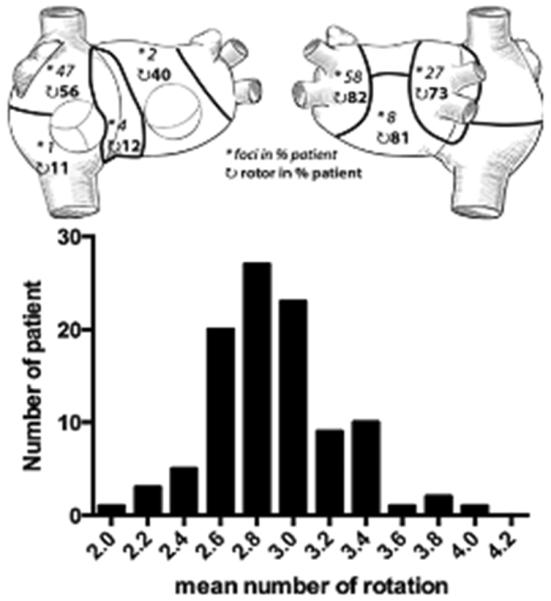
Persistent AF. Top. Distribution of drivers (focal breathroughs, asterisk;
reentry events, curved arrows) in 7 regions is reported as the percentage of patients. For
example, 82% of the 103 patients had repetitive reentries, and 58% had repetitive focal
breakthtroughs in the left pulmonary vein-appendage region. Bottom. Bar
diagram shows the distribution of the mean number of rotations in 103 patients. (From
Haissaguerre M, Hocini M, Denis A, et al. Driver domains in persistent atrial
fibrillation. Circulation 2014:130:530–538; with permisson.)
References
-
- Plonsey R, Barr RC. Bioelectricity—a quantitative approach. 3rd Springer; New York: 2007.
-
- Barr RC, Ramsey M, III, Spach MS. Relating epicardial to body surface potential distributions by means of transfer coefficients based on geometry measurements. IEEE Trans Biomed Eng. 1977;24:1–11. - PubMed
Publication types
MeSH terms
Grants and funding
LinkOut - more resources
Full Text Sources
Other Literature Sources
Medical
