Review
. 2015 Feb 26;160(5):816-827.
doi: 10.1016/j.cell.2015.02.010.

Homeostasis, inflammation, and disease susceptibility

Affiliations
Review

Homeostasis, inflammation, and disease susceptibility

Maya E Kotas et al. Cell. .

Abstract

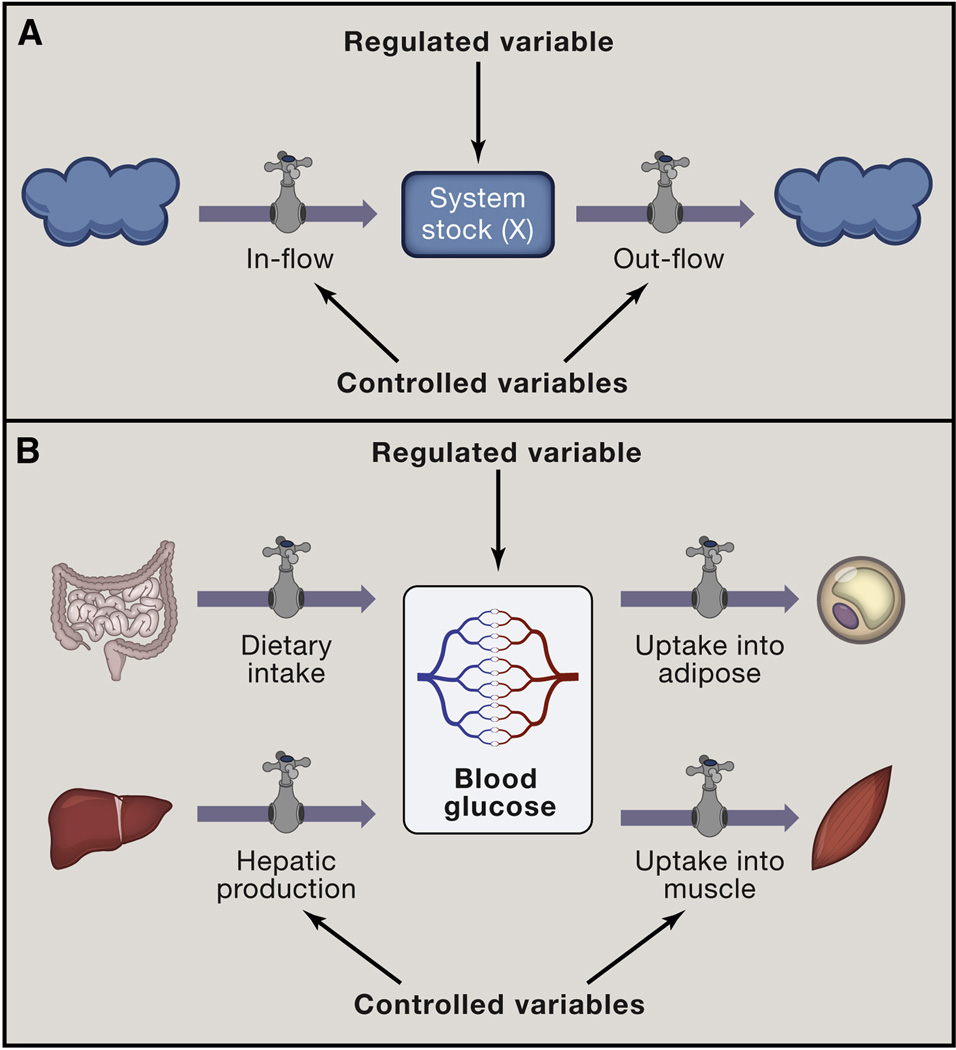
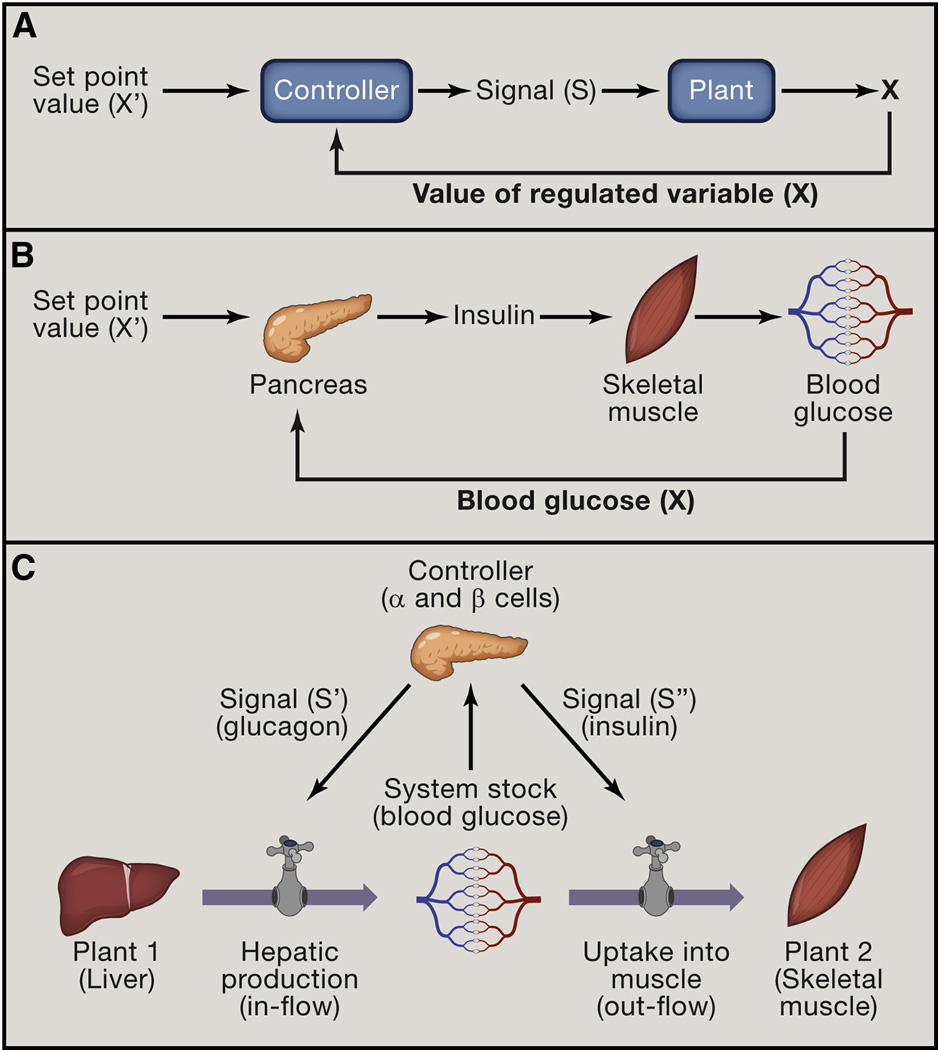
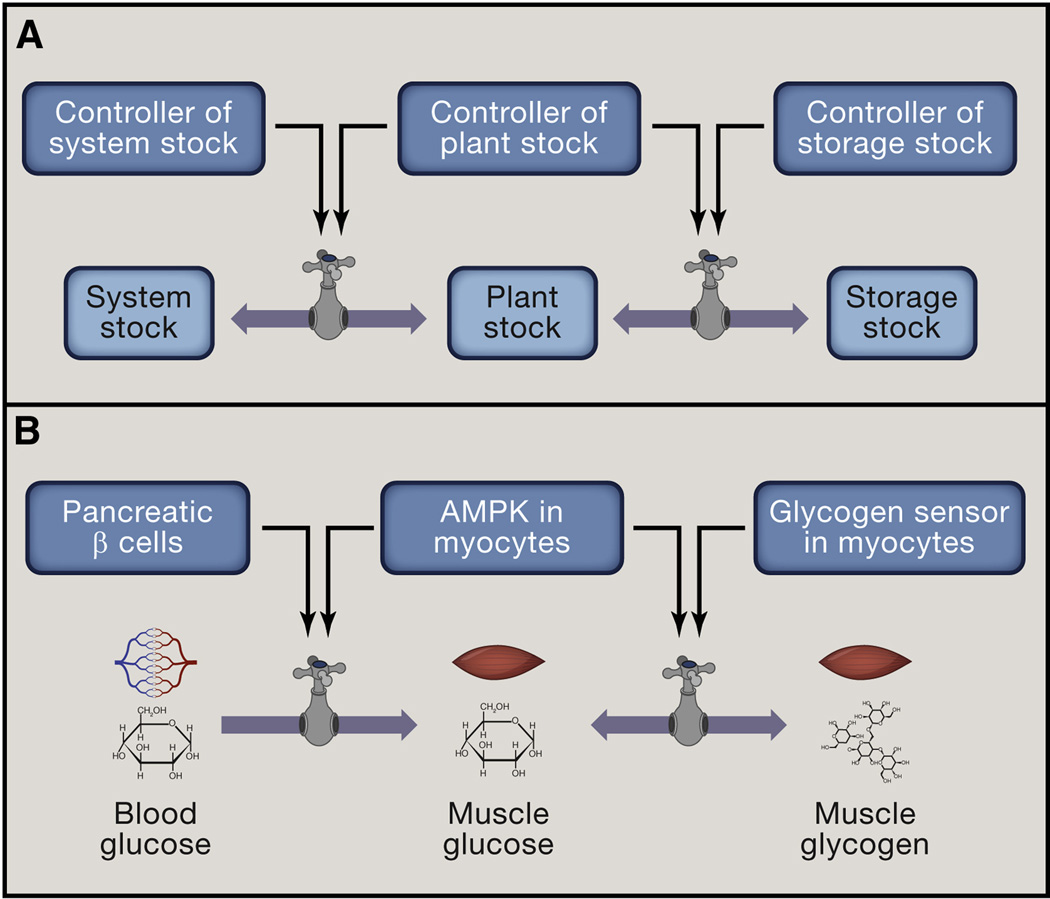
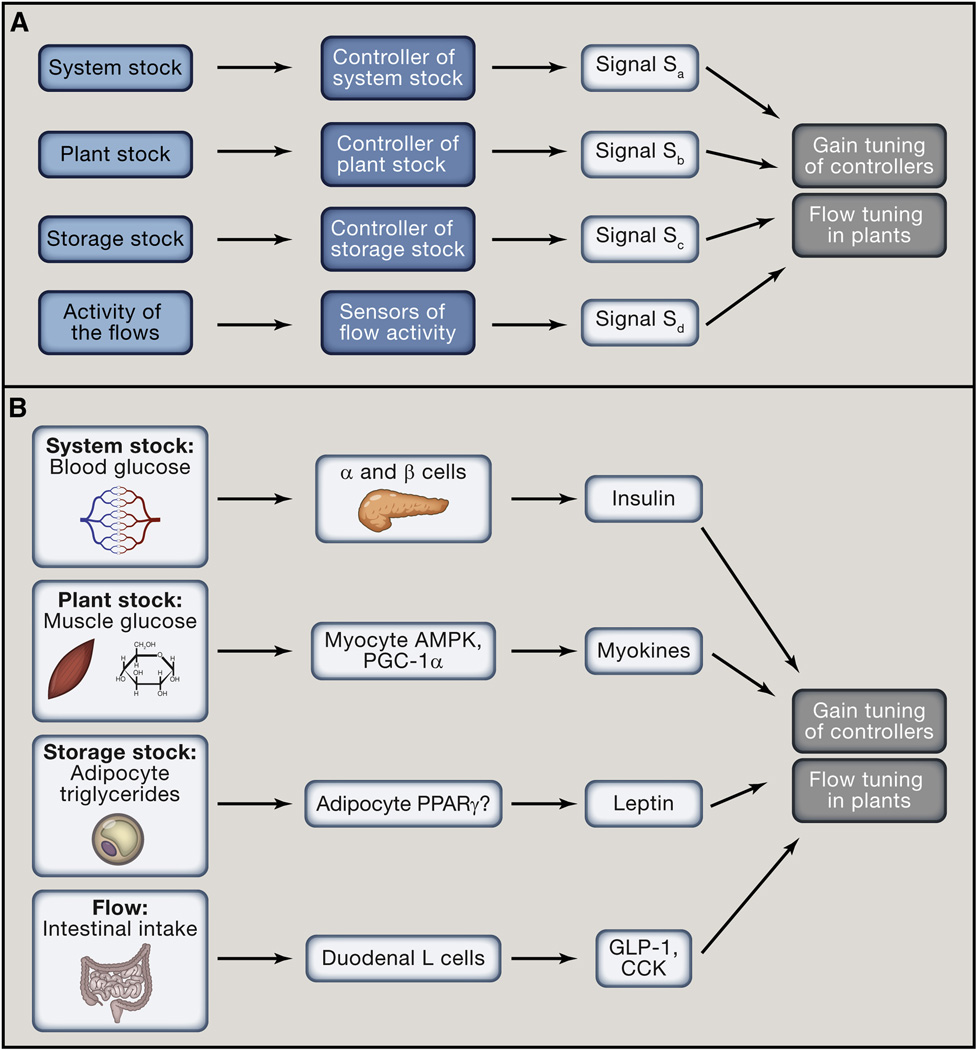
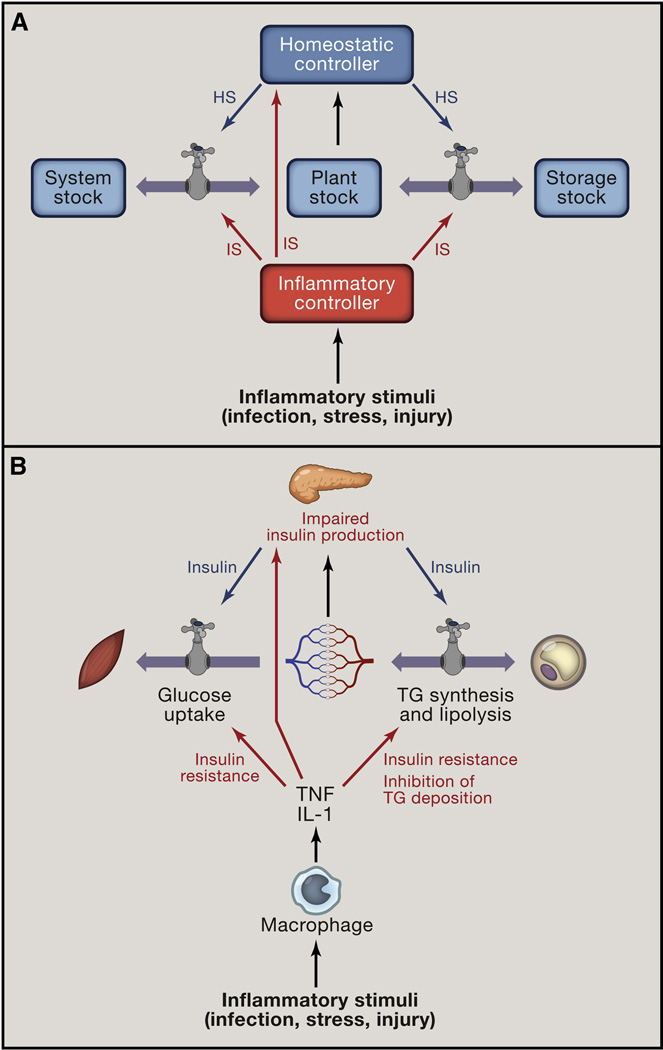
While modernization has dramatically increased lifespan, it has also witnessed the increasing prevalence of diseases such as obesity, hypertension, and type 2 diabetes. Such chronic, acquired diseases result when normal physiologic control goes awry and may thus be viewed as failures of homeostasis. However, while nearly every process in human physiology relies on homeostatic mechanisms for stability, only some have demonstrated vulnerability to dysregulation. Additionally, chronic inflammation is a common accomplice of the diseases of homeostasis, yet the basis for this connection is not fully understood. Here we review the design of homeostatic systems and discuss universal features of control circuits that operate at the cellular, tissue, and organismal levels. We suggest a framework for classification of homeostatic signals that is based on different classes of homeostatic variables they report on. Finally, we discuss how adaptability of homeostatic systems with adjustable set points creates vulnerability to dysregulation and disease. This framework highlights the fundamental parallels between homeostatic and inflammatory control mechanisms and provides a new perspective on the physiological origin of inflammation.


Figures

Figure 1
Figure 1. Stock and flow model of homeostasis
(A) Stock and flow model highlights two types of variables in homeostasis: Stock is quantity of a regulated variable - a parameter that is maintained by homeostasis. Flows are the processes that change the value of the stock. Some, but not all flows are controlled variables and targets for homeostatic control signals (graphically represented here as dials). Clouds represent ‘sources’ and ‘sinks’ for regulated variable that are extrinsic to the homeostatic system. (B) A physiologic example of stock and flow model: dietary glucose uptake, hepatic glucose production, or glucose uptake into adipose and muscle are flows that maintain the stock of blood glucose.
Figure 2
Figure 2. Homeostatic control circuit
(A) Basic homeostatic control circuits have two essential components: Controllers and Plants. Controllers monitor the value of regulated variable (X) and compare it to the reference value (X’). In response to deviation of X from X’, Controllers generate a signal (S) that acts on Plants. Plants are the effectors of the homeostatic systems that change the value of the regulated variable. (B) A physiologic example of control circuit: pancreatic beta cells act as Controller, sensing elevated blood glucose and producing insulin (signal S) to increase glucose uptake into skeletal muscle (Plant). In the simplest model, the output of the Controller (signal S) is proportional to the deviation of regulated variable from the reference value, |X-X’| . The proportionality constant is referred to as the gain. (C) Combining stock and flow modeling with the basic control circuit provides a more complete model of homeostasis. The Controller monitors the value of the Stock and produces signals that act on Plants. Such signals cause Plants to modulate the flows that contribute to the Stock. In this example, glucose sensing by the pancreas (Controller), induces glucagon or insulin secretion (Signals S’ and S’’), which act on liver and muscle (Plants), to control glucose production and uptake, respectively (flows) and stabilize blood glucose (Stock)
Figure 3
Figure 3. Homeostatic units
(A) System stock, Plant stock and Storage stock each represent homeostatic units that are connected by flows. Each of the stocks is monitored by a specialized Controller, which regulates the flows into and out of the stock. Homeostatic system is thus hierarchically organized into ‘nested’ homeostatic units. (B) Physiologic example of nested homeostatic units: System stock (blood glucose) is monitored by System Controller (pancreatic β-cells), Plant stock (glucose in skeletal muscle) is monitored by Plant specific Controller (e.g., AMPK) and Storage stock (muscle glycogen) is presumably monitored by a glycogen sensor, which is currently unknown. Each of the Controllers regulates the flows into and out of the corresponding stock.
Figure 4
Figure 4. Four classes of signals control systemic homeostasis
(A) Four classes of homeostatic signals report on values of four different types of variables: System stock (regulated variable), Plant stock, Storage stock and Flows. Each stock and the flows are monitored by dedicated Controllers and sensors. All four categories of homeostatic signals modulate gain tuning of Controllers and flow tuning in Plants. Signals that report on stocks operate in feed-back loops. Signals that report on flows operate in feed-forward loops. (B) Signals reporting on the System stock (Sa) are classical endocrine hormones and efferents of the autonomic nervous system (e.g., insulin and glucagon). Signals reporting on Plant stocks (Sb) primarily operate in a cell or tissue autonomous manner (e.g., AMPK controlling GLUT4 expression), but may include signals acting systemically (e.g., AMPK controlling IL-6 expression in exercising muscle). Signals reporting on Storage stocks (Sc) indicate available resources (e.g., leptin reporting on fat stores). Finally, signals reporting on Flows (Sd) indicate anticipated changes in the System stock (e.g., GLP-1 reporting on incoming glucose). The examples are chosen to illustrate the point.
Figure 5
Figure 5. Inflammatory signals and homeostasis
(A) Inflammatory signals (IS) act through the same control points (Plants flows and Controller gains) as homeostatic signals (HS). To illustrate the parallels between homeostatic and inflammatory signals, the source of inflammatory signal is referred to as Inflammatory Controller (e.g., macrophage), by analogy to Homeostatic Controller (e.g., endocrine pancreas). (B) Macrophages produce TNF and IL-1 which act on the same flows as insulin, but in opposite direction: TNF and IL-1 induce insulin resistance and suppress lipid storage in adipose tissue by inhibiting lipoprotein lipase. In addition, these cytokines induce gain tuning of the pancreatic β-cells to reduce the amount of insulin produced in response to a given level of blood glucose. This effect is achieved in part by suppressing glucose flow into β-cells.

Similar articles

Cited by

References

    1. Åström KJ, Murray RM. Feedback systems: an introduction for scientists and engineers. Princeton: Princeton University Press; 2008.
    1. Badman MK, Pissios P, Kennedy AR, Koukos G, Flier JS, Maratos-Flier E. Hepatic fibroblast growth factor 21 is regulated by PPARalpha and is a key mediator of hepatic lipid metabolism in ketotic states. Cell metabolism. 2007;5:426–437. - PubMed
    1. Barnes BM. Freeze avoidance in a mammal: body temperatures below 0 degree C in an Arctic hibernator. Science. 1989;244:1593–1595. - PubMed
    1. Bateson P, Barker D, Clutton-Brock T, Deb D, D'Udine B, Foley RA, Gluckman P, Godfrey K, Kirkwood T, Lahr MM, et al. Developmental plasticity and human health. Nature. 2004;430:419–421. - PubMed
    1. Bernard C. Paris: J. B. Baillière et fils; 1878. Leçons sur les phénomènes de la vie communs aux animaux et aux végétaux.

Publication types