. 2015 Feb 27;10(2):e0116921.
doi: 10.1371/journal.pone.0116921. eCollection 2015.

Investigating the cellular distribution and interactions of HIV-1 nucleocapsid protein by quantitative fluorescence microscopy

Affiliations

Investigating the cellular distribution and interactions of HIV-1 nucleocapsid protein by quantitative fluorescence microscopy

Halina Anton et al. PLoS One. .

Abstract

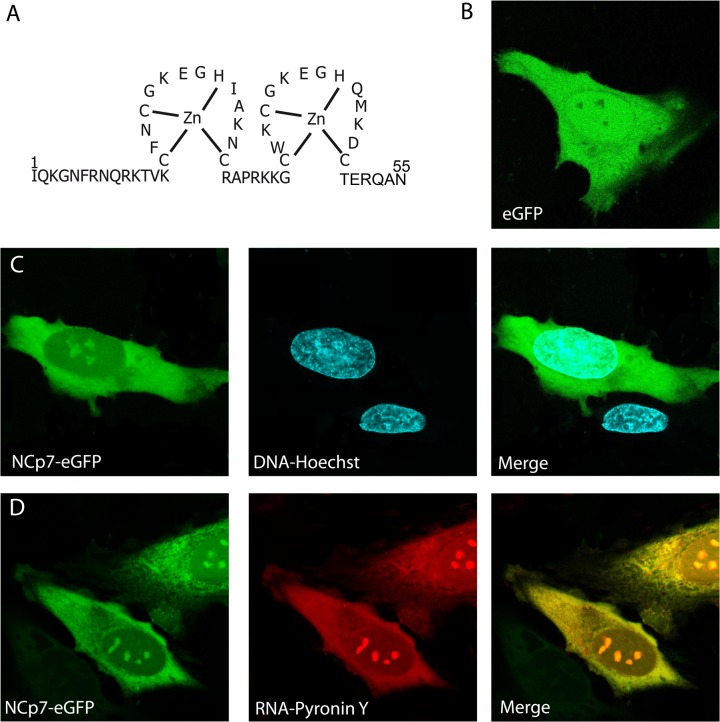
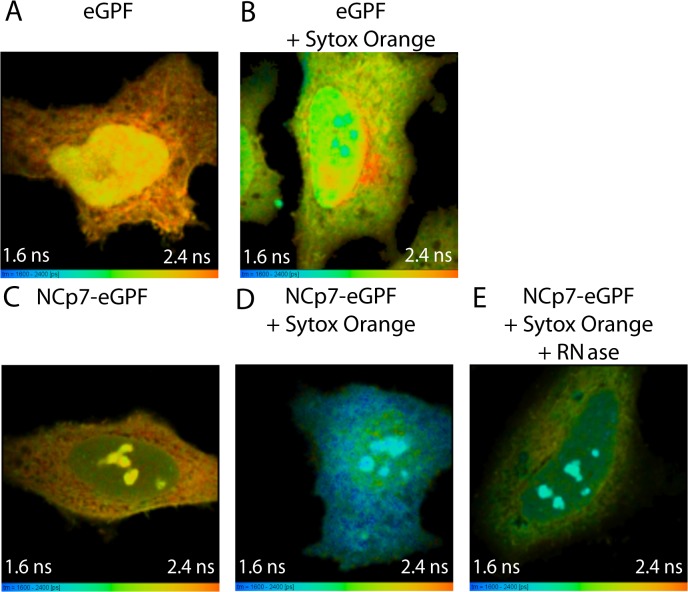
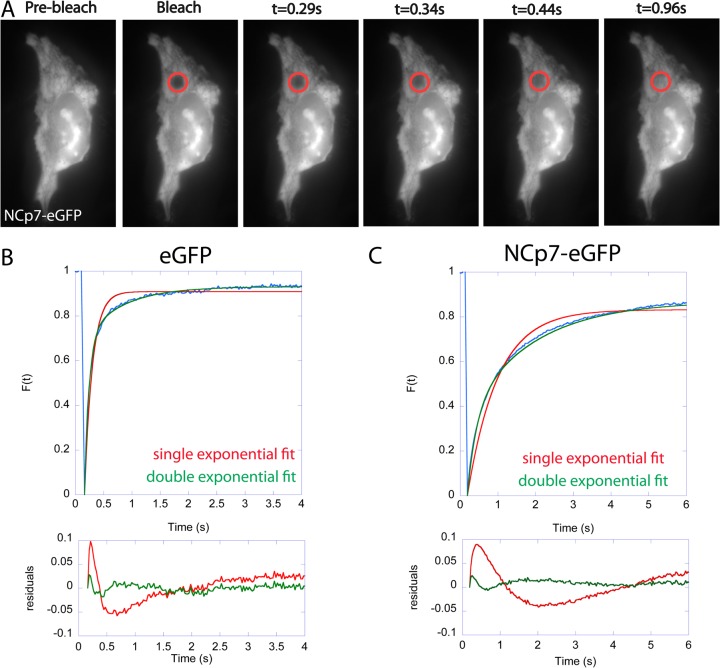
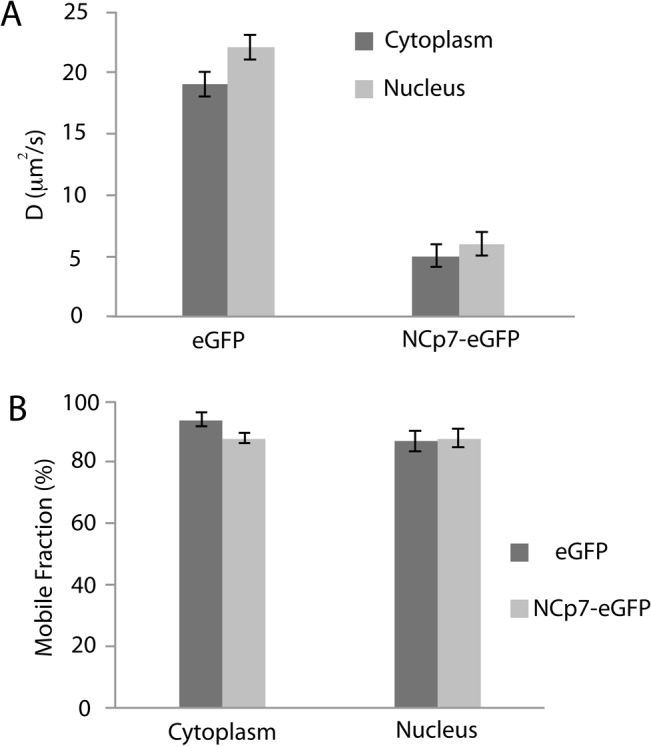
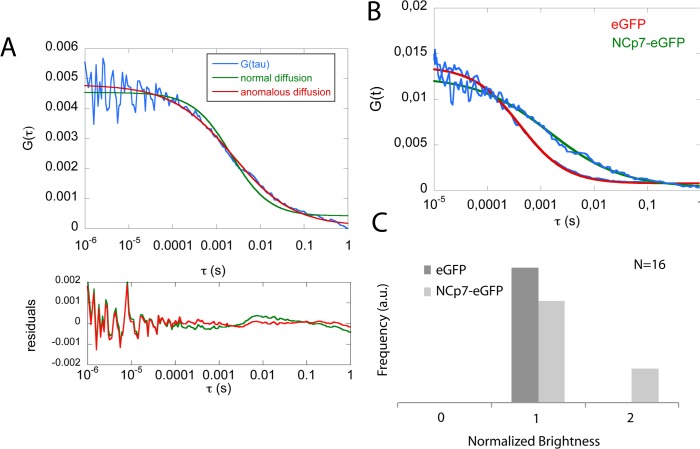
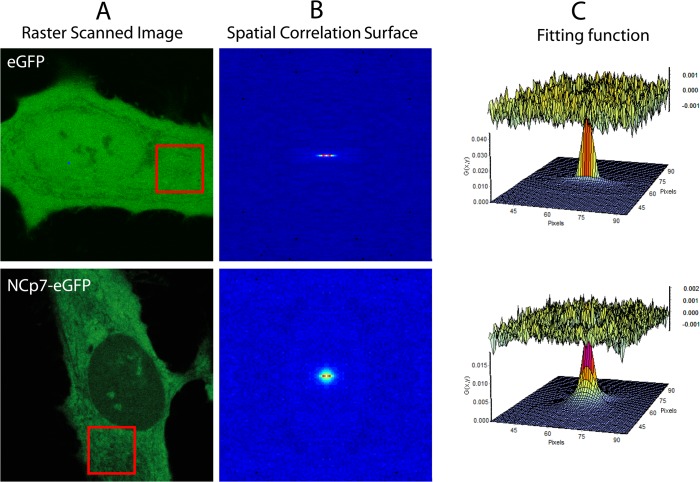
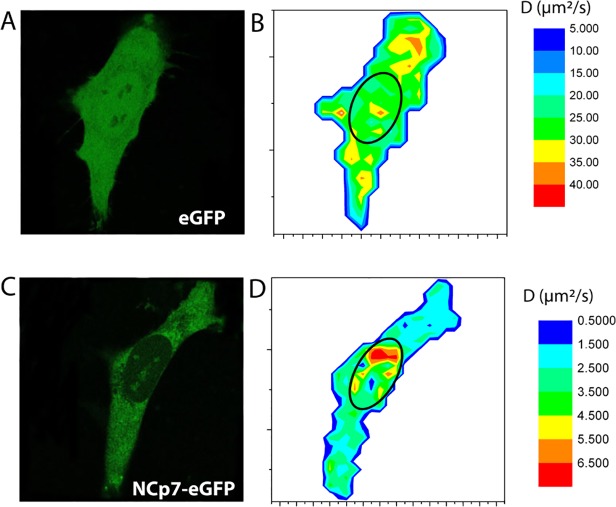
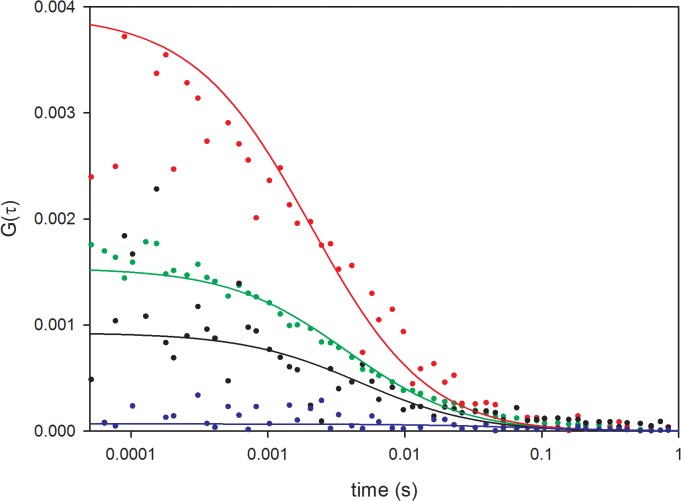
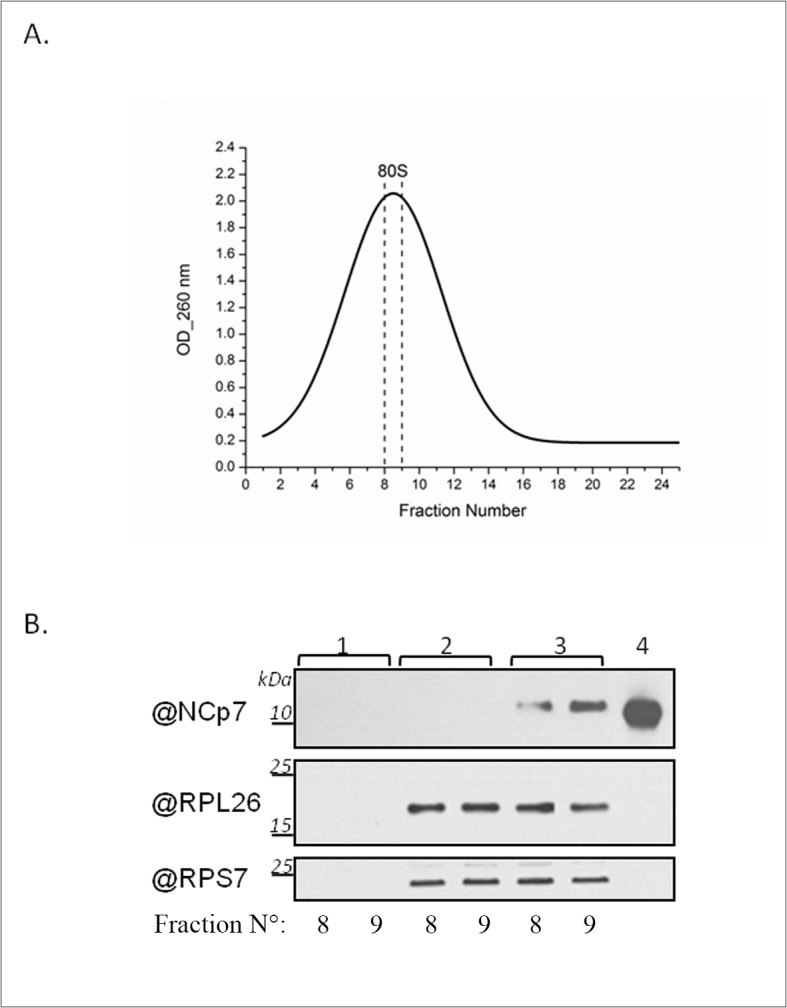
The nucleocapsid protein (NCp7) of the Human immunodeficiency virus type 1 (HIV-1) is a small basic protein containing two zinc fingers. About 2000 NCp7 molecules coat the genomic RNA in the HIV-1 virion. After infection of a target cell, the viral core enters into the cytoplasm, where NCp7 chaperones the reverse transcription of the genomic RNA into the proviral DNA. As a consequence of their much lower affinity for double-stranded DNA as compared to single-stranded RNAs, NCp7 molecules are thought to be released in the cytoplasm and the nucleus of infected cells in the late steps of reverse transcription. Yet, little is known on the cellular distribution of the released NCp7 molecules and on their possible interactions with cell components. Hence, the aim of this study was to identify potential cellular partners of NCp7 and to monitor its intracellular distribution and dynamics by means of confocal fluorescence microscopy, fluorescence lifetime imaging microscopy, fluorescence recovery after photobleaching, fluorescence correlation and cross-correlation spectroscopy, and raster imaging correlation spectroscopy. HeLa cells transfected with eGFP-labeled NCp7 were used as a model system. We found that NCp7-eGFP localizes mainly in the cytoplasm and the nucleoli, where it binds to cellular RNAs, and notably to ribosomal RNAs which are the most abundant. The binding of NCp7 to ribosomes was further substantiated by the intracellular co-diffusion of NCp7 with the ribosomal protein 26, a component of the large ribosomal subunit. Finally, gradient centrifugation experiments demonstrate a direct association of NCp7 with purified 80S ribosomes. Thus, our data suggest that NCp7 molecules released in newly infected cells may primarily bind to ribosomes, where they may exert a new potential role in HIV-1 infection.


Conflict of interest statement

Competing Interests: The authors have declared that no competing interests exist.

Figures

Fig 1
Fig 1. Intracellular distribution of NCp7-eGFP.
(A) Amino acid sequence of NCp7. Confocal images of HeLa cells expressing transiently eGFP (B) or NCp7-eGFP (C, D). Comparison with the localization of DNA labeled by 1.6 μM Hoechst 33342, (C) and RNA labeled by 1 μM Pyronin Y. The cyan color of the merge panel in (C) indicates colocalization of NCp7 with DNA in the nucleus. The nearly uniform yellow color of the merge panel in (D) indicates a strong colocalization of NCp7 with RNA all over the cell.
Fig 2
Fig 2. Interaction of NCp7-eGFP with nucleic acids monitored by two-photon FLIM.
Fluorescence lifetime color-coded images of eGFP (A, B) and NCp7-eGFP (C, D, E) in the absence (A, C) or in the presence (B, D, E) of 2.5 μM Sytox Orange. In panel E, a mixture of RNaseA and RNase T1 was added at 25 U/mL and 100 U/mL, respectively. The time-resolved decays were fitted with a mono-exponential function. Excitation wavelength was 900 nm. Emission of eGFP was selectively collected through a 515/10 nm filter to remove any contribution from Sytox Orange emission.
Fig 3
Fig 3. FRAP experiments in eGFP and NCp7-eGFP expressing cells.
(A) Time lapse sequence of typical FRAP measurements in the cytoplasm of an NCp7-eGFP expressing cell. The bleached region is highlighted by the red circle. Normalized fluorescence recovery curves of (B) eGFP and (C) NCp7-eGFP in the cytoplasm. For both eGFP and NCp7-eGFP, the distribution of residuals indicated a much better fit of the recovery curves with a double exponential as compared to a single exponential fit.
Fig 4
Fig 4. FRAP-based estimation of diffusion coefficient values (A) and mobile fraction (B) of eGFP and NCp7-eGFP in the cytoplasm and in the nucleus.
Fig 5
Fig 5. FCS measurements in eGFP and NCp7-eGFP expressing HeLa cells.
(A) Experimental autocorrelation function (blue) of NCp7-eGFP in HeLa cells fitted with a model for free (green) and anomalous (red) 3D diffusion. The residuals indicate that a better fit was obtained with the anomalous diffusion model. (B) Comparison of autocorrelation curves for eGFP and NCp7-eGFP diffusion in the cytoplasm of HeLa cells. Fits (solid lines) were performed with the anomalous diffusion model. (C) Histogram of the brightness analysis for eGFP and NCp7-eGFP (N = 16).
Fig 6
Fig 6. NCp7-eGFP dynamics in HeLa cells monitored by RICS.
(A) A series of confocal images of eGFP and NCp7-eGFP expressing cells was acquired. A 128x128 pixel region was analyzed by calculating the two-dimensional spatial autocorrelation function represented as a spatial correlation surface (B) that was fitted by a 3D diffusion model (C), revealing the values of the diffusion coefficients and the number of diffusing molecules.
Fig 7
Fig 7. Confocal images (A, C) and RICS-based diffusion maps (B, D) of eGFP and NCp7-eGFP in HeLa cells.
The color coded images (B, D) represent the values of the diffusion coefficients measured in the cell. The blue colors at the cell borders are artifacts, due to averaging with the exterior of the cells. Confocal images for the same cells (A, C) are given to identify the cell compartments and contour.
Fig 8
Fig 8. FCCS measurements on HeLa cells expressing RpL26-eGFP and NCp7-mCherry.
The green, red and black curves denote the autocorrelation curve of RpL26-eGFP in the green channel, the autocorrelation curve of NCp7-mCherry in the red channel, and the cross-correlation curve between the two channels, respectively. As a negative control, the blue curve corresponds to the cross-correlation between eGFP and mCherry proteins co-expressed in HeLa cells. The close to zero value of the FCCS curve of the negative control not only shows that the two fluorescent proteins do not diffuse together, but also that there is marginal spectral bleed-through between the green and red channels. The solid lines correspond to the fit of the curves to the anomalous 3 D diffusion model. Diffusion constants of 5.6 (+/- 0.7) μm2/s, 6 (+/- 3) μm2/s and 4 (+/- 3) μm2/s were obtained for RpL26-eGFP (green), NCp7-mCherry (red) and the RPL26-eGFP/NCp7-mCherry complex (black), respectively.
Fig 9
Fig 9. NCp7 cosediments with 80S ribosomes.
(A) Sucrose gradient fractionation profile of purified 80S ribosomes (0.9 μM) incubated with NCp7 (13.3μM). Ribosome/NCp7 ratio was about 1/15. The peak fractions (8–9) were precipitated and further analyzed by western blot. (B) Western blot of fractions 8–9 from sucrose gradient fractionations performed with only NCp7 peptide (lanes 1); only 80S ribosomes (lanes 2); and 80S ribosomes and NCp7, together (lanes 3). NCp7 and ribosomal proteins were detected with polyclonal NCp7 and RpS7 antibodies, and monoclonal RpL26 antibodies. As a control, 90 nM of NCp7 peptide was loaded (4).

References

    1. Lee BM, De Guzman RN, Turner BG, Tjandra N, Summers MF (1998) Dynamical behavior of the HIV-1 nucleocapsid protein. J Mol Biol 279: 633–649. - PubMed
    1. Morellet N, Jullian N, De Rocquigny H, Maigret B, Darlix JL, et al. (1992) Determination of the structure of the nucleocapsid protein NCp7 from the human immunodeficiency virus type 1 by 1H NMR. EMBO J 11: 3059–3065. - PMC - PubMed
    1. Mely Y, Jullian N, Morellet N, Derocquigny H, Dong CZ, et al. (1994) Spatial Proximity of the Hiv-1 Nucleocapsid Protein Zinc Fingers Investigated by Time-Resolved Fluorescence and Fluorescence Resonance Energy-Transfer. Biochemistry 33: 12085–12091. - PubMed
    1. Morellet N, de Rocquigny H, Mely Y, Jullian N, Demene H, et al. (1994) Conformational behaviour of the active and inactive forms of the nucleocapsid NCp7 of HIV-1 studied by 1H NMR. J Mol Biol 235: 287–301. - PubMed
    1. Darlix JL, Cristofari G, Rau M, Pechoux C, Berthoux L, et al. (2000) Nucleocapsid protein of human immunodeficiency virus as a model protein with chaperoning functions and as a target for antiviral drugs. Adv Pharmacol 48: 345–372. - PubMed