. 2015 Feb 27;10(2):e0118153.
doi: 10.1371/journal.pone.0118153. eCollection 2015.

Role of cortactin homolog HS1 in transendothelial migration of natural killer cells

Affiliations

Role of cortactin homolog HS1 in transendothelial migration of natural killer cells

Suranjana Mukherjee et al. PLoS One. .

Abstract

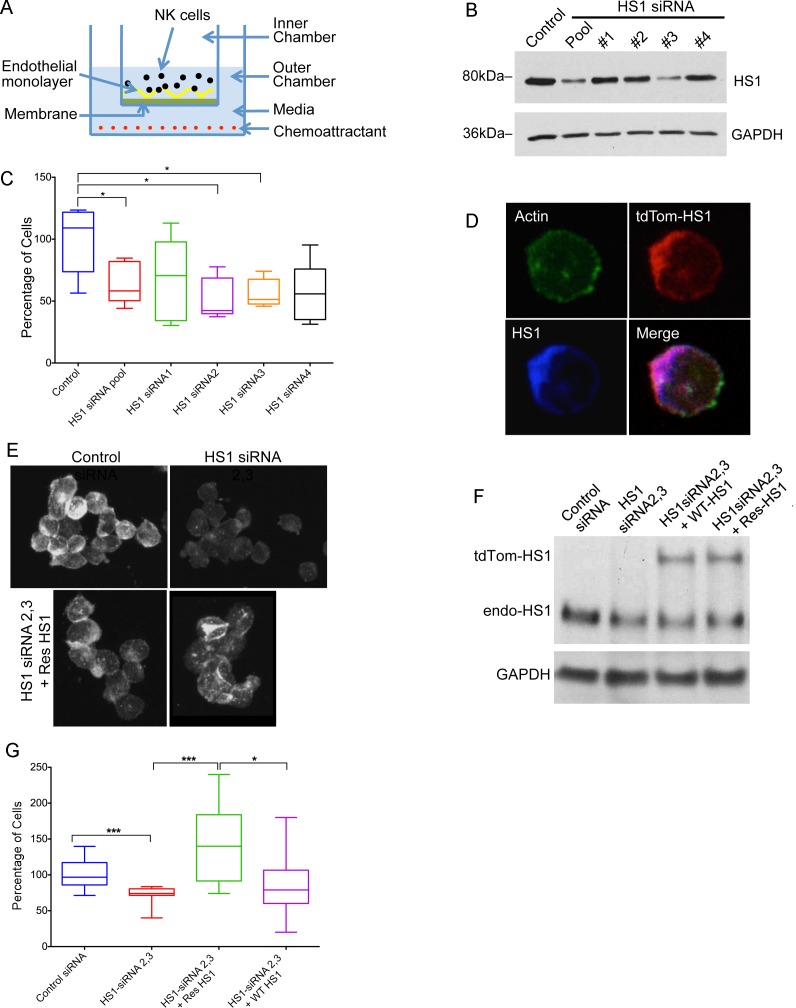
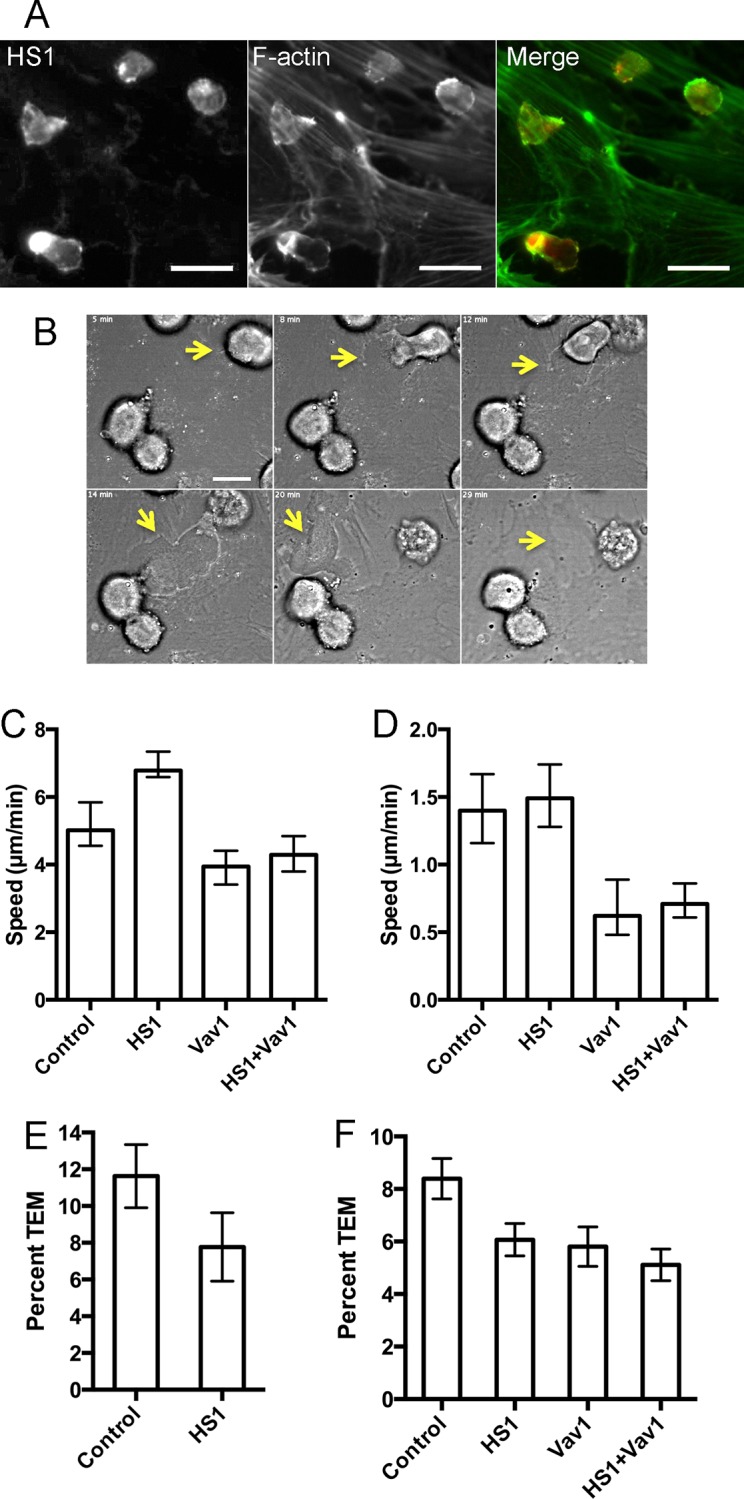
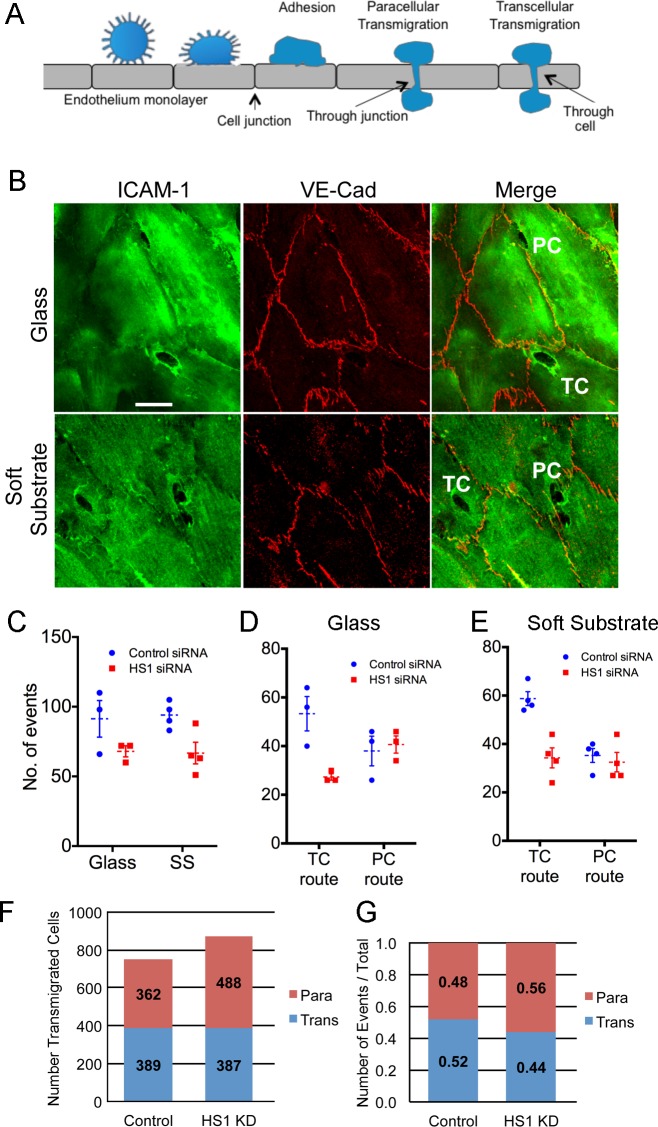
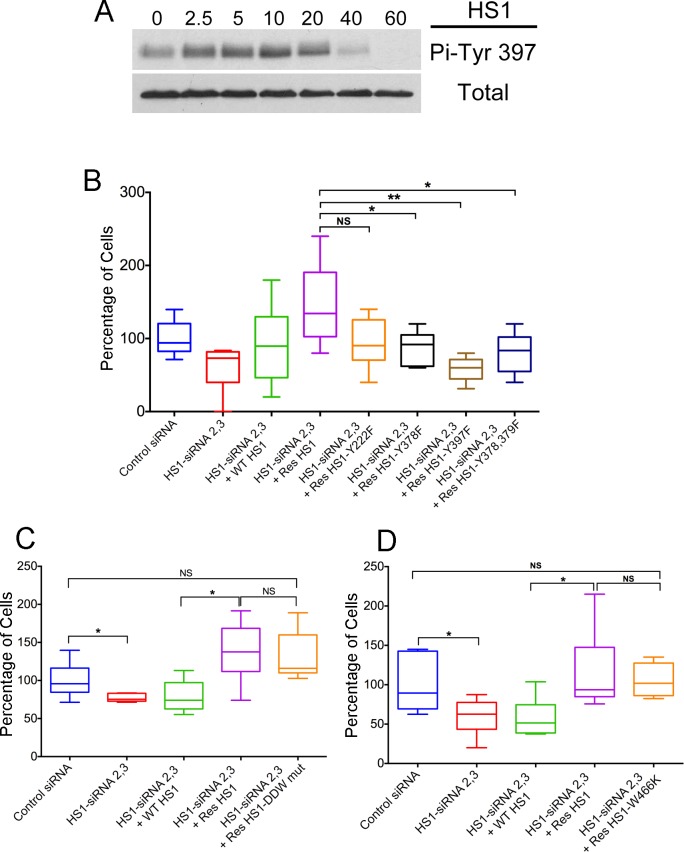
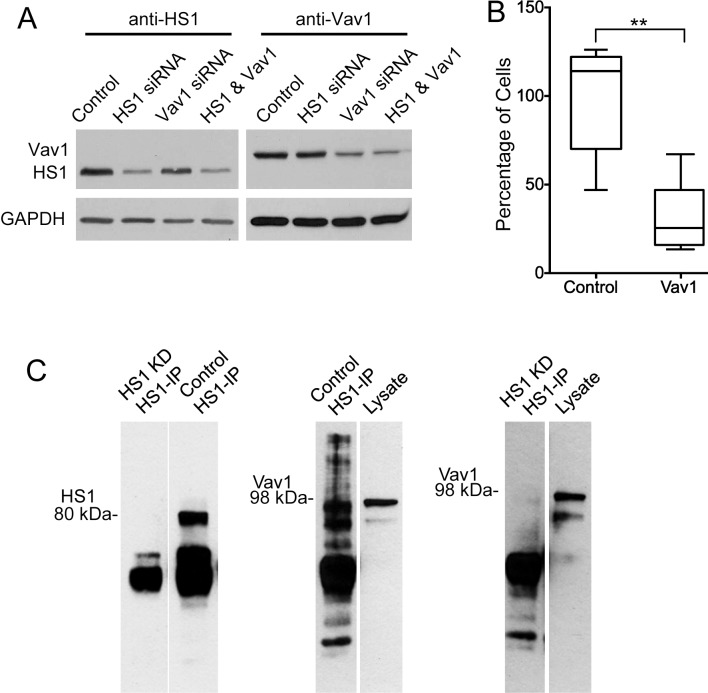
Natural Killer (NK) cells perform many functions that depend on actin assembly, including adhesion, chemotaxis, lytic synapse assembly and cytolysis. HS1, the hematopoietic homolog of cortactin, binds to Arp2/3 complex and promotes actin assembly by helping to form and stabilize actin filament branches. We investigated the role of HS1 in transendothelial migration (TEM) by NK cells. Depletion of HS1 led to a decrease in the efficiency of TEM by NK cells, as measured by transwell assays with endothelial cell monolayers on porous filters. Transwell assays involve chemotaxis of NK cells across the filter, so to examine TEM more specifically, we imaged live-cell preparations and antibody-stained fixed preparations, with and without the chemoattractant SDF-1α. We found small to moderate effects of HS1 depletion on TEM, including whether the NK cells migrated via the transcellular or paracellular route. Expression of HS1 mutants indicated that phosphorylation of HS1 tyrosines at positions 222, 378 and 397 was required for rescue in the transwell assay, but HS1 mutations affecting interaction with Arp2/3 complex or SH3-domain ligands had no effect. The GEF Vav1, a ligand of HS1 phosphotyrosine, influenced NK cell transendothelial migration. HS1 and Vav1 also affected the speed of NK cells migrating across the surface of the endothelium. We conclude that HS1 has a role in transendothelial migration of NK cells and that HS1 tyrosine phosphorylation may signal through Vav1.


Conflict of interest statement

Competing Interests: The authors have declared that no competing interests exist.

Figures

Fig 1
Fig 1. HS1 and TEM of NK cells in transwell assays.
A) Diagram of transendothelial migration assay in a transwell device. B) Depletion of HS1 protein by siRNA, shown by immunoblot after 72 hrs. NK cells were treated with a pool of four siRNAs or one of the four. GAPDH is a loading control. C) Effects of HS1 knockdown on TEM. Plotted values are number of cells in the lower chamber, as a percentage of the mean of the control sample value on each day. Box-and-whisker plots (box: 25th to 75th percentiles, whiskers: min to max, middle line: median). Asterisks indicate statistical significance (*P<0.05. Unpaired Student’s t-test, n = 5 for each condition.) D) Fluorescence micrographs of NK cells, showing expression and co-localization of expressed HS1-tdTomato (red), F-actin (green, Alexa Fluor 488 phalloidin), and total HS1, including endogenous (blue, anti-HS1 staining). E) Fluorescence micrographs of NK cells stained with anti-HS1 to show siRNA-induced depletion of HS1 and expression of siRNA-resistant HS1 protein. F) Expression of siRNA-resistant HS1 in NK cells knocked down for HS1 with siRNA, shown by immunoblot with anti-HS1. Knockdown used a combination of HS1 siRNAs 2 and 3. G) Rescue of TEM phenotype in HS1-knockdown NK cells by expression of HS1. Cells as in panels E and F. Number of cells in the lower chamber, as a percentage of the mean of the control sample value on each day, with box-and-whisker plots as in panel C. Asterisks indicate statistical significance. (* P< 0.05, *** P < 0.0005. Unpaired Student’s t-test, N = 9–12 experiments for each condition.)
Fig 2
Fig 2. TEM events by NK cells on HDMVEC monolayers based on live-cell movie analysis.
A) Endogenous HS1 (red) and F-actin (green) in NK cells migrating on the surface of HDMVEC monolayer observed by anti-HS1 and phalloidin fluorescence. Scale bar = 20 μm. B) DIC images from a movie (S2 Movie), illustrating how the passage of the NK cell through the endothelial monolayer leaves a defect. Scale bar = 10 μm. C) Speed of cell migration, based on path length. Median and 95% confidence intervals are plotted. Data from Table 4-1. D) Speed of cell migration, based on net displacement. Median and 95% confidence intervals are plotted. Data from Table 4-2. E) Percentage of TEM events from movie analysis with SDF-1α. The number of TEM events as a percentage of the total number of NK cells on the surface of the endothelial monolayer in the first frame. Error bars are standard error of proportion. The difference is not statistically significant by z-test (p = 0.15) or by Fisher’s exact test for a 2 x 2 contingency table (p = 0.19). Data combined from two or three experiments per day on three days. F) Percentage of TEM events from movie analysis without SDF-1α. The number of TEM events as a percentage of the total number of NK cells on the surface of the endothelial monolayer in the first frame. Error bars are standard error of proportion. The differences between control and depleted-cell values are statistically significant with p values of 0.022, 0.024 and 0.001 for HS-depleted, Vav1-depleted and HS1+Vav1-depleted NK cells, based on chi-square tests with Yates’ correction. No other differences are statistically significant. Data combined from experiments on three days.
Fig 3
Fig 3. Transcellular vs paracellular route of TEM.
A) Diagram illustrating paracellular and transcellular routes. B) Representative confocal fluorescence images of cells taking the paracellular (PC) and transcellular (TC) routes. The migrating NK cells appear as small dark holes surrounded by intense anti-ICAM-1 staining, and the endothelial cell-cell junctions are visualized by anti-VE-cadherin staining. The endothelial cell substrate was glass in the upper panel and soft substrate (polyacrylamide) in the lower panel. Scale bar = 10 μm. C) Total number of transendothelial migration events, with the endothelial monolayer on glass or soft substrate (SS). D) Numbers of paracellular and transcellular transmigration events on glass. E) Numbers of paracellular and transcellular transmigration events on soft substrate. For panels D to F, each plotted data point represents the average of three values from one experiment. The mean and standard error of the values of the plotted points are also indicated, by the dotted lines and error bars. HDMVEC cells were washed with SDF-1α-containing media before the addition of NK cells, and NK cells were incubated for 2 hrs on the monolayer before fixation. F and G) Transendothelial migration events and routes. NK cells were incubated for 25 min on the surface of an HDMVEC monolayer. NK cells migrated via transcellular and paracellular routes were counted over entire slide. The data are based on experiments in triplicate on two different days. F) Numbers of events. G) Ratios. The difference in the ratio of transcellular to paracellular events between control and HS1 knockdown is small but statistically significant because the number of data points is large. Based on a 2 x 2 contingency table, Fisher’s exact two-tailed p-value is 0.0024.
Fig 4
Fig 4. Expression Rescue of HS1 Mutants in HS1-depleted NK Cells.
A) Phosphorylation of HS1 Tyr397 in response to SDF-1α. Immunoblots probed with anti-Phospho-Tyr397 and anti-HS1. NK cells (5 x 10⁶) treated with SDF-1α (30 ng/mL) for the indicated times (min). B—D) Function of HS1 mutants in TEM by transwell assay. Number of cells in the lower chamber, as a percentage of the mean of the control sample value on each day, with box and whisker plots. Boxes: 25th to 75th percentiles; whiskers: minimum and maximum values. B) Mutations of phosphorylated tyrosine residues. Compared to control siRNA (blue), HS1 depletion by siRNA causes decreased TEM (red), and the defect is rescued by expression of wild-type HS1 (green) or siRNA-resistant wild-type HS1 (purple). Expression of siRNA-resistant forms of single-mutant HS1 Y378F (black), single-mutant HS1 Y397F (brown) or double-mutant HS1 Y378F Y397F (dark blue) does not rescue the defect, comparing their values to the value for siRNA-resistant wild-type (purple). Expression of siRNA-resistant HS1 Y222F (orange) rescues with a value that is slightly less, but not statistically significant, from that of siRNA-resistant wild type. Asterisks indicate *P>0.05, **P>0.005 (unpaired Student’s t-test, N = 6–9). C) Mutation of Arp2/3 complex binding site. Expression of siRNA-resistant HS1 with mutation of DDW residues to AAA (orange) rescues the defect, with no difference compared to siRNA-resistant wild-type HS1. N = 6 in each case. D) Mutation of SH3 domain at ligand-binding site. Expression of siRNA-resistant HS1 with the mutation W466K (orange) rescues the defect, with no difference compared to siRNA-resistant wild-type HS1. n = 6 in each case.
Fig 5
Fig 5. Role of Vav1 in TEM by NK cells.
A) Immunoblots with anti-HS1 and anti-Vav1 showing depletion of HS1 and Vav1 after 72 hrs of siRNA treatment. B) Decrease in TEM in transwell assay by NK cells treated with Vav1 siRNA, compared to control siRNA. Number of cells in the lower chamber, as a percentage of the mean of the control sample value on each day, with box and whisker plots. Boxes: 25th to 75th percentiles; whiskers: minimum and maximum values. N = 6. Asterisks indicate **P<0.005 (unpaired Student’s t-test). C) Left panel: Immunoblot with anti-HS1. The left lane shows the absence of HS1 in an anti-HS1 immunoprecipitate from a whole-cell lysate of NK cells treated with siRNA targeting HS1. The right lane shows the result for cells treated with control siRNA. Middle panel: Immunoblot with anti-Vav1. The left lane shows the presence of Vav1 protein in an anti-HS1 precipitate from a lysate of NK cells treated with control siRNA. The right lane shows the presence of Vav1 in the lysate. Right panel: Similar to the middle panel, except with a lysate from NK cells depleted for HS1.

References

    1. Muller WA (2009) Mechanisms of transendothelial migration of leukocytes. Circ Res 105: 223–230. 10.1161/CIRCRESAHA.109.200717 - DOI - PMC - PubMed
    1. Engelhardt B, Wolburg H (2004) Mini-review: Transendothelial migration of leukocytes: through the front door or around the side of the house? Eur J Immunol 34: 2955–2963. - PubMed
    1. Muller WA (2011) Mechanisms of leukocyte transendothelial migration. Annu Rev Pathol 6: 323–344. 10.1146/annurev-pathol-011110-130224 - DOI - PMC - PubMed
    1. Ley K, Laudanna C, Cybulsky MI, Nourshargh S (2007) Getting to the site of inflammation: the leukocyte adhesion cascade updated. Nat Rev Immunol 7: 678–689. - PubMed
    1. Wittchen ES, van Buul JD, Burridge K, Worthylake RA (2005) Trading spaces: Rap, Rac, and Rho as architects of transendothelial migration. Curr Opin Hematol 12: 14–21. - PubMed

Publication types

MeSH terms