

Endocrine determinants of changes in insulin sensitivity and insulin secretion during a weight cycle in healthy men
- PMID: 25723719
- PMCID: PMC4344201
- DOI: 10.1371/journal.pone.0117865
Endocrine determinants of changes in insulin sensitivity and insulin secretion during a weight cycle in healthy men
Abstract
Objective: Changes in insulin sensitivity (IS) and insulin secretion occur with perturbations in energy balance and glycemic load (GL) of the diet that may precede the development of insulin resistance and hyperinsulinemia. Determinants of changes in IS and insulin secretion with weight cycling in non-obese healthy subjects remain unclear.
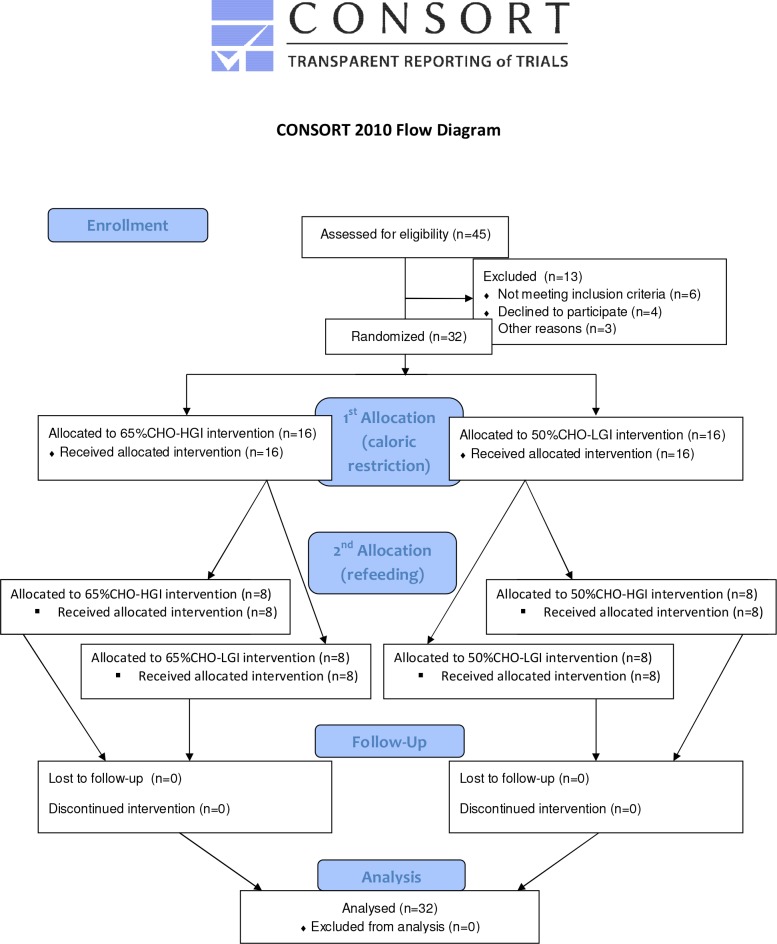
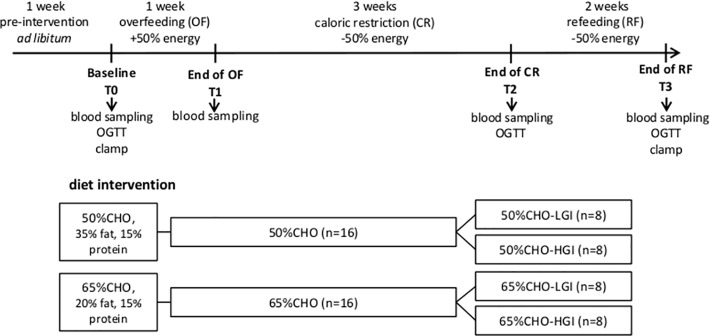
Methods: In a 6wk controlled 2-stage randomized dietary intervention 32 healthy men (26±4y, BMI: 24±2kg/m2) followed 1wk of overfeeding (OF), 3wks of caloric restriction (CR) containing either 50% or 65% carbohydrate (CHO) and 2wks of refeeding (RF) with the same amount of CHO but either low or high glycaemic index at ±50% energy requirement. Measures of IS (basal: HOMA-index, postprandial: Matsuda-ISI), insulin secretion (early: Stumvoll-index, total: tAUC-insulin/tAUC-glucose) and potential endocrine determinants (ghrelin, leptin, adiponectin, thyroid hormone levels, 24h-urinary catecholamine excretion) were assessed.
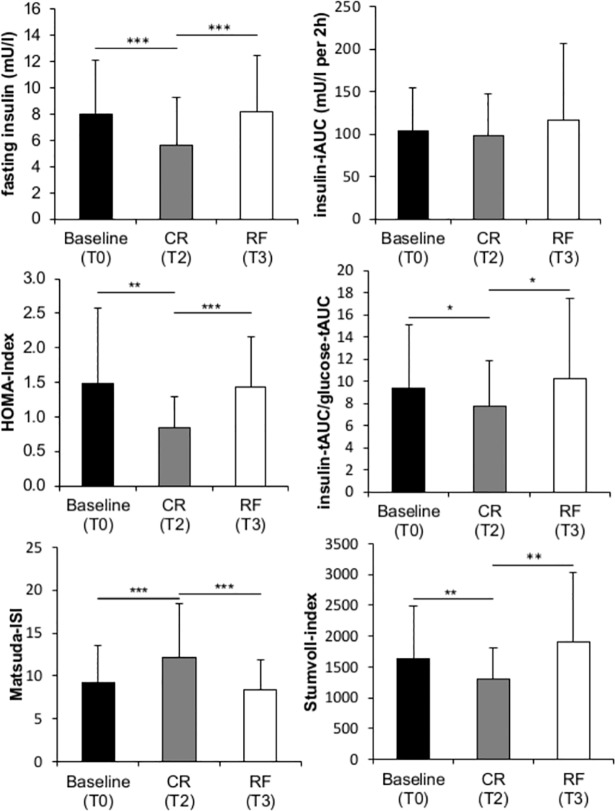
Results: IS improved and insulin secretion decreased due to CR and normalized upon RF. Weight loss-induced improvements in basal and postprandial IS were associated with decreases in leptin and increases in ghrelin levels, respectively (r = 0.36 and r = 0.62, p<0.05). Weight regain-induced decrease in postprandial IS correlated with increases in adiponectin, fT3, TSH, GL of the diet and a decrease in ghrelin levels (r-values between -0.40 and 0.83, p<0.05) whereas increases in early and total insulin secretion were associated with a decrease in leptin/adiponectin-ratio (r = -0.52 and r = -0.46, p<0.05) and a decrease in fT4 (r = -0.38, p<0.05 for total insulin secretion only). After controlling for GL associations between RF-induced decrease in postprandial IS and increases in fT3 and TSH levels were no longer significant.
Conclusion: Weight cycling induced changes in IS and insulin secretion were associated with changes in all measured hormones, except for catecholamine excretion. While leptin, adiponectin and ghrelin seem to be the major endocrine determinants of IS, leptin/adiponectin-ratio and fT4 levels may impact changes in insulin secretion with weight cycling.
Trial registration: ClinicalTrials.gov NCT01737034.
Conflict of interest statement
Figures
References
-
- Brands M, Swat M (2013) Effects of a hypercaloric diet on β‐cell responsivity in lean healthy men. Clin Endocrinol (Oxf). - PubMed
-
- Hamm P, Shekelle RB, Stamler J (1989) Large fluctuations in body weight during young adulthood and twenty-five-year risk of coronary death in men. Am J Epidemiol 129: 312–318. - PubMed
Publication types
MeSH terms
Substances
Associated data
LinkOut - more resources
Full Text Sources
Other Literature Sources
Medical
Research Materials
