. 2015 Apr 1;194(7):2993-7.
doi: 10.4049/jimmunol.1403086. Epub 2015 Feb 27.

Cutting edge: An in vivo reporter reveals active B cell receptor signaling in the germinal center

Affiliations

Cutting edge: An in vivo reporter reveals active B cell receptor signaling in the germinal center

James Mueller et al. J Immunol. .

Abstract

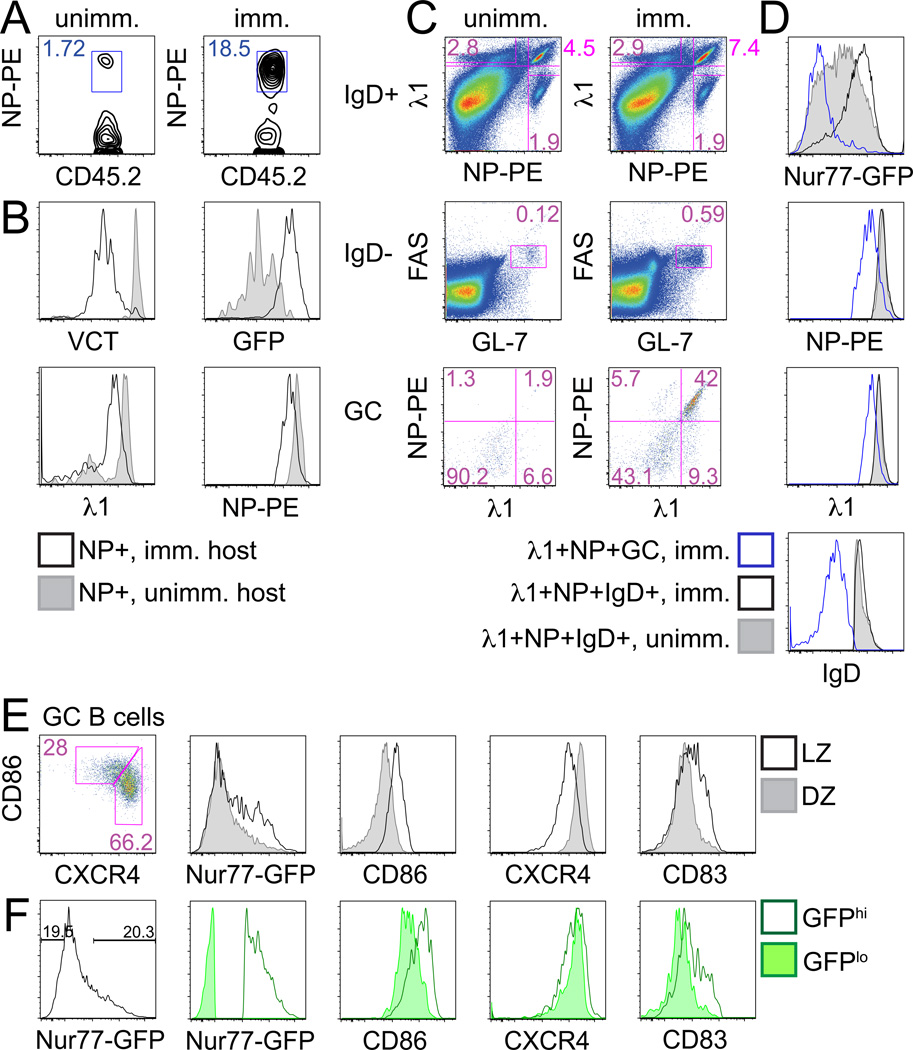
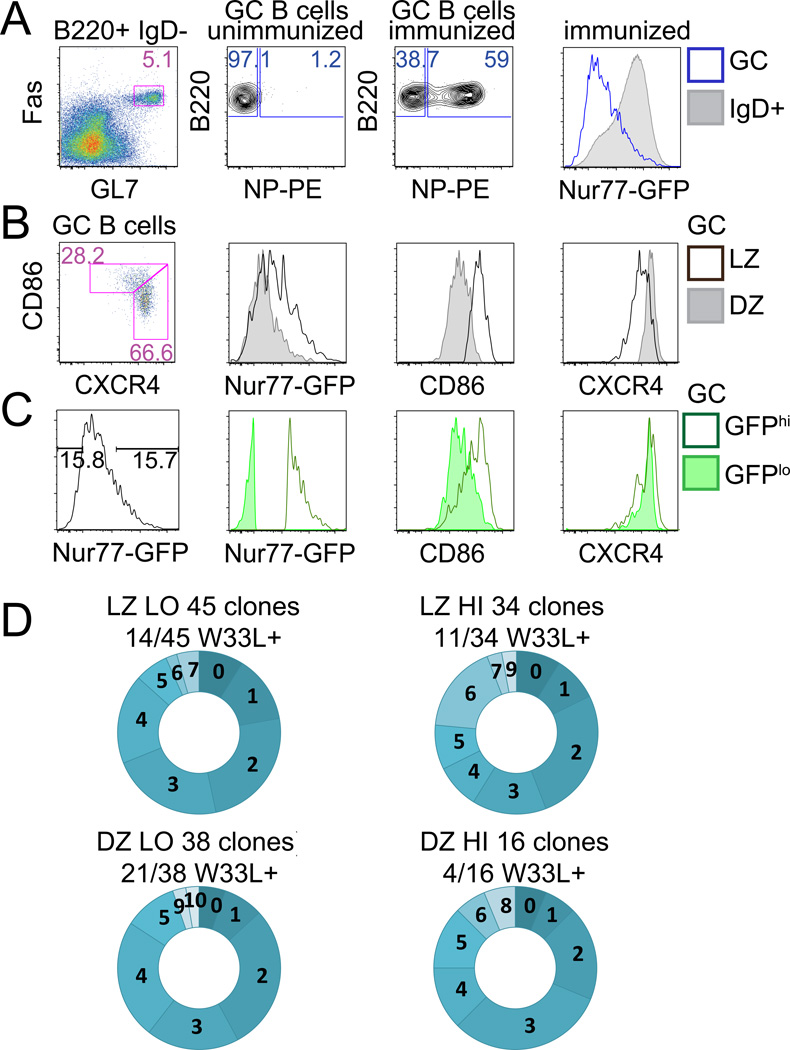
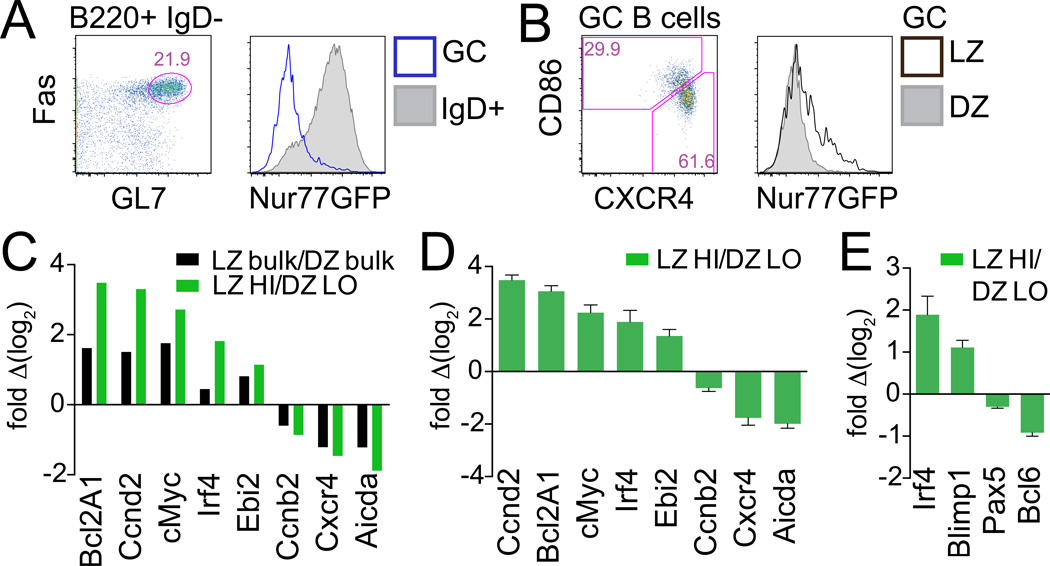
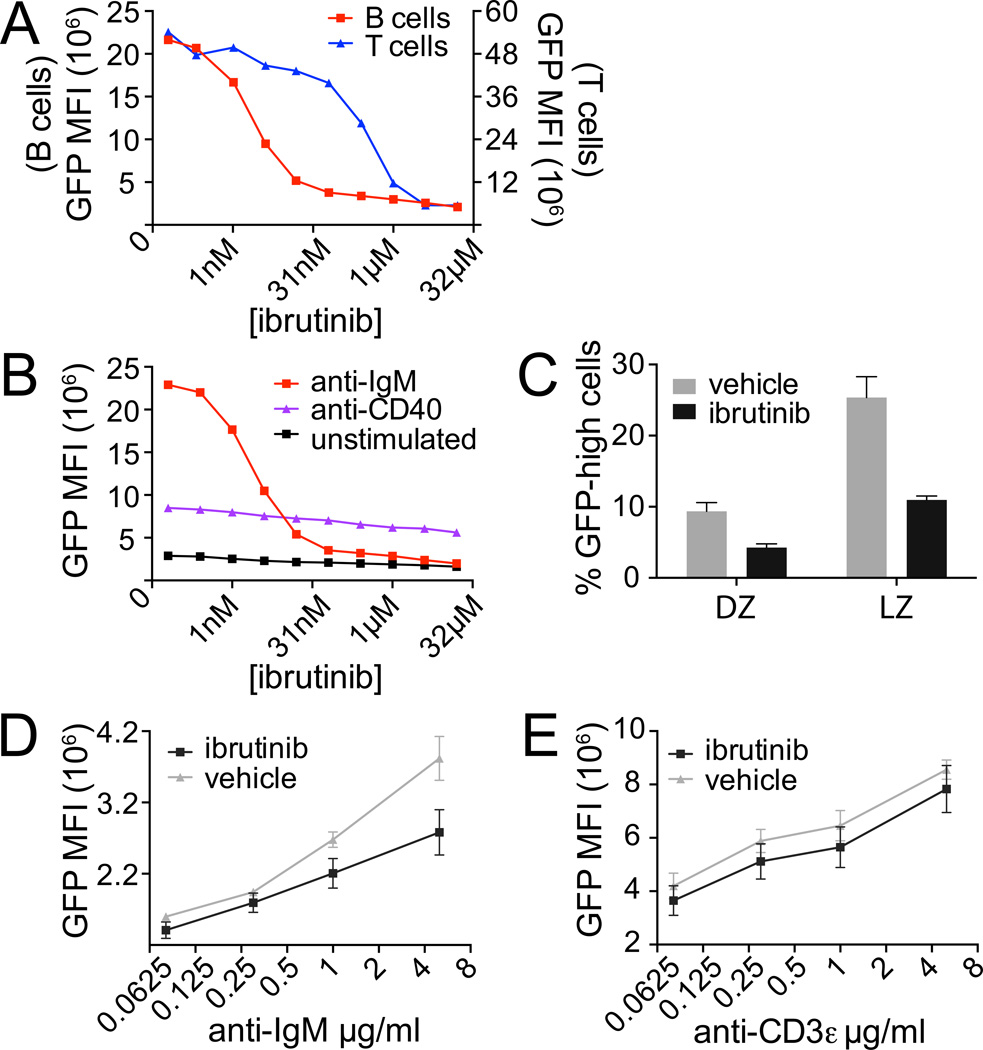
Long-lasting Ab responses rely on the germinal center (GC), where B cells bearing high-affinity Ag receptors are selected from a randomly mutated pool to populate the memory and plasma cell compartments. Signaling downstream of the BCR is dampened in GC B cells, raising the possibility that Ag presentation and competition for T cell help, rather than Ag-dependent signaling per se, drive these critical selection events. In this study we use an in vivo reporter of BCR signaling, Nur77-eGFP, to demonstrate that although BCR signaling is reduced among GC B cells, a small population of cells exhibiting GC light zone phenotype (site of Ag and follicular helper T cell encounter) express much higher levels of GFP. We show that these cells exhibit somatic hypermutation, gene expression characteristic of signaling and selection, and undergo BCR signaling in vivo.


Figures

Figure 1
Figure 1. Nur77-GFP reporter identifies B cells activated by antigen in vivo
(A, B) B1-8 reporter splenocytes loaded with CTV were adoptively transferred into CD45.1 BoyJ recipients. Recipient splenocytes were stained 3 days after NP-KLH immunization. (A) Plots represent CD45.2+ donor cells from unimmunized (left) and immunized (right) hosts stained with NP-PE. (B) Histograms represent VCT, GFP, surface NP, and λ1 expression in NP+ donor B cells from immunized (black line) or unimmunized (shaded histogram) recipients as gated in (A). Data are representative of 4 biological replicates. (C–F) B1-8 reporter splenocytes were harvested and stained d9 after NP-KLH immunization. (C) Plots depict gating to identify: IgD+λ1+NP+ B cells (top panels), IgDnegFashiGL-7hi GC B cells (middle panels), and λ1+NP+GC B cells (bottom panels) from unimmunized (left) and immunized (right) mice. (D) histograms represent GFP, NP, λ1, and IgD expression in λ1+NP+ GC B cells (blue line), λ1+NP+IgD+ B cells from immunized mouse (black line) or λ1+NP+ IgD+ B cells from unimmunized mouse (shaded histogram) as gated in (C). (E) Histograms represent GFP, CD86, CXCR4, and CD83 expression in overlayed LZ (CD86hiCXCR4lo) and DZ (CD86loCXCR4hi) phenotype GC B cells from immunized B1-8 mice as gated in left-hand panel plot. (F) Right hand histograms depict same markers in GFP-low and GFP-high GC B cells gated as in left hand histogram. Data are representative of 4 biological replicates.
Figure 2
Figure 2. High Nur77-GFP-expressing GC B cells exhibit SHM
(A–C) C57/Bl6 reporter splenocytes were stained d14 after NP-KLH immunization. (A) Plots represent gating to identify B220+IgDnegFashiGL7hi GC B cells (left hand panel), and NP-binding GC B cells (middle panels). Overlayed histograms (right hand panel) represent GFP expression from IgD+ (shaded histogram) and GC B cells (blue line). (B,C) Plots and histograms as described in Fig. 1E, F. Data are representative of 8 biological replicates. (D) Vh186.2 heavy chains isolated from singly sorted GC B cells (see Fig. S1B for gating) from B6 reporter mice d10 after NP-KLH immunization were sequenced. Graphs represent number of mutations in individual clones (see Fig. S1C for mutation distribution). Numbers above graphs show proportion of clones with the W33L mutation.
Figure 3
Figure 3. Nur77-GFP expression correlates with LZ gene expression signature
(A–B) B6 reporter splenocytes were stained d8 after LCMV infection. (A) Plots represent gating to identify B220+IgDnegFashiGL7hi GC B cells (lefthand panel). Overlayed histograms (righthand panel) represent GFP expression from IgD+ (shaded histogram) and GC B cells (blue line). (B) Plot and histogram as described in Fig. 1E. Data are representative of at least 2 independent experiments with 2–3 mice per time point per experiment. (C–E) GC B cells from B6 reporter mice infected with LCMV were sorted (see Fig. S2E for gating), and transcript abundance was assessed by qPCR. (C) shows enrichment of LZ-DZ gene expression signatures in GFP-sort relative to bulk sort; data from one sort shown here is representative of 3 independent sorts. (D and E) present qPCR data from 3 independent sorts +/− SEM to demonstrate reproducibility.
Figure 4
Figure 4. Nur77-GFP expression in GC B cells is dependent upon BCR signaling
(A) Reporter LN cells were treated with 5µg/ml of either anti-IgM or anti-CD3ε along with varying concentrations of ibrutinib and then stained after 16 hrs for B220, CD4, and CD69 expression. Graph depicts GFP MFI of CD4 T cells or B cells. Data are representative of 2 independent experiments. (B) Reporter LN cells were treated with 4µg /ml of anti-IgM, 1 µg /ml of anti-CD40, or neither along with varying concentrations of ibrutinib and then stained after 16 hrs as above. Graph depicts GFP MFI of B cells. Data are representative of 2 independent experiments. (C) LN cells harvested d13 from mice treated with vehicle or ibrutinib on days 10, 11, and 12 following LCMV infection were stained and gated as in Supplemental Figure 2I, J. Graph depicts % GFP-high LZ and DZ B cells. (D, E) LN cells harvested from mice treated as in (C) were restimulated with varying doses of either anti-IgM (D) or anti-CD3ε (E) for 4 hrs without additional inhibitor, after which cells were stained as in (A). Graph depicts GFP MFI of B cells (D) or T cells (E) normalized to GFP MFI of individual PMA-treated samples (positive control). Data plotted in C–E are the mean +/− SEM of 3 biological replicates.

References

    1. Allen CDC, Okada T, Cyster JG. Germinal-center organization and cellular dynamics. Immunity. 2007;27:190–202. - PMC - PubMed
    1. Shlomchik MJ, Weisel F. Germinal center selection and the development of memory B and plasma cells. Immunol Rev. 2012;247:52–63. - PubMed
    1. Tarlinton DM. Evolution in miniature: selection, survival and distribution of antigen reactive cells in the germinal centre. Immunology and Cell Biology. 2008;86:133–138. - PubMed
    1. Victora GD, Nussenzweig MC. Germinal centers. Annual Review of Immunology. 2012;30:429–457. - PubMed
    1. Chan TD, Brink R. Affinity-based selection and the germinal center response. Immunol Rev. 2012;247:11–23. - PubMed

Publication types

MeSH terms