. 2015 Jun;32(6):1474-86.
doi: 10.1093/molbev/msv039. Epub 2015 Feb 27.

Sphingolipids, Transcription Factors, and Conserved Toolkit Genes: Developmental Plasticity in the Ant Cardiocondyla obscurior

Affiliations

Sphingolipids, Transcription Factors, and Conserved Toolkit Genes: Developmental Plasticity in the Ant Cardiocondyla obscurior

Lukas Schrader et al. Mol Biol Evol. 2015 Jun.

Abstract

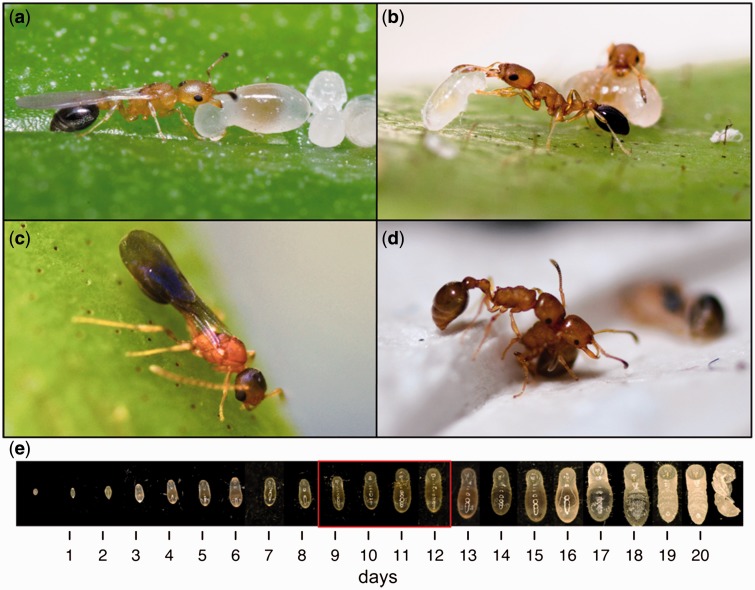
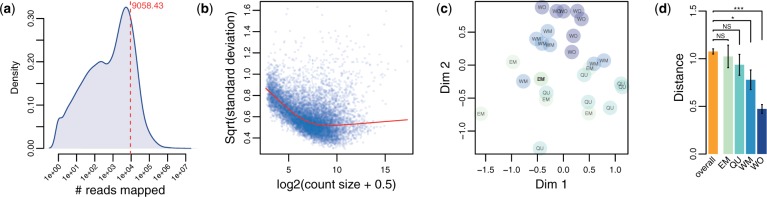
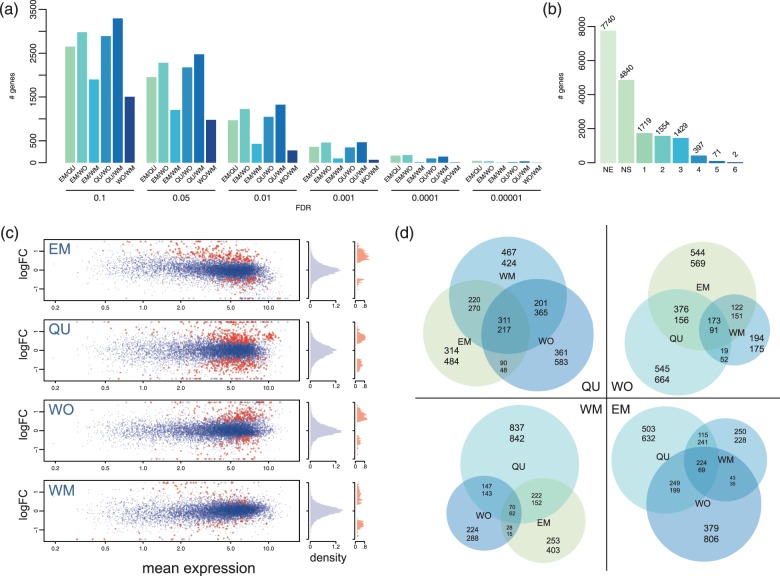
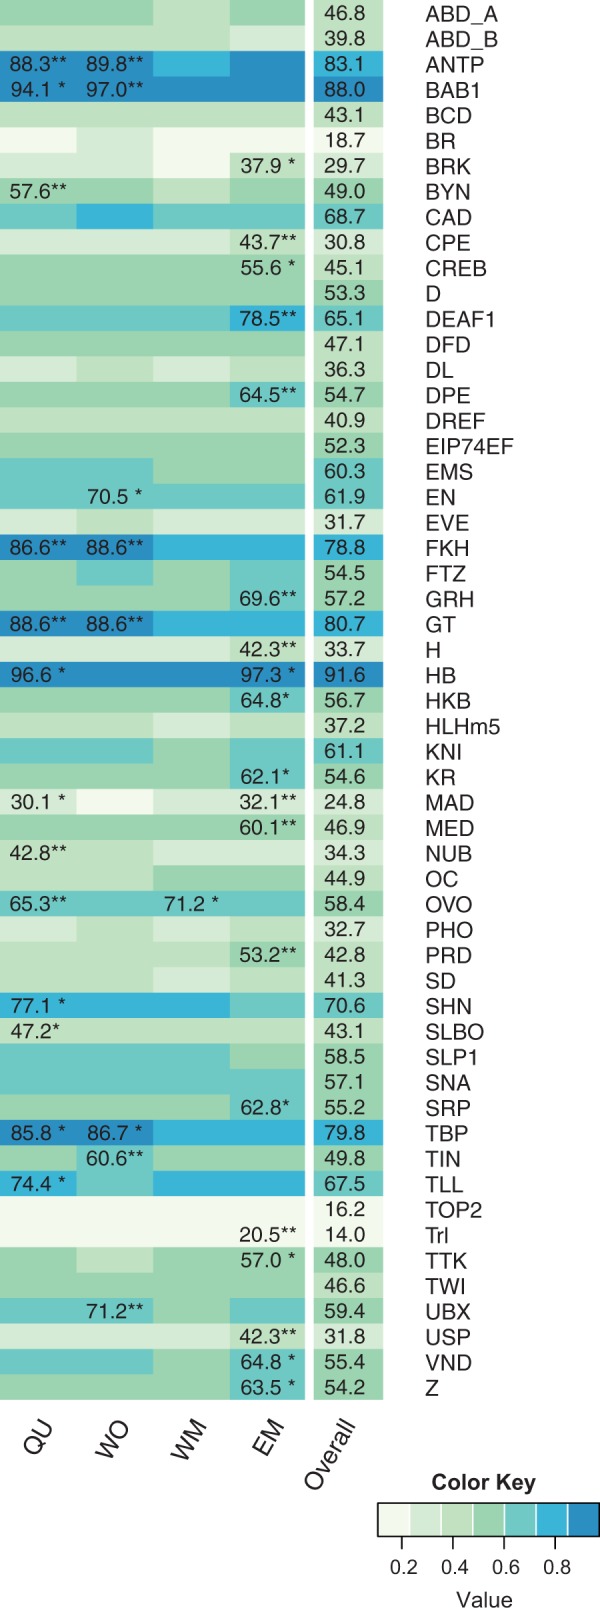
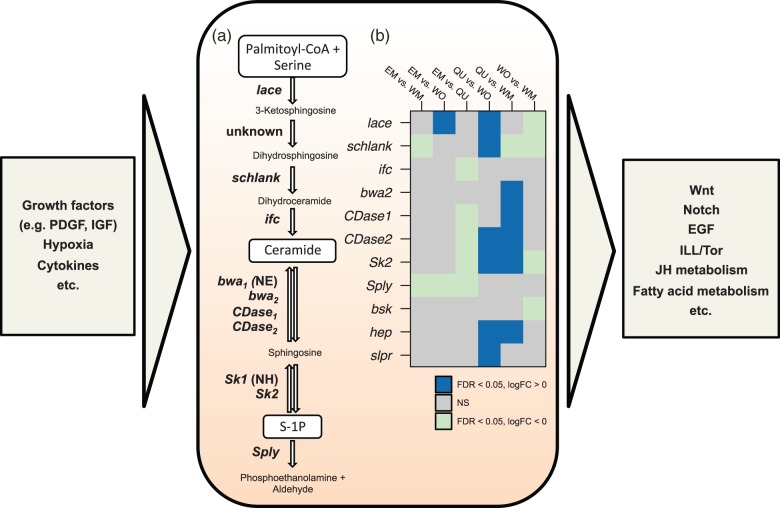
Developmental plasticity allows for the remarkable morphological specialization of individuals into castes in eusocial species of Hymenoptera. Developmental trajectories that lead to alternative caste fates are typically determined by specific environmental stimuli that induce larvae to express and maintain distinct gene expression patterns. Although most eusocial species express two castes, queens and workers, the ant Cardiocondyla obscurior expresses diphenic females and males; this provides a unique system with four discrete phenotypes to study the genomic basis of developmental plasticity in ants. We sequenced and analyzed the transcriptomes of 28 individual C. obscurior larvae of known developmental trajectory, providing the first in-depth analysis of gene expression in eusocial insect larvae. Clustering and transcription factor binding site analyses revealed that different transcription factors and functionally distinct sets of genes are recruited during larval development to induce the four alternative trajectories. In particular, we found complex patterns of gene regulation pertaining to sphingolipid metabolism, a conserved molecular pathway involved in development, obesity, and aging.

Keywords: Cardiocondyla obscurior; RNAseq; caste determination; developmental plasticity; sphingolipid; transcription factor binding site.


Figures

F<sc>ig</sc>. 1.
Fig. 1.
Phenotypes of Cardiocondyla obscurior. Fertilized, diploid eggs develop either into (a) queens (QU) or (b) workers (WO), whereas unfertilized eggs remain haploid and develop into males of either the (c) winged (WM) or (d) wingless, ergatoid phenotype (EM). (e) Development of a C. obscurior worker larva from egg to pupa. The red box indicates the approximate sampling period for RNAseq experiments.
F<sc>ig</sc>. 2.
Fig. 2.
(a) Distribution of raw read coverage per gene. The red dashed line indicates mean read count per gene. (b) Genewise mean–variance relationship suggesting high levels of biological variation between samples (Law et al. 2014). (c) MDS plot for the top 500 most variable genes. (d) Mean Euclidean distances (±SE) of MDS-scaled samples between all samples (overall) and within each caste fate.
F<sc>ig</sc>. 3.
Fig. 3.
(a) Number of differentially expressed genes for the six possible pairwise comparisons at different FDR cutoffs. (b) Summary of differential gene expression calls with six pairwise comparisons at an FDR of 0.05, NE, not expressed; NS, no significant difference in expression; 1–6; Number of genes with significant expression differences in 1–6 pairwise comparisons. (c) MA plots showing the mean expression across all 28 samples on the x-axis and the log-fold change for one over three other groups. Each dot represents one expressed gene, red dots show genes included in the compiled gene sets. Density plots show frequency distribution of all genes (blue) and of genes in the set genes (red). (d) Venn diagrams comparing phenotype-specific expression differences in WM, EM, QU, and WO. Each Venn diagram shows the number of genes with significantly higher (upper numbers) or lower expression (lower numbers) at an FDR < 0.05 in one, two, or three pairwise comparisons per caste fate. For each caste fate, sets of genes differentially expressed in all three pairwise comparisons (i.e., the central intersection) were used for enrichment analyses.
F<sc>ig</sc>. 4.
Fig. 4.
Transcription factor binding site enrichment for caste specific gene sets. The heat map shows the proportion of genes in the different gene sets that have at least one of the respective TFBSs in their promoter sequence. Numbers for significantly enriched/overrepresented TFBSs give the percentage of genes having the respective TFBS in their promotor. Asterisks indicate whether we found significant enrichment (pE < 0.01, asterisk at first position), overrepresentation (pP < 0.01, asterisk at second position), or both (two asterisks).
F<sc>ig</sc>. 5.
Fig. 5.
Schematic representation of the sphingomyelin cycle (central box) and its involvement with other developmental pathways and mechanisms (left and right boxes). (a) The central metabolism in sphingolipid biosynthesis (Walls et al. 2013) with the involved genes (left of arrows) and metabolic products (between arrows). (b) Differential expression of key genes of the sphingomyelin cycle. The heat map shows significant (FDR < 0.05) positive (dark blue) or negative (light blue) log fold changes for each of the six pairwise comparisons in sphingomyelin cycle and downstream genes (basket [bsk], hemipterous [hep], slipper [slpr]). CDase2 and bwa2 are homologs to the Drosophila CDase and bwa genes, respectively. NH, no homolog identified in C. obscurior; NE, not expressed; NS, no significant difference.

References

    1. Abouheif E, Wray GA. Evolution of the gene network underlying wing polyphenism in ants. Science. 2002;297:249–252. - PubMed
    1. Adachi-Yamada T, Gotoh T, Sugimura I, Tateno M, Nishida Y, Onuki T, Date H. De novo synthesis of sphingolipids is required for cell survival by down-regulating c-Jun N-terminal kinase in Drosophila imaginal discs. Mol Cell Biol. 1999;19:7276–7286. - PMC - PubMed
    1. Anders S. HTSeq: analysing high-throughput sequencing data with Python. 2010 Available from: http://www-huber.embl.de/users/anders/HTSeq/doc/overview.html. - PMC - PubMed
    1. Anders S, Huber W. Differential expression analysis for sequence count data. Genome Biol. 2010;11:R106. - PMC - PubMed
    1. Auer PL, Doerge RW. Statistical design and analysis of RNA sequencing data. Genetics. 2010;185:405–416. - PMC - PubMed

Publication types

LinkOut - more resources