. 2015 May 1:111:241-50.
doi: 10.1016/j.neuroimage.2015.02.036. Epub 2015 Feb 25.

Cortical thickness gradients in structural hierarchies

Affiliations

Cortical thickness gradients in structural hierarchies

Konrad Wagstyl et al. Neuroimage. .

Abstract

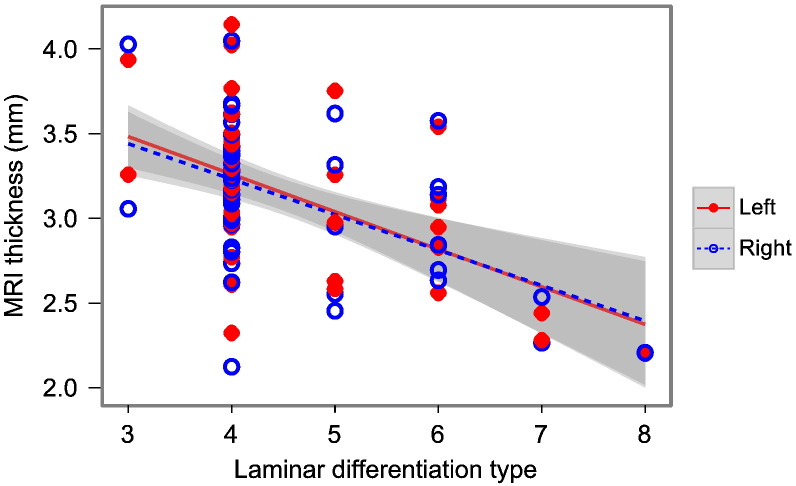
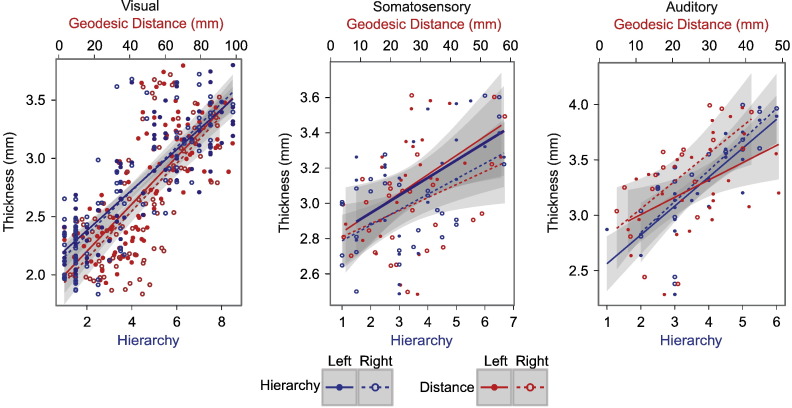
MRI, enabling in vivo analysis of cortical morphology, offers a powerful tool in the assessment of brain development and pathology. One of the most ubiquitous measures used-the thickness of the cortex-shows abnormalities in a number of diseases and conditions, but the functional and biological correlates of such alterations are unclear. If the functional connotations of structural MRI measures are to be understood, we must strive to clarify the relationship between measures such as cortical thickness and their cytoarchitectural determinants. We therefore sought to determine whether patterns of cortical thickness mirror a key motif of the cortex, specifically its structural hierarchical organisation. We delineated three sensory hierarchies (visual, somatosensory and auditory) in two species-macaque and human-and explored whether cortical thickness was correlated with specific cytoarchitectural characteristics. Importantly, we controlled for cortical folding which impacts upon thickness and may obscure regional differences. Our results suggest that an easily measurable macroscopic brain parameter, namely, cortical thickness, is systematically related to cytoarchitecture and to the structural hierarchical organisation of the cortex. We argue that the measurement of cortical thickness gradients may become an important way to develop our understanding of brain structure-function relationships. The identification of alterations in such gradients may complement the observation of regionally localised cortical thickness changes in our understanding of normal development and neuropsychiatric illnesses.


Figures

None
Graphical abstract
Fig. 1
Fig. 1
Distance measures. Geodesic distance measures the shortest path between two points across the white matter (or pial) surface of the cortex. Euclidean distance is the shortest distance through 3-dimensional space. White matter tract distance approximates the length of an axon connecting two regions.
Fig. 2
Fig. 2
Boundaries and parcellation. (a) Addressing individual variability in atlas-defined boundaries. The dashed red line represents an atlas boundary between the orange area with hierarchical level 1 and the blue area with hierarchical level two. Randomly parcellated regions crossed by the red line are given the mean of the hierarchical levels. (b) The random parcellation process is repeated 10 times, averaging cortical thickness values across parcellations to mitigate gyral–sulcal thickness differences (Fig. 3).
Fig. 3
Fig. 3
The effect of folding on cortical thickness. (a) The red line shows a sample path across the cortical surface. Gyri are visibly thicker than their adjacent sulci. (b) Unsmoothed MRI thickness values across one cortical hemisphere. Gyri are significantly thicker than sulci in a two-sample T-test (p < 0.001). (c) Hypothesised effect of folding on thickness values obscuring gradient. (d) Actual data taken from a sample path proceeding anteriorly from V1 in one subject. Averaging across 10 random surface parcellations mitigates the effect of gyral–sulcal position.
Fig. 4
Fig. 4
Macaque cortical thickness and cytoarchitecture. MRI thickness—corrected for folding—against laminar differentiation type (rs = − 0.39, p < 0.001). Laminar differentiation type is a cytoarchitectural ranking scale, with 6-layered primary sensory cortex having type 8, while less well differentiated cortical regions are given progressively lower rankings (Barbas, 1986; Barbas and Rempel-Clower, 1997; Dombrowski et al., 2001).
Fig. 5
Fig. 5
Macaque structural hierarchies. Graphs showing that cortical thickness correlates with structural hierarchy and geodesic distance from the primary sensory area in the macaque (see Table 1 for statistical results). Blue lines and points show that as hierarchical level increases cortical thickness (mm) also increases, for visual, somatosensory and auditory hierarchies. Red lines and points show geodesic distance (mm)—the putative surrogate of hierarchical level—increasing with cortical thickness for all three sensory hierarchies. Solid lines and filled circles show left hemisphere, dashed lines and hollow circles show right hemisphere.
Fig. 6
Fig. 6
Human structural hierarchies. Graphs show that cortical thickness increases with geodesic distance from the primary sensory area in human sensory cortices (see Table 1 for statistical results). Geodesic distance is used as a surrogate marker of structural hierarchical level. Upper graphs: data from all human subjects. Points represent mean thickness value for a random sample region across 83 subjects; error bars represent population standard deviation. Lines show linear models with grey 95% confidence band for population trend. Solid lines and filled circles show left hemisphere, dashed lines and hollow circles show right hemisphere. Lower graphs: trend lines of individual data from 10 subjects. These plots show the consistent structural gradients across individuals and also a degree inter-individual structural variability. This variability may be of interest in healthy development and psychopathology.
Fig. 7
Fig. 7
Human functional hierarchy. Cortical thickness (mm) increases with fMRI-derived functional hierarchical level (Grill-Spector and Malach, 2004) in humans (See Table 1 for statistical results). Points represent mean thickness value for a random sample region across 83 subjects; error bars represent population standard deviation. Lines show linear model with grey 95% confidence band for population trend. Solid lines and filled circles show left hemisphere, dashed lines and hollow circles show right hemisphere.
Fig. 8
Fig. 8
Visual cortex: cortical thickness, geodesic distance and hierarchical level for a single macaque and human. Left column: folding-corrected cortical thickness (mm) for the visual cortex with greyscale lines of iso-geodesic distance (mm) from the primary visual cortex (V1). Middle column: continuous measure of geodesic distance from V1. Right column: structural hierarchical level of visual regions based on axonal tracer studies in the macaque (Felleman and Van Essen, 1991) and functional hierarchical level of visual regions based on fMRI in the humans (Grill-Spector and Malach, 2004). Correlations between cortical thickness, geodesic distance and hierarchical level are highly significant (p < 0.001). Data overlaid on inflated left hemispheres, lateral and medial views. Rostral (R), caudal (C).
Fig. 9
Fig. 9
Somatosensory and auditory cortices: cortical thickness, geodesic distance and hierarchical level for a single macaque and human. Left column: folding-corrected cortical thickness (mm) with greyscale lines of iso-geodesic distance (mm) from the primary sensory cortex (S1 or A1). Middle column: continuous measure of geodesic distance from S1/A1. Right column: structural hierarchical level of somatosensory and auditory regions based on axonal tracer studies and cytoarchitecture in the macaque (Felleman and Van Essen, 1991; Barbas, 1986). Matching hierarchies and cortical parcellations were not available for humans. Correlations between cortical thickness, geodesic distance and hierarchical level are highly significant. Data overlaid on inflated left hemispheres, lateral views. Rostral (R), caudal (C).

References

    1. Amunts K., Schleicher A., Zilles K. Cytoarchitecture of the cerebral cortex—more than localization. NeuroImage. 2007;37:1061–1065. (discussion 1066–8) - PubMed
    1. Andrews T.J., Halpern S.D., Purves D. Correlated size variations in human visual cortex, lateral geniculate nucleus, and optic tract. J. Neurosci. 1997;17:2859–2868. - PMC - PubMed
    1. Badre D. Cognitive control, hierarchy, and the rostro-caudal organization of the frontal lobes. Trends Cogn. Sci. (Regul. Ed.) 2008;12:193–200. - PubMed
    1. Badre D., D'Esposito M. Is the rostro-caudal axis of the frontal lobe hierarchical? Nat. Rev. Neurosci. 2009;10:659–669. - PMC - PubMed
    1. Barbas H. Pattern in the laminar origin of corticocortical connections. J. Comp. Neurol. 1986;252:415–422. - PubMed

Publication types