. 2015 Feb 28;6(6):4330-44.
doi: 10.18632/oncotarget.3015.

Nuclear-encoded cytochrome c oxidase subunit 4 regulates BMI1 expression and determines proliferative capacity of high-grade gliomas

Affiliations

Nuclear-encoded cytochrome c oxidase subunit 4 regulates BMI1 expression and determines proliferative capacity of high-grade gliomas

Claudia R Oliva et al. Oncotarget. .

Abstract

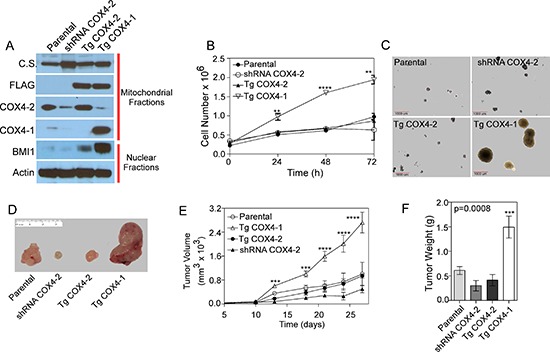
Nuclear-encoded cytochrome c oxidase subunit 4 (COX4) is a key regulatory subunit of mammalian cytochrome c oxidase, and recent studies have demonstrated that COX4 isoform 1 (COX4-1) could have a role in glioma chemoresistance. The Polycomb complex protein BMI1 is a stem cell regulatory gene implicated in the pathogenesis of many aggressive cancers, including glioma. This study sought to determine if COX4 regulates BMI1 and modulates tumor cell proliferation. Using The Cancer Genome Atlas database and a retrospective data set from patients with glioblastoma multiforme, we found that BMI1 expression levels positively correlated with COX4-1 expression and overall survival. Whereas COX4-1 promoted cell growth by increasing BMI1 expression, COX4-2 inhibited cell growth even in cells overexpressing BMI1. We also demonstrate that COX4-1 attenuates mitochondrial reactive oxygen species (ROS) production, which is required for COX4-1-mediated effects on BMI1 expression and cell proliferation. Notably, mice bearing COX4-1-expressing glioma cell xenografts quickly developed invasive tumors characterized by the presence of multiple lesions positive for Ki-67, BMI1, and COX4-1, whereas mice bearing COX4-2-expressing xenografts rarely developed tumors by this point. COX4-1 also promoted the self-renewal of glioma stem-like cells, consistent with the reported role of BMI1 in stem cell growth. Taken together, these findings identify a novel COX4-1-mitochondrial ROS axis, in which differential expression of COX4 isoforms regulates mitochondrial ROS production and controls BMI1 expression.


Figures

Figure 1
Figure 1. COX4-1 correlates with BMI1 expression and low OS of patients in primary GBM
(A) Scatter plot of PCR array data showing relative gene expression levels in UTMZ cells relative to U251 cells. Genes upregulated by more than 2-fold are shown in black circles, genes downregulated by more than 2-fold are shown in black squares. Arrow shows the data point representing BMI1. (B) Representative western blot (top) and quantitative analysis (bottom graph) showing the relative BMI1 expression levels in U251 and UTMZ cells. (C) Analysis of RNA-sequencing data provided by TCGA depicting co-expression of COX4I1 mRNA and BMI1 mRNA in patients with high-grade GBM. (D) Representative western blots depicting COX4-1 and BMI1 expression in a panel of 24 primary human GBM tumors. (E) Quantification of relative band intensities in (D) Numbers in parentheses indicate the mean value from all tumors. (F) OS for patients with high and low tumor expression levels of COX4-1 (P < 0.0001 by the log-rank test; hazard ratio for death in patients with high tumor COX4-1 expression, 54.99; 95% CI, 11.02 to 274.3) or BMI1 (P = 0.0113 by the log-rank test; hazard ratio for death in patients with high tumor BMI1 expression, 2.59; 95% CI, 2.107 to 3.073). Numbers in parentheses indicate the median survival time for each group.
Figure 2
Figure 2. COX4-1 drives proliferative capacity in human glioma cells
(A) COX4-1 and COX4-2 constructs ( pCMV6-COX4-1-FLAG and pCMV6-COX4-2-FLAG) were transfected into U251-COX4-2 depleted cells to create U251-TgCOX4-1 and U251-TgCOX4-2 stable cell lines. Expression of COX4 isoforms and BMI1 was detected in each cell line by western blot analysis. Citrate synthase (CS) expression is shown as mitochondrial loading control and actin expression is shown as nuclear loading control. (B) Proliferation rates of each cell line. (C) Representative pictures of clonogenic assays with each cell line, showing anchorage-independent cell growth. (D) Representative images of tumors from athymic nude mice inoculated with the cell lines. Tumors were excised 4 weeks after inoculation. (E) Analysis of tumor volumes in mice over the course of the experiment. (F) Comparison of tumor weights upon excision. Graphs represent the average from triplicate determinations from at least three independent experiments.
Figure 3
Figure 3. COX4-1 expression correlates with multicentric distribution of GBM within the brain parenchyma
Representative images of tumors resulting from intracranial implantation of U251 and U251-TgCOX4-1 glioma cells, stained for (A) H&E, (B) Ki-67, (C) COX4-1, (D) COX4-2, and (E) BMI1. Scale bar, 100 μm.
Figure 4
Figure 4. COX4-1 and BMI1 co-expression is required to promote cell proliferation
(A) Representative western blot depicting BMI1 expression in nuclear extracts of U251-TgCOX4-1 cell following 24-h PTC-209 treatment (0–10 μM). (B) Cell proliferation in control and PTC-209-treated (5 μM) U251-TgCOX4-1 cells. (C) Representative western blot depicting BMI1 expression in U251-TgCOX4-1 cells expressing shRNA control or one of four different vectors expressing shRNA against BMI1. (D) Quantification of the relative expression levels of BMI1 detected in (C). (E) Cell proliferation in clones expressing shRNA against BMI1. (F) Representative western blot depicting BMI1 expression levels (inset) and the cell proliferation rates of control and pCMV6-BMI1-transfected U251 cells. Graphs represent the average from triplicate determinations from at least three independent experiments.
Figure 5
Figure 5. COX4-1 expression induces changes in mitochondrial function
(A) Relative activity of CcO normalized to citrate synthase (CS) activity. (B) Oxygen consumption rates were determined using a respirometer. Representative traces of cellular respiration rates of U251 (black) and U251-TgCOX4-1 (red) cells (blue line, oxygen concentration). (C) Kinetic characterization of glutamate/malate, succinate, and fatty acid-dependent respiration of U251-TgCOX4-1 and U251-TgCOX4-2 cells. (D) Kinetic characterization of FCCP-dependent respiration in U251-TgCOX4-1 and U251-TgCOX4-2 cells. (E) Dose-response analyses of glucose uptake in cell lines expressing different COX4 isoforms. Graphs represent the average from triplicate determinations from at least three independent experiments.
Figure 6
Figure 6. Mitochondrial ROS regulates BMI1 expression
(A) Representative histograms from flow cytometric analysis of total cellular ROS (left, DCFDA fluorescence) and mitochondrial ROS (right, MitoSOX fluorescence) in parental and U251-TgCOX4-1 cells. Bar graphs provide quantitative analysis of fluorescence intensity. (B) Quantitative graphs showing the relative levels of catalase activity, superoxide dismutase activity, NAD+/NADH ratio, and GSH/GSSG ratio in U251-TgCOX4-1 cells. (C) Representative histograms from flow cytometric analysis of total cellular or mitochondrial ROS production in U251-TgCOX4-2 cells treated with NAC (300 μM) or PTC-209 (5 μM) (left) and in U251-TgCOX4-1 cells treated with NMP (10 μM) or PTC-209 (right). (D) Representative western blots depicting BMI1 expression in the nuclear extracts of parental cells or U251-TgCOX4-1 cells after treatment with NAC or PTC-209 for 24 h (top) and quantitative analysis of expression levels (bottom). Bars represent the average from triplicate determinations from at least three independent experiments.
Figure 7
Figure 7. COX4-1 glioma cells form neurosphere-like tumor spheroids expressing neural stem cell markers
(A) Representative phase contrast photomicrographs (10× magnification) of parental U251, U251-shRNA-COX4-2, U251-TgCOX4-1, and U251-TgCOX4-2 cells after 10 days of culture in serum-free Neurobasal medium supplemented with EGF and FGF. (B) Spheroids of U251-TgCOX4-1 cells were immunostained with antibodies against COX4-1, BMI1, or CD133 or with control antibodies. (C) In vitro limiting dilution assays and quantification of COX4-1 and BMI1 expressing cells. Results represent the average from two independent experiments. (D) Spheroid multipotency was assessed by immunofluorescence for neuronal (neurofilament, CNPase, and βIII-tubulin) and glial (GFAP) markers.

References

    1. Grossman LI, Lomax MI. Nuclear genes for cytochrome c oxidase. Biochimica et biophysica acta. 1997;1352:174–192. - PubMed
    1. Kadenbach B, Huttemann M, Arnold S, Lee I, Bender E. Mitochondrial energy metabolism is regulated via nuclear-coded subunits of cytochrome c oxidase. Free radical biology & medicine. 2000;29:211–221. - PubMed
    1. Oliva CR, Moellering DR, Gillespie GY, Griguer CE. Acquisition of chemoresistance in gliomas is associated with increased mitochondrial coupling and decreased ROS production. PloS one. 2011;6:e24665. - PMC - PubMed
    1. Oliva CR, Nozell SE, Diers A, McClugage SG, 3rd, Sarkaria JN, Markert JM, Darley-Usmar VM, Bailey SM, Gillespie GY, Landar A, Griguer CE. Acquisition of temozolomide chemoresistance in gliomas leads to remodeling of mitochondrial electron transport chain. The Journal of biological chemistry. 2010;285:39759–39767. - PMC - PubMed
    1. Campian JL, Gao X, Qian M, Eaton JW. Cytochrome C oxidase activity and oxygen tolerance. The Journal of biological chemistry. 2007;282:12430–12438. - PubMed

Publication types

MeSH terms

Substances