. 2015 Jul;236(3):326-36.
doi: 10.1002/path.4527. Epub 2015 Apr 21.

NF-κB1, NF-κB2 and c-Rel differentially regulate susceptibility to colitis-associated adenoma development in C57BL/6 mice

Affiliations

NF-κB1, NF-κB2 and c-Rel differentially regulate susceptibility to colitis-associated adenoma development in C57BL/6 mice

Michael D Burkitt et al. J Pathol. 2015 Jul.

Abstract

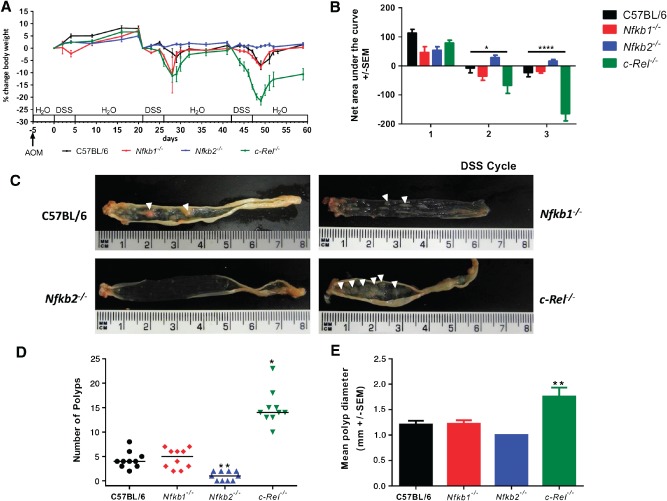
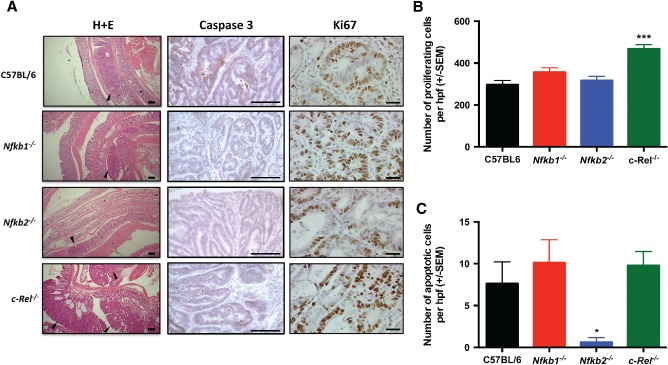
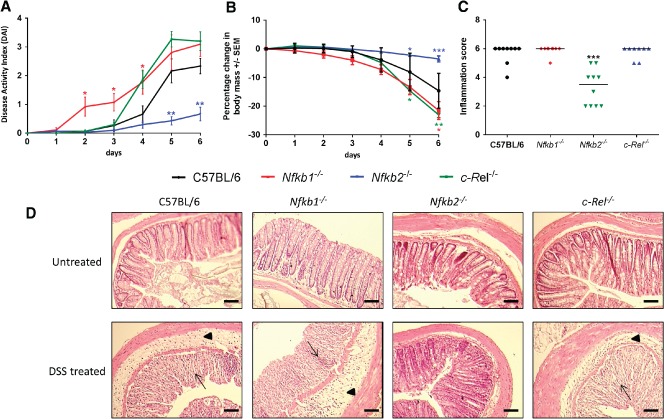
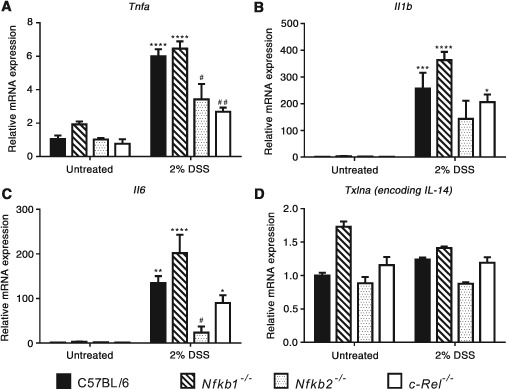
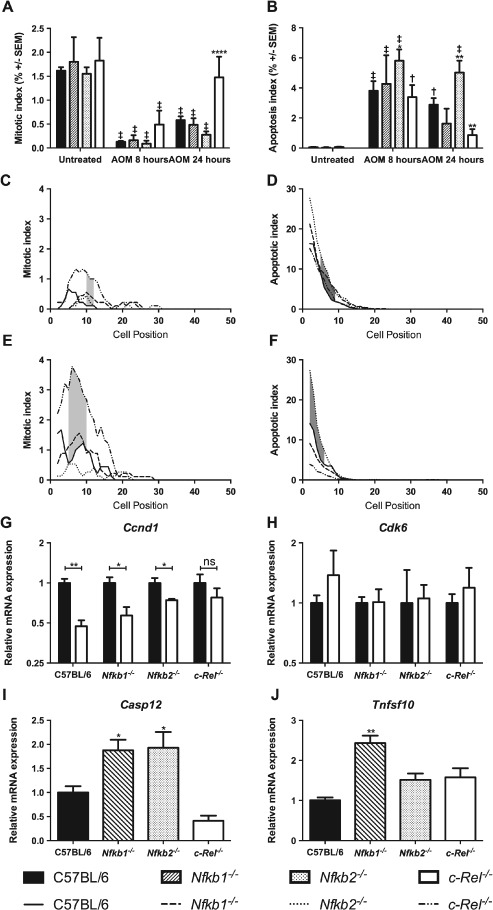
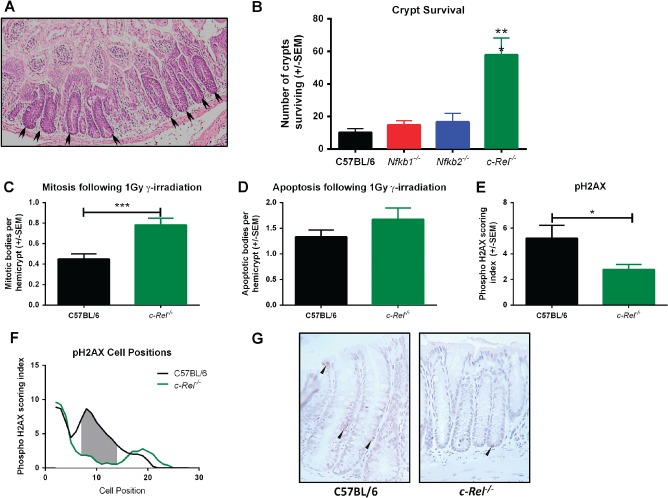
NF-κB signalling is an important factor in the development of inflammation-associated cancers. Mouse models of Helicobacter-induced gastric cancer and colitis-associated colorectal cancer have demonstrated that classical NF-κB signalling is an important regulator of these processes. In the stomach, it has also been demonstrated that signalling involving specific NF-κB proteins, including NF-κB1/p50, NF-κB2/p52, and c-Rel, differentially regulate the development of gastric pre-neoplasia. To investigate the effect of NF-κB subunit loss on colitis-associated carcinogenesis, we administered azoxymethane followed by pulsed dextran sodium sulphate to C57BL/6, Nfkb1(-/-), Nfkb2(-/-), and c-Rel(-/-) mice. Animals lacking the c-Rel subunit were more susceptible to colitis-associated cancer than wild-type mice, developing 3.5 times more colonic polyps per animal than wild-type mice. Nfkb2(-/-) mice were resistant to colitis-associated cancer, developing fewer polyps per colon than wild-type mice (median 1 compared to 4). To investigate the mechanisms underlying these trends, azoxymethane and dextran sodium sulphate were administered separately to mice of each genotype. Nfkb2(-/-) mice developed fewer clinical signs of colitis and exhibited less severe colitis and an attenuated cytokine response compared with all other groups following DSS administration. Azoxymethane administration did not fully suppress colonic epithelial mitosis in c-Rel(-/-) mice and less colonic epithelial apoptosis was also observed in this genotype compared to wild-type counterparts. These observations demonstrate different functions of specific NF-κB subunits in this model of colitis-associated carcinogenesis. NF-κB2/p52 is necessary for the development of colitis, whilst c-Rel-mediated signalling regulates colonic epithelial cell turnover following DNA damage.

Keywords: NF-κB; azoxymethane; colitis; colorectal cancer; dextran sulphate sodium; p68 c-Rel.


Figures

Figure 1
Figure 1
AOM and pulsed low‐dose DSS in C57BL/6, Nfkb1−/−, Nfkb2−/−, and c‐Rel−/− mice. (A) Percentage change of body weight during AOM and DSS exposure. (B) Area under the curve analysis for panel A. Data separated into first, second, and third DSS cycles. Differences tested by two‐way ANOVA and Dunnett's post‐hoc test. *p < 0.05, ****p < 0.0001 for c‐Rel−/− relative to wild type (WT). (C) Gross colonic pathology from mice of each genotype. Polypoid colonic lesions are marked with an arrowhead. (D) Number of polyps per mouse; horizontal line at median. Differences tested by Kruskal–Wallis one‐way ANOVA and Dunn's multiple comparison tests. *p < 0.05, **p < 0.01 versus WT. (E) Mean polyp diameter per mouse. Differences tested by one‐way ANOVA and Dunnett's post‐hoc test. **p < 0.01 versus WT. Ten mice per group.
Figure 2
Figure 2
Histology induced by AOM/DSS in C57BL/6, Nfkb1−/−, Nfkb2−/−, and c‐Rel−/− mice. (A) H&E‐, cleaved caspase 3‐, and Ki67‐stained sections from mice following DSS/AOM treatment. Arrowheads highlight adenomas. (B) Mean number of Ki67‐positive cells per hpf within adenomas. (C) Mean number of cleaved caspase 3‐positive cells per hpf within adenomas. Significant differences tested by one‐way ANOVA and Dunnett's test for multiple comparisons. *p < 0.05, ****p < 0.0001 versus WT. Ten mice per group.
Figure 3
Figure 3
Impact of acute DSS administration on C57BL/6, Nfkb1−/−, Nfkb2−/−, and c‐Rel−/− mice. (A) Clinical disease activity index plotted daily during DSS administration and recovery. Differences tested by Kruskal–Wallis one‐way ANOVA and Dunn's multiple comparison test at each time point. *p < 0.05, **p < 0.01 relative to WT. (B) Percentage change in body weight each day during DSS administration (mean and SEM). (C) Histological inflammation score per mouse; horizontal line at median. Differences tested by one‐way ANOVA and Dunnett's multiple comparison test. *p < 0.05, **p < 0.01, ***p < 0.001 versus WT. (D) Representative H&E‐stained sections of distal colon from mice following 2% DSS treatment (7–10 mice per group). Arrowheads highlight submucosal oedema; arrows highlight almost complete loss of colonic epithelium.
Figure 4
Figure 4
(A–D) Relative expression of the indicated cytokines in untreated and 2% DSS‐treated mice determined by real‐time PCR. Comparisons. * denotes significant difference between untreated and DSS‐treated mice of the same genotype. # denotes significant difference between DSS‐treated WT and DSS‐treated transgenic mice tested by two‐way ANOVA and Dunnett's multiple comparison test. One symbol = p < 0.05; two symbols = p < 0.01; three symbols = p < 0.001; four symbols = p < 0.0001 (four mice per group).
Figure 5
Figure 5
Effect of administration of 10 mg/kg AOM on cell turnover in the distal colon 8 and 24 h after administration in C57BL/6, Nfkb1−/−, Nfkb2−/−, and c‐Rel−/− mice. (A) Mean percentage of cells morphologically mitotic in untreated mice and mice 8 or 24 h following AOM treatment. (B) Mean percentage of cells morphologically apoptotic in untreated mice and mice 8 or 24 h following AOM treatment. Differences were tested by two‐way ANOVA and Dunnett's test for multiple comparisons. * denotes significant difference between AOM‐treated WT and AOM‐treated transgenic mice at the same time point. *p < 0.05, **p < 0.01, ****p < 0.0001. and denote significant difference between untreated and AOM‐treated mice of the same genotype. p < 0.01, p < 0.0001. All analyses performed on groups of six mice. (C–F) Cell positional plots of mitotic cells (C, E) or apoptotic cells (D, F) 8 h (C, D) or 24 h after treatment with AOM (E, F). Shaded areas identify cell positions where a significant difference in mitotic index was detected between WT and c‐Rel−/− mice (C, E), or in apoptotic index WT and Nfkb2−/− mice (D, F) by modified median test, p < 0.05. (G, H) Relative expression of the indicated mRNAs in colonic mucosa of untreated mice (black bars) and mice 8 h after AOM administration (white bars). Differences tested by two‐way ANOVA and Dunnett's test for multiple comparisons; *p < 0.005, **p < 0.001 versus untreated mice of the same genotype. ns = not significant. (I, J) Relative expression of the indicated mRNAs in colonic mucosa 8 h after AOM administration. Significant differences in linearized expression values tested in n = 4 mice by one‐way ANOVA and Dunnett's test for multiple comparisons. *p < 0.005, **p < 0.001 versus WT.
Figure 6
Figure 6
Crypt survival following γ‐irradiation in the colons of C57BL/6, Nfkb1−/−, Nfkb2−/−, and c‐Rel−/− mice. (A) H&E‐stained sections of c‐Rel−/−colon 96 h following 12 Gy γ‐irradiation. Arrowheads highlight regenerating crypts. (B) Mean number of surviving crypts per circumference of colon 96 h following 12 Gy γ‐irradiation. Differences tested by one‐way ANOVA and Dunnett's multiple comparison test. ***p < 0.001 versus WT (six mice per group). (C–E) Mean percentages of colonocytes from C57BL/6 or c‐Rel−/− mice with morphologically mitotic (C), morphologically apoptotic (D), or expressing pH2AX (E) 4.5 h following 1 Gy γ‐irradiation (two‐tailed Student's t‐test *p < 0.05, ***p < 0.001). (F) Cell positional plot of pH2AX‐expressing cells 4.5 h following 1 Gy γ‐irradiation. Shaded area marks cell positions where a significant difference in pH2AX staining index was detected by modified median test, p < 0.05. (G) Representative photomicrographs of pH2AX staining in colonic mucosa following 1 Gy γ‐irradiation.

References

    1. Gillen CD, Walmsley RS, Prior P, et al. Ulcerative colitis and Crohn's disease: a comparison of the colorectal cancer risk in extensive colitis. Gut 1994; 35 : 1590–1592. - PMC - PubMed
    1. Eaden JA, Abrams KR, Mayberry JF. The risk of colorectal cancer in ulcerative colitis: a meta‐analysis. Gut 2001; 48: 526–535. - PMC - PubMed
    1. Rutter MD, Saunders BP, Wilkinson KH, et al. Cancer surveillance in longstanding ulcerative colitis: endoscopic appearances help predict cancer risk. Gut 2004; 53: 1813–1816. - PMC - PubMed
    1. Rutter M, Saunders B, Wilkinson K, et al. Severity of inflammation is a risk factor for colorectal neoplasia in ulcerative colitis. Gastroenterology 2004; 126: 451–459. - PubMed
    1. Eckmann L, Nebelsiek T, Fingerle AA, et al. Opposing functions of IKKbeta during acute and chronic intestinal inflammation. Proc Natl Acad Sci U S A 2008; 105: 15058–15063. - PMC - PubMed

Publication types

MeSH terms