. 2015 Mar 2:6:6250.
doi: 10.1038/ncomms7250.

Structure and function of lysosomal phospholipase A2 and lecithin:cholesterol acyltransferase

Affiliations

Structure and function of lysosomal phospholipase A2 and lecithin:cholesterol acyltransferase

Alisa Glukhova et al. Nat Commun. .

Abstract

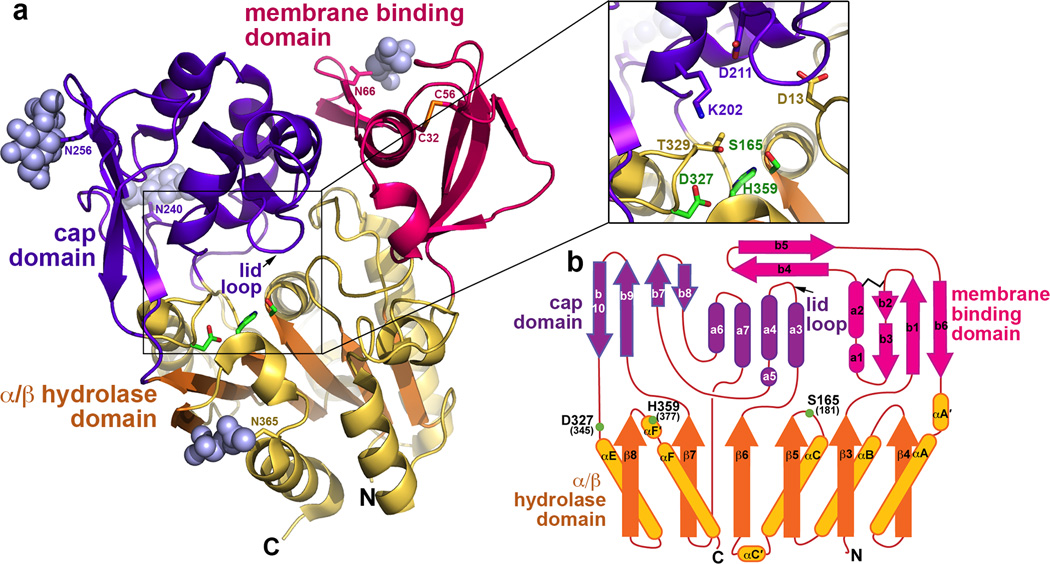
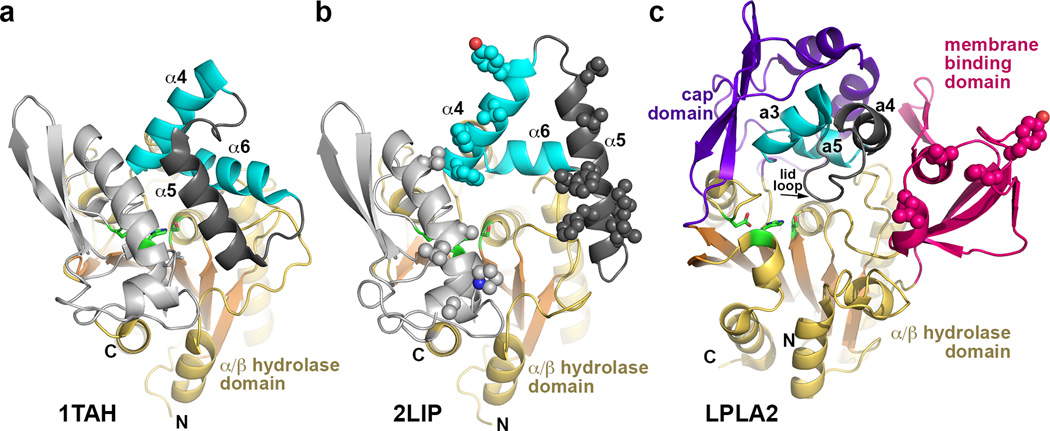
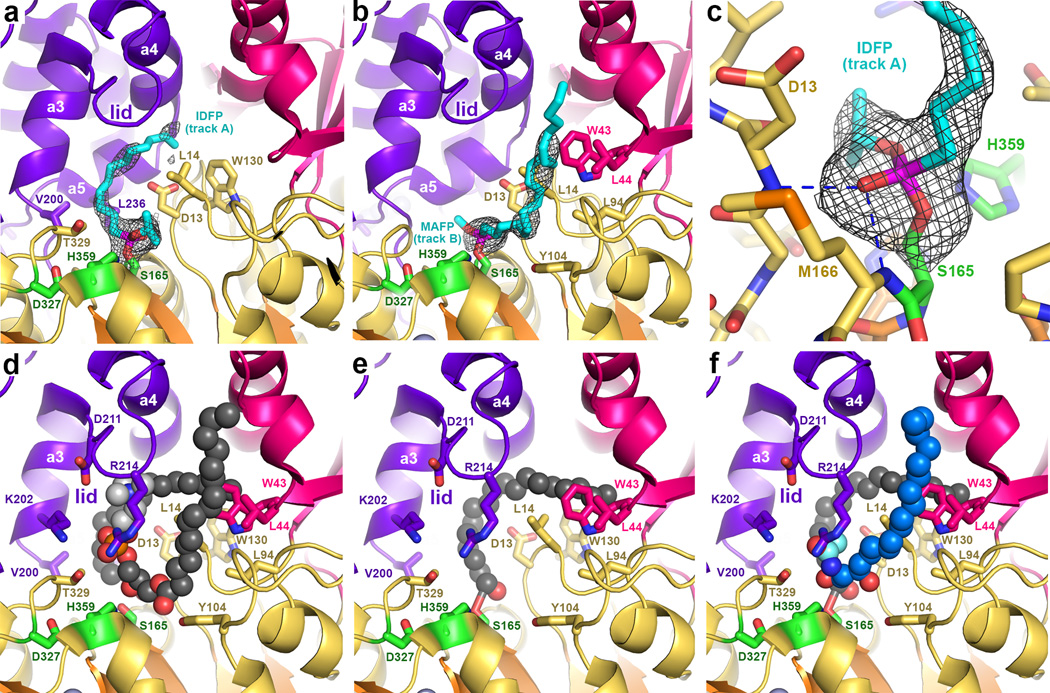
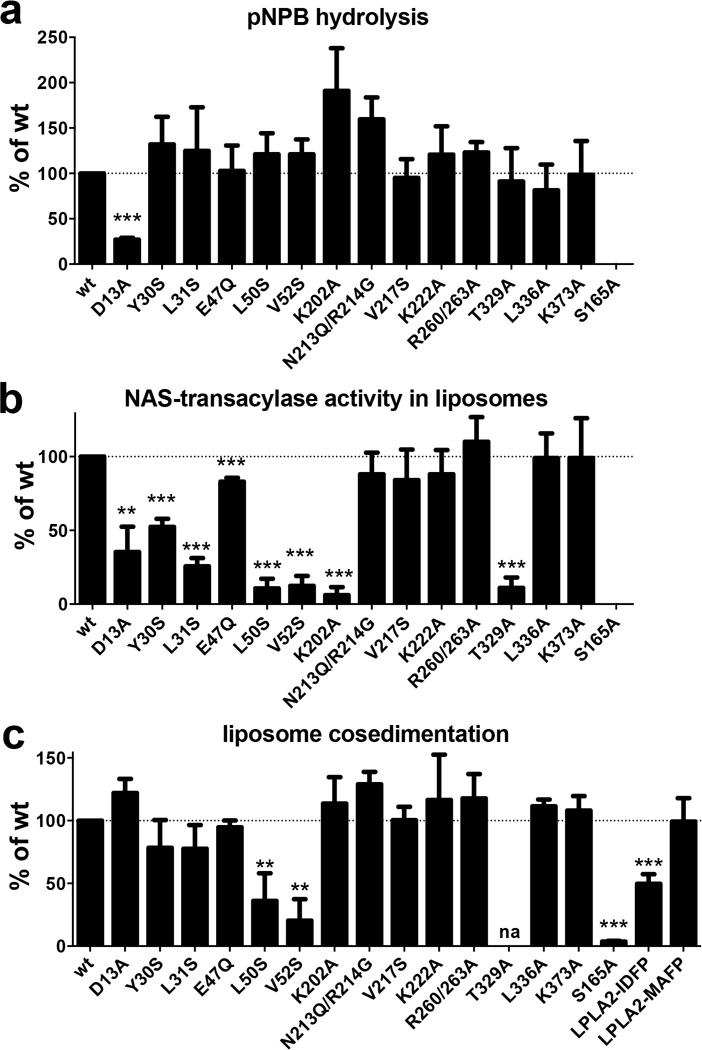
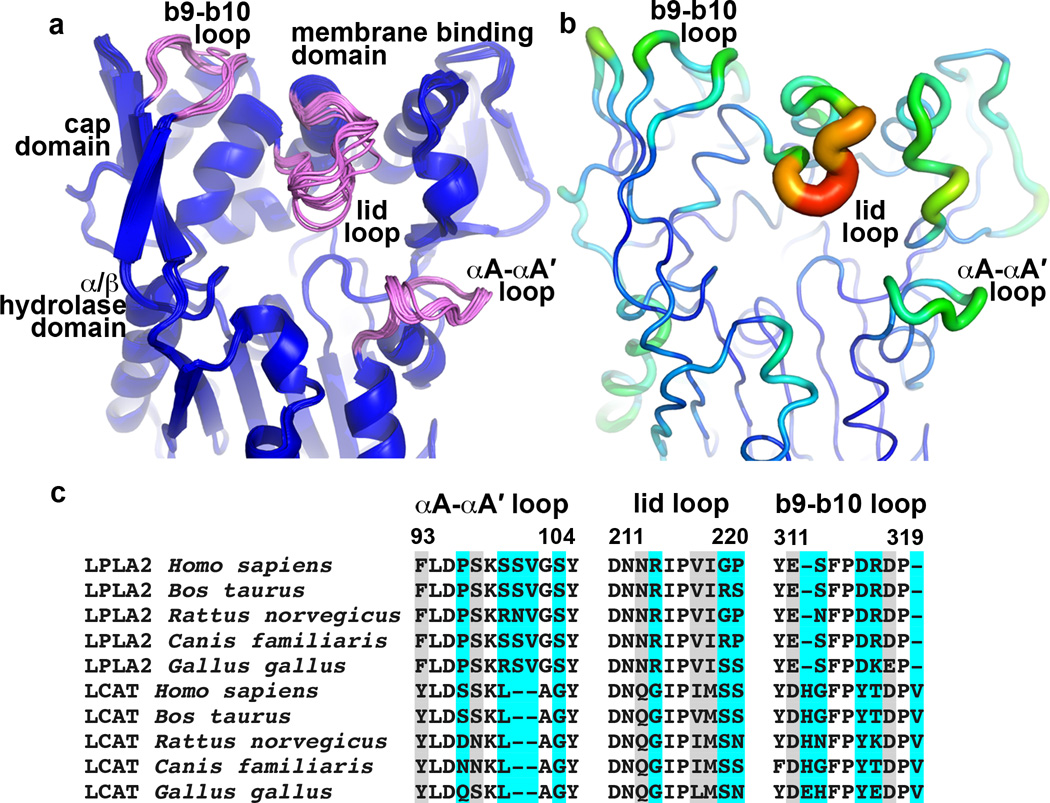
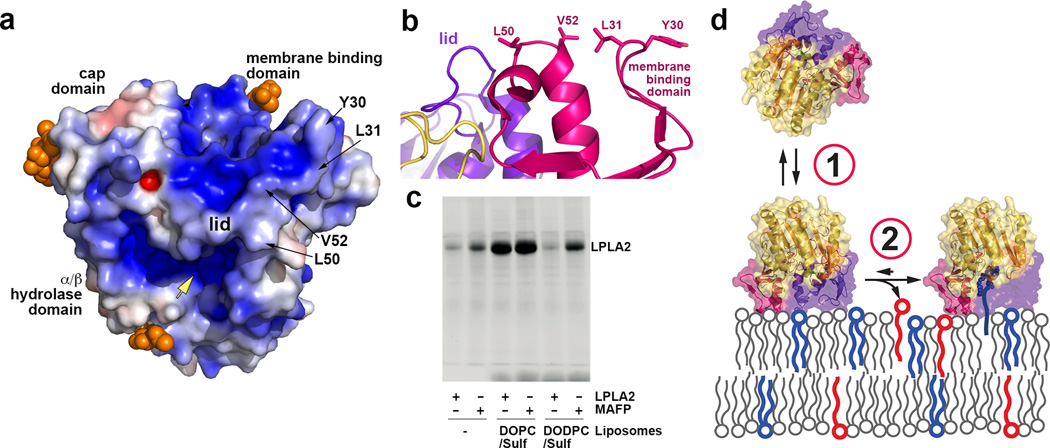
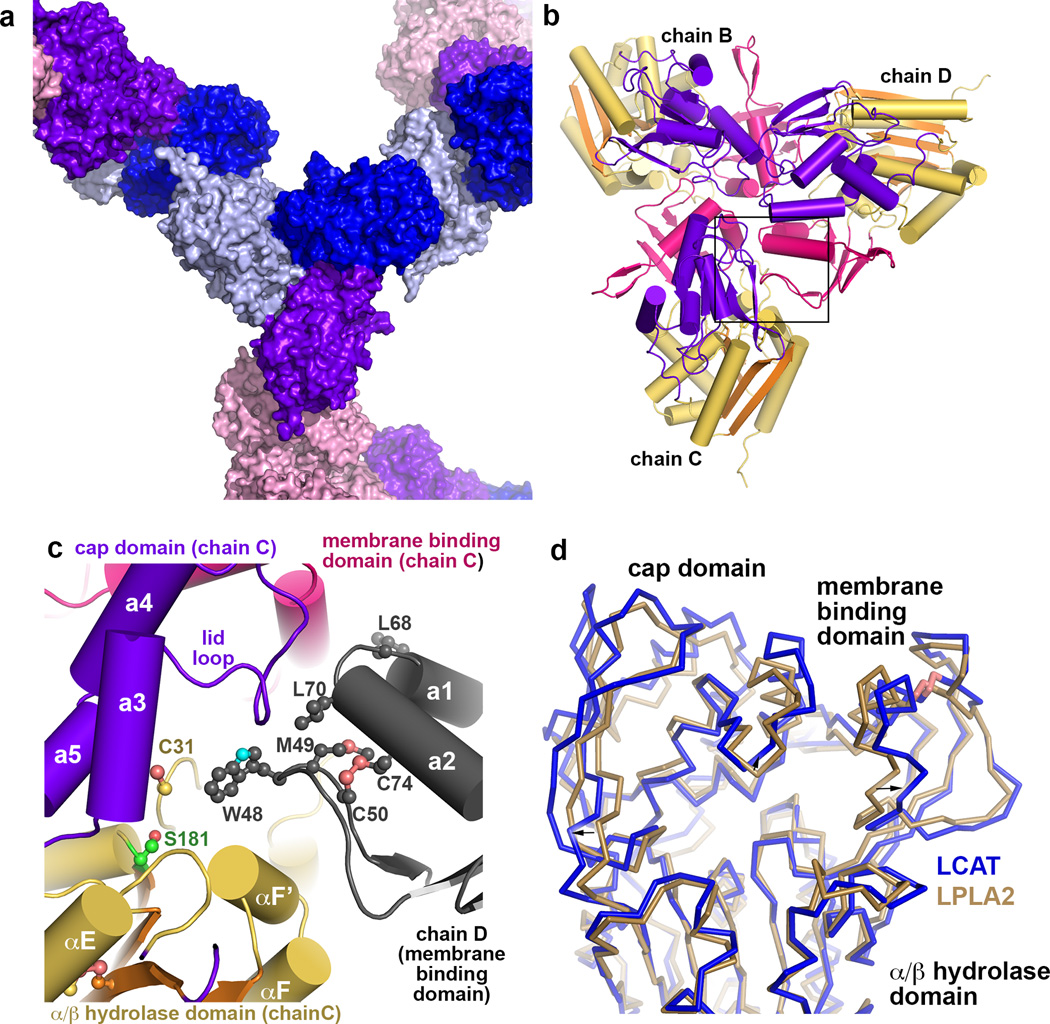
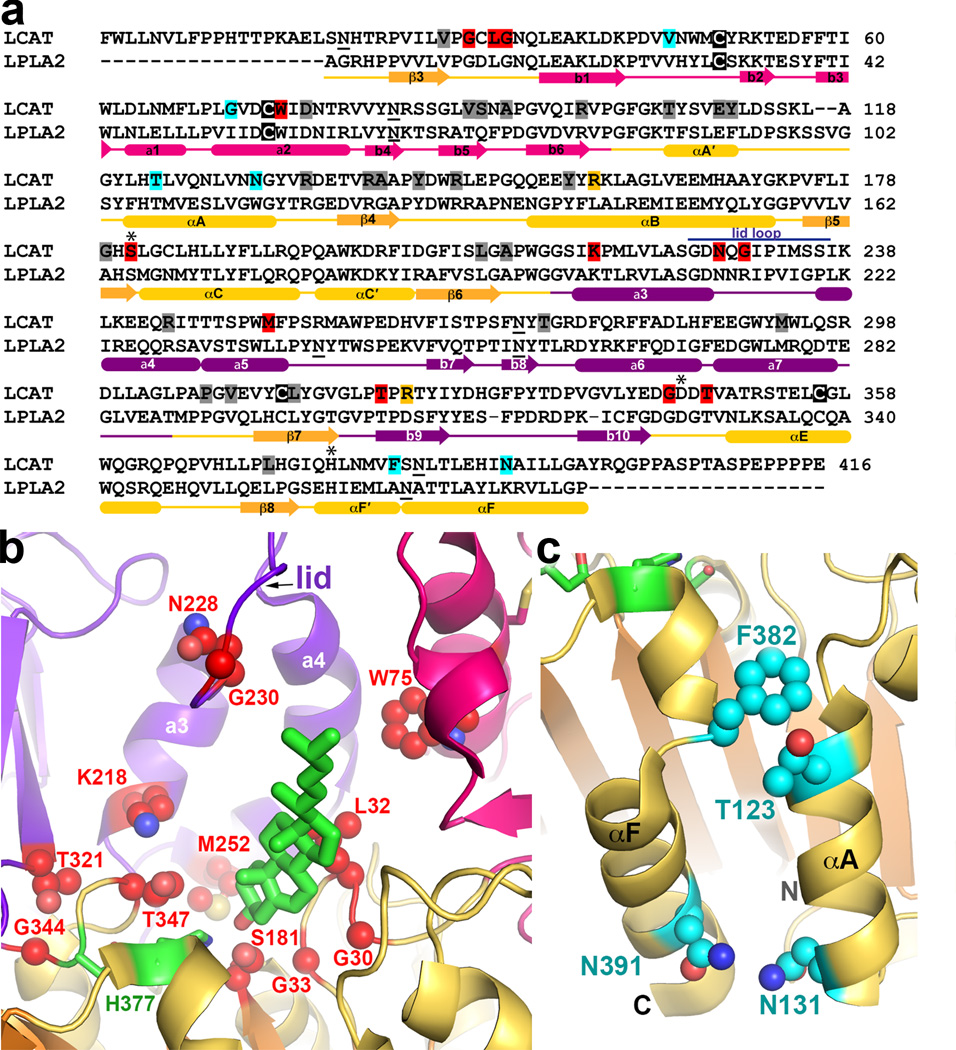
Lysosomal phospholipase A2 (LPLA2) and lecithin:cholesterol acyltransferase (LCAT) belong to a structurally uncharacterized family of key lipid-metabolizing enzymes responsible for lung surfactant catabolism and for reverse cholesterol transport, respectively. Whereas LPLA2 is predicted to underlie the development of drug-induced phospholipidosis, somatic mutations in LCAT cause fish eye disease and familial LCAT deficiency. Here we describe several high-resolution crystal structures of human LPLA2 and a low-resolution structure of LCAT that confirms its close structural relationship to LPLA2. Insertions in the α/β hydrolase core of LPLA2 form domains that are responsible for membrane interaction and binding the acyl chains and head groups of phospholipid substrates. The LCAT structure suggests the molecular basis underlying human disease for most of the known LCAT missense mutations, and paves the way for rational development of new therapeutics to treat LCAT deficiency, atherosclerosis and acute coronary syndrome.


Figures

Figure 1
Figure 1
Architecture of LPLA2. (a) The α/β hydrolase (gold with orange strands), membrane binding (magenta), and cap (purple) domains associate to form a large concave active site cleft. Catalytic triad residues are drawn with green carbons. N-acetylglucosamine sugars (grey spheres) are observed at Asn66, Asn240, Asn256, and Asn365. The sole disulfide bond between Cys32 and 56 is drawn with yellow sulfur atoms. Inset displays a close up view of the catalytic triad region. (b) LPLA2 topology diagram. Because LPLA2 lacks the first two β strands of the canonical α/β hydrolase fold, the first strand of this domain is denoted as β3 . Residues composing the LPLA2 catalytic triad are labeled and indicated with green spheres. To distinguish between α-helixes and β-strands composing cap and membrane binding domains from those in the α/β hydrolase domain, secondary elements of the later domains are designated with Greek letters. LCAT has the same topology as LPLA2, and corresponding residue numbers are shown in parentheses.
Figure 2
Figure 2
Structural comparison of Family I triacylglycerol lipases with LPLA2. These enzymes all feature a similar α/β hydrolase core and cap domains that contain a topologically and structurally similar motif consisting of two helices (cyan) joined by a flexible loop (dark grey). In the bacterial lipase family, the α5 helix within this loop functions as an active site lid in the closed state and as a membrane-binding element in the open state. (a) Closed conformation of triacylglycerol lipase from Pseudomonas glumae (PDB entry 1TAH). (b) Open conformation of Pseudomonas cepacia lipase (PDB entry 2LIP). Potential membrane binding residues are shown as spheres. (c) In comparison, LPLA2 seems to exhibit an open conformation, and the membrane binding domain occupies a similar topological location with respect to the active site as the α5 helix in its open configuration in panel B. Hydrophobic residues shown to be involved in membrane binding are shown as spheres. The lid loop and subsequent a4 helix of the cap domain (dark gray) is topologically equivalent to α5 in panels A and B.
Figure 3
Figure 3
Complexes with fluorophosphonate inhibitors help define the catalytic cycle of LPLA2. (a) IDFP (cyan sticks) occupying track A (cf. Supplementary Fig. 5a). Wire cages in panels a-c correspond to 2.5 σ |Fo|-|Fc| omit maps. (b) MAFP (cyan sticks) occupying track B. (c) Backbone amides of Asp13 and Met166 form the oxyanion hole of LPLA2 and coordinate the phosphonate group. (d) Model of POPC (spheres) bound in the active site such that its sn-2 chain occupies track A, and sn-1 chain track B. The head group (light grey spheres) is coordinated by Lys202, Asp211, and Thr329. (e) After dissociation of the lysophosphatidylcholine product, the acyl intermediate remains in track A, which would allow His359 to deprotonate an incoming alcohol nucleophile. (f) Model of NAS (blue spheres, cyan acetyl group) bound in track B.
Figure 4
Figure 4
LPLA2 enzymatic activity and liposome binding. (a) Hydrolysis of the soluble substrate pNPB at pH 7.5. Only D13A was significantly different from wild-type (wt). (b) Transacylase assay using NAS-DOPC-sulfatide liposomes. (c) LPLA2 co-sedimentation with DOPC-sulfatide liposomes. LPLA2 was incubated with liposomes containing DOPC and sulfatide following ultracentrifugation. Amount of LPLA2 associated with membrane fraction was quantified and compared to wild-type (wt) LPLA2. Error bars represent the standard deviation of three independent experiments.(** 0.001<p<0.01, ***p<0.001. na, not assayed due to poor protein expression; Student’s t-test)
Figure 5
Figure 5
Conformational and sequence variability in LPLA2. (a) Structural alignment of 16 unique LPLA2 chains from all of the unique LPLA2 crystal forms (Table 1 and Supplementary Tables 1–2). Loops with highest RMSD scores (b9-b10 loop and lid loop of cap domain, and αA-αA´ of catalytic core) are shown in pink. (b) Temperature factor distribution is consistent with the conformational variability in panel A. Chain A of the ligand free LPLA2 structure with B-factors indicated by color (blue to red, 13 to 44 Å2) and by width of the Cα trace. (c) Sequence alignment of the most flexible LPLA2 loops with those of LCAT from the same species. Cyan and grey highlights indicate positions that are variable and highly conserved between LPLA2 and LCAT subfamilies, respectively. No highlight indicates invariance.
Figure 6
Figure 6
LPLA2 membrane association. (a) Electrostatic surface potential (± 5 kT/e) of LPLA2 at pH 5. Glycosylation sites (orange spheres) would not sterically interfere with the interaction between the membrane binding domain and lipid bilayers. Yellow arrow indicates the entrance into the active site. (b) The membrane binding surface of LPLA2. (c) LPLA2 requires either MAFP modification or substrate liposomes (DOPC-sulfatide) to stably associate with liposomes in pull down assays. Data shown are representative of four independent experiments. (d) Membrane association model. First, transient membrane binding is driven by complimentary electrostatic charge and the hydrophobic patch on the membrane binding domain. Second, formation of covalent acyl intermediate tethers LPLA2 at the membrane.
Figure 7
Figure 7
Structure of human LCAT. (a) Surface representation showing lattice contacts in LCAT crystals, which contain 87% solvent (including sugar modifications estimated at 20 kDa ). Each unique monomer in the asymmetric unit is colored separately, and the four subunits form two homotrimers in the lattice, one non-crystallographic (chains B, C and D) and one crystallographic (chain A). (b) Non-crystallographic trimer formed by chains B, C, and D. There is, however, no evidence for oligomerization of LCAT in solution as assessed by size exclusion chromatography (data not shown). Domains are colored as for LPLA2 in Fig. 1. (c) Crystal contacts exploit the predicted membrane binding patch of LCAT, which packs into track B of each three-fold symmetry related subunit. (d) Structural variance in the membrane binding and cap domains of LPLA2 (gold Cα trace) and LCAT (blue Cα trace). The catalytic domains of LCAT and LPLA2 were aligned. Structural elements of LCAT that bracket the active site (arrows) seem to expand outwards by up to 4 Å relative to LPLA2.
Figure 8
Figure 8
FLD and FED somatic mutations of LCAT. (a) Sequence alignment of mature human LPLA2 and LCAT. Mutated positions predicted to have structural defects are highlighted gray, catalytic defects red, HDL binding defects cyan, and undetermined yellow. Cysteines involved in disulfide bonds are highlighted in black. N-linked glycosylation sites are underlined. Purple line indicates the lid loop of LPLA2. (b) Mutations affecting the LCAT active site (side chains shown as red spheres) cluster around the catalytic triad (green carbons) and predicted cholesterol (green stick model) binding site. (c) FED mutations (side chains shown as cyan spheres) tend to be found on the surface of the protein. The most prominent cluster is localized on the catalytic domain close to the N and C-termini of the enzyme.

References

    1. Shayman JA, Kelly R, Kollmeyer J, He Y, Abe A. Group XV phospholipase A2, a lysosomal phospholipase A2 . Prog. Lipid Res. 2011;50:1–13. - PMC - PubMed
    1. Kunnen S, Van Eck M. Lecithin:cholesterol acyltransferase: old friend or foe in atherosclerosis? J. Lipid Res. 2012;53:1783–1799. - PMC - PubMed
    1. Abe A, et al. Lysosomal phospholipase A2 is selectively expressed in alveolar macrophages. J. Biol. Chem. 2004;279:42605–42611. - PubMed
    1. Hiraoka M, et al. Lysosomal phospholipase A2 and phospholipidosis. Mol. Cell. Biol. 2006;26:6139–6148. - PMC - PubMed
    1. Paduraru C, et al. Role for lysosomal phospholipase A2 in iNKT cell-mediated CD1d recognition. Proc. Natl. Acad. Sci. U.S.A. 2013;110:5097–5102. - PMC - PubMed

Publication types

MeSH terms