. 2015 Mar:64:97-106.
doi: 10.1016/j.jcv.2015.01.011. Epub 2015 Jan 17.

Molecular classification of outcomes from dengue virus -3 infections

Affiliations

Molecular classification of outcomes from dengue virus -3 infections

Allan R Brasier et al. J Clin Virol. 2015 Mar.

Abstract

Objectives: Dengue virus (DENV) infection is a significant risk to over a third of the human population that causes a wide spectrum of illness, ranging from sub-clinical disease to intermediate syndrome of vascular complications called dengue fever complicated (DFC) and severe, dengue hemorrhagic fever (DHF). Methods for discriminating outcomes will impact clinical trials and understanding disease pathophysiology.

Study design: We integrated a proteomics discovery pipeline with a heuristics approach to develop a molecular classifier to identify an intermediate phenotype of DENV-3 infectious outcome.

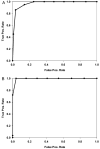
Results: 121 differentially expressed proteins were identified in plasma from DHF vs dengue fever (DF), and informative candidates were selected using nonparametric statistics. These were combined with markers that measure complement activation, acute phase response, cellular leak, granulocyte differentiation and viral load. From this, we applied quantitative proteomics to select a 15 member panel of proteins that accurately predicted DF, DHF, and DFC using a random forest classifier. The classifier primarily relied on acute phase (A2M), complement (CFD), platelet counts and cellular leak (TPM4) to produce an 86% accuracy of prediction with an area under the receiver operating curve of >0.9 for DHF and DFC vs DF.

Conclusions: Integrating discovery and heuristic approaches to sample distinct pathophysiological processes is a powerful approach in infectious disease. Early detection of intermediate outcomes of DENV-3 will speed clinical trials evaluating vaccines or drug interventions.

Keywords: Acute phase reaction; Biomarker pipeline; Dengue; Selected reaction monitoring.


Figures

Figure 1
Figure 1. Schematic of classification strategy
Schematic view of strategy for identification of disease intermediates associated with DENV disease severity. Extremes of phenotypes were compared for differential expression using BAP pipeline in 51 subjects. Candidate biomarkers were then assembled based on proteins identified in the discovery phase and those that had been identified by previous studies (see Table III for further details). For each candidate, targeted proteomics assays using stable isotope dilution (SID)-selected reaction monitoring (SRM) assays were developed, standardized, and used to quantitate the abundance of the candidate biomarker in the entire population (110 patients). Nonparametric random forests classification was then applied to identify informative features of DENV severity.
Figure 2
Figure 2. The top 10 canonical pathways dysregulated by DHF
Shown are canonical pathways dysregulated by DHF (Table II). The horizontal bar for each pathway is its score, calculated as –log10(p), where p is the probability that the specific combination of the implicated proteins occur in the pathway by pure chance. The yellow dots on the bars mark the ratios of the number of pathway proteins in the uploaded data set to the total number of proteins that make up the pathway.
Figure 3
Figure 3. Network of interactions
Shown is the top network dysregulated by DHF. The fold changes of protein abundance are marked below the nodes, with a positive value representing up-regulation and a negative value, down-regulation (DHF vs. DF). Molecules shown in the network: A2M: alpha-2 macroglobulin; ALB: albumin; APOE: apolipoprotein E; C3: complement component 3; C4A/C4B: complement component 4B; CFB: complement factor B; Chymotrypsin; CLU: clusterin; collagen(s); Elastase; ERK1/2: map kinase; FGG: fibrinogen gamma chain; Fibrinogen; GOT: aspartate aminotransferase; HDL: high-density lipoprotein; Hemoglobin; HP: haptoglobin; IgG: immunoglobulin G; IgG1: immunoglobulin G1; IGHG1: immunoglobulin heavy constant gamma 1 ; IGKC: immunoglobulin kappa constant; Kallikrein; KRT9: keratin 9; KRT10: keratin 10; LDL: low-density lipoprotein; Pro-inflammatory cytokine; SAA4: serum amyloid A4; Serine protease; SERPINA1: alpha-1-antitrypsin; SERPINA3: alpha-1-antichymotrypsin; SERPINA5: plasma serine protease inhibitor; SERPINC1: antithrombin-III; Stat3: signal transducer and activator of transcription 3; TCF: T cell factor; Trypsin.
Figure 4
Figure 4. Reference gel of plasma proteins dysregulated by DHF
Shown is a reference gel of 2DE of SEC fractionated and IgY depleted plasma proteins from the study subjects. The location of spots 179, 76 and 646, identified as discriminant proteins in the MARS model are shown. Insets are the 3D view of the spots for DF and DHF generated by Totallabs SameSpots software. The image shown represents the pI range of 3-10 and the molecular size range of 25-200+ kDa. Gel-derived protein size and pIs are: high molecular size ALB (spot 76) - MSize of >250 kDa and pI of 6.23; A2M (spot 179) exhibited a MSize of 128 kDa and pI of 5.27; and DESP (spot 646) exhibited an MSize of 34 kDa and pI 9.84.
Figure 5
Figure 5. SID-SRM-MS measurements in DENV infections
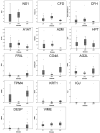
For each candidate biomarker, the SID-SRM-MS measurement by disease category is shown in a box plot format. Box plots show the 25% and 75% interquartile range, and the mean value indicated by horizontal dark line. Outliers are indicated as circles and asterisks. Note that the mean horizontal line is not symmetrically located within the box plot, indicating that the data is not normally distributed.
Figure 6
Figure 6. Variable importance measures in RF classifier
Shown is a rank ordered list of the relative importance for each feature predictive of the outcome for DENV infection.
Figure 7
Figure 7. Receiver Operating Characteristic (ROC) curve for the predictive model for severity DENV infections
A, ROC for DHF prediction. Y axis, Sensitivity; X axis, 1-Specificity. The area under the ROC curve (AUC) = 0.901. B, ROC for DFC prediction. The AUC=0.945.

References

    1. Murray NE, Quam MB, Wilder-Smith A. Epidemiology of dengue: past, present and future prospects. Clinical epidemiology. 2013;5:299–309. - PMC - PubMed
    1. Bhatt S, Gething PW, Brady OJ, Messina JP, Farlow AW, Moyes CL, Drake JM, Brownstein JS, Hoen AG, Sankoh O, et al. The global distribution and burden of dengue. Nature. 2013;496(7446):504–7. - PMC - PubMed
    1. Whitehead SS, Blaney JE, Durbin AP, Murphy BR. Prospects for a dengue virus vaccine. Nature reviews Microbiology. 2007;5(7):518–28. - PubMed
    1. Martina BEE, Koraka P, Osterhaus ADME. Dengue Virus Pathogenesis: an Integrated View. Clinical Microbiology Reviews. 2009;22(4):564–81. - PMC - PubMed
    1. Chaturvedi U, Nagar R, Shrivastava R. Dengue and dengue haemorrhagic fever: implications of host genetics. FEMS immunology and medical microbiology. 2006;47(2):155–66. - PubMed

Publication types

MeSH terms