

Identification of geographic clustering and regions spared by cutaneous T-cell lymphoma in Texas using 2 distinct cancer registries
- PMID: 25728286
- PMCID: PMC4457714
- DOI: 10.1002/cncr.29301
Identification of geographic clustering and regions spared by cutaneous T-cell lymphoma in Texas using 2 distinct cancer registries
Abstract
Background: Cutaneous T-cell lymphomas (CTCLs) (mycosis fungoides and its leukemic variant, Sezary syndrome) are rare malignancies. Reports of the occurrence of mycosis fungoides in married couples and families raise the possibility of an environmental trigger for this cancer. Although it has been suggested that CTCL arises from inappropriate T-cell stimulation, to the authors' knowledge no preventable trigger has been identified to date.
Methods: Using region, zip code, age, sex, and ethnicity, the authors analyzed the demographic data of 1047 patients from Texas who were seen in a CTCL clinic at The University of Texas MD Anderson Cancer Center during 2000 through 2012 (the MDACC database) and 1990 patients who were recorded in the population-based Texas Cancer Registry between 1996 and 2010. Subsequently, data from both databases were cross-analyzed and compared.
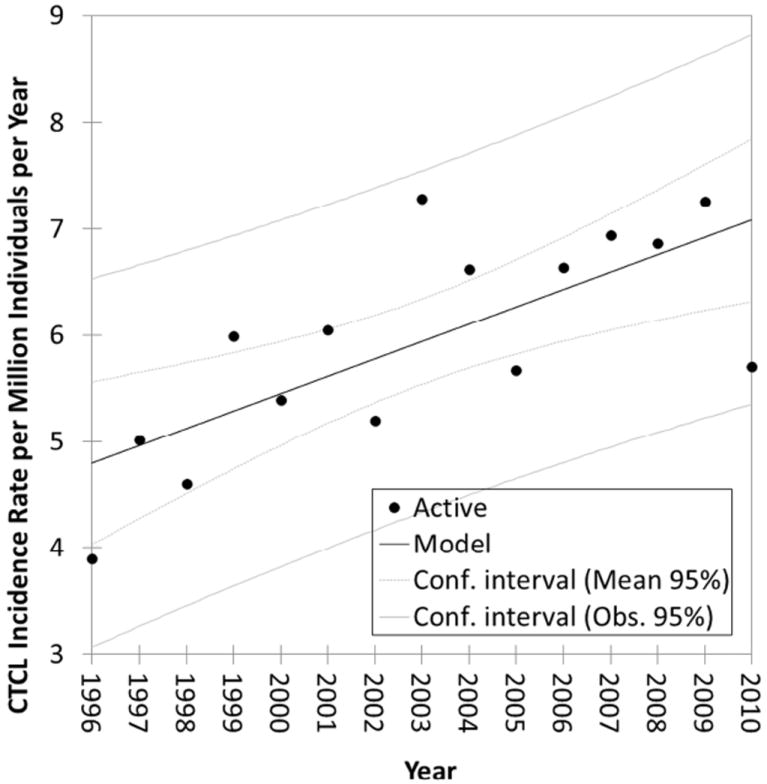
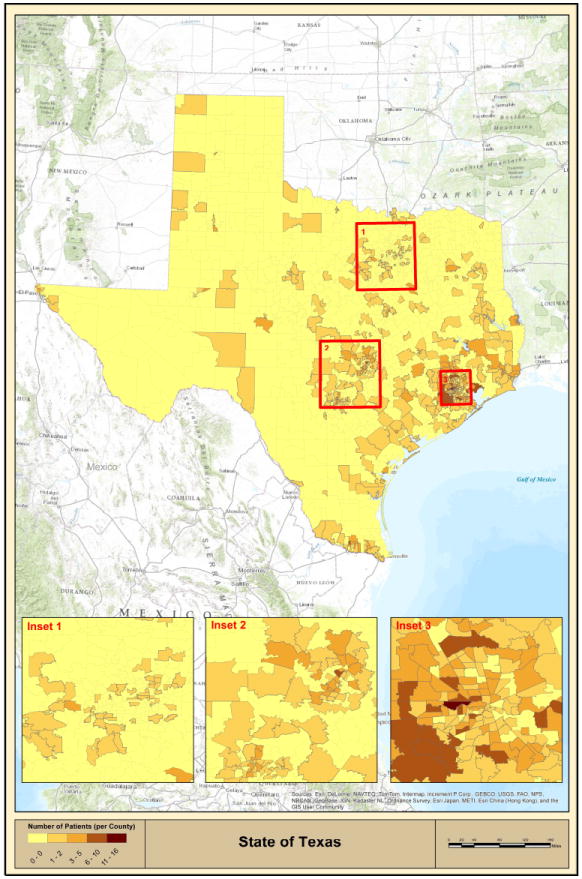
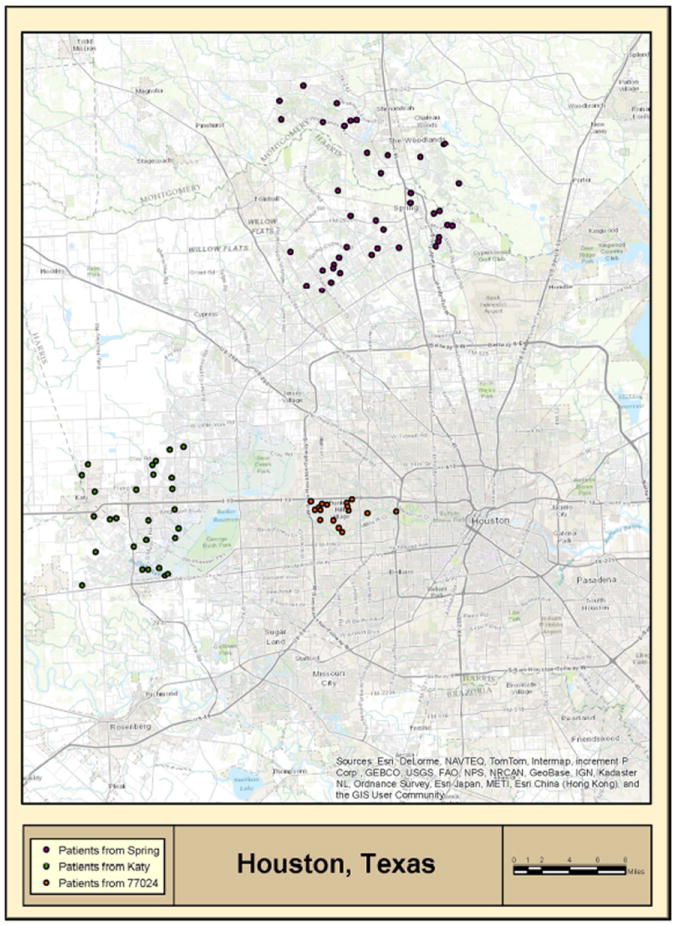
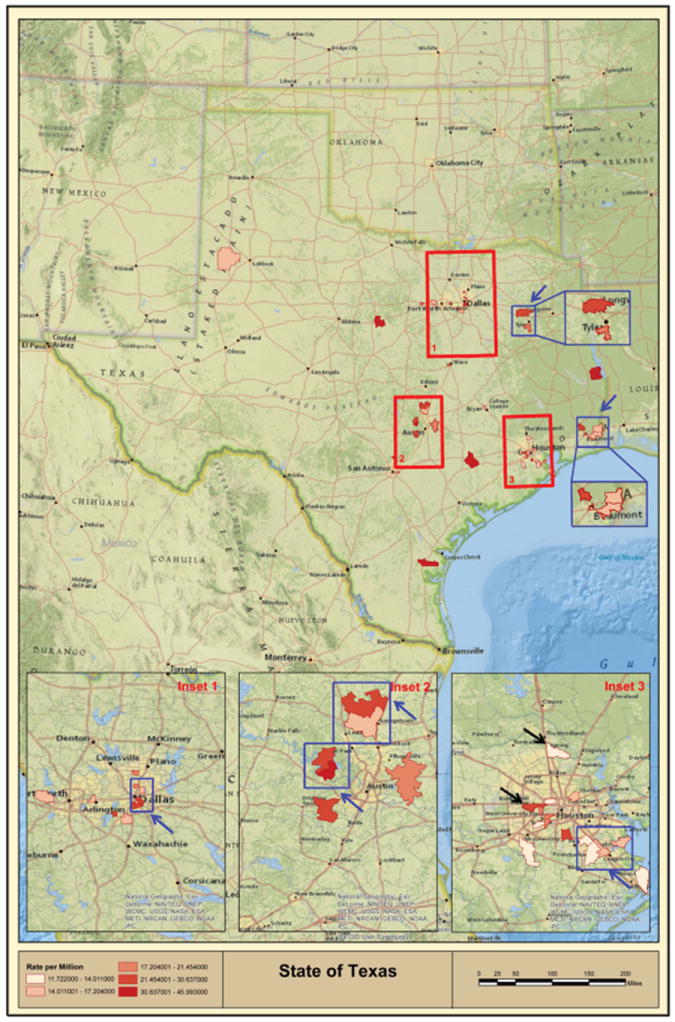
Results: The current study findings, based on the MDACC database, documented geographic clustering of patients in 3 communities within the Houston metropolitan area, in which CTCL incidence rates were 5 to 20 times higher than the expected population rate. Analysis of the Texas Cancer Registry database defined the CTCL population rate for the state to be 5.8 cases per million individuals per year (95% confidence interval, 5.5-6.0 per million individuals per year), thus confirming the observations from the MDACC database and further highlighting additional areas of geographic clustering and regions spared from CTCL in Texas.
Conclusions: The current study documented geographic clustering of CTCL cases in Texas and argued for the existence of yet unknown external causes/triggers for this rare malignancy.
Keywords: Sezary syndrome; cutaneous T-cell lymphoma (CTCL); disease hotspots; geographic clustering; mycosis fungoides; patient clustering.
© 2015 American Cancer Society.
Conflict of interest statement
Figures
References
-
- Criscione VD, Weinstock MA. Incidence of cutaneous T-cell lymphoma in the United States, 1973-2002. Arch Dermatol. 2007;143:854–859. - PubMed
-
- Buzzell RA. Carcinogenesis of cutaneous malignancies. Dermatol Surg. 1996;22:209–215. - PubMed
-
- Willemze R, Jaffe ES, Burg G, et al. WHO-EORTC classification for cutaneous lymphomas. Blood. 2005;105:3768–3785. - PubMed
Publication types
MeSH terms
Grants and funding
LinkOut - more resources
Full Text Sources
Other Literature Sources
Medical
