. 2015 Mar 18;85(6):1359-73.
doi: 10.1016/j.neuron.2015.02.014. Epub 2015 Feb 26.

Natural grouping of neural responses reveals spatially segregated clusters in prearcuate cortex

Affiliations

Natural grouping of neural responses reveals spatially segregated clusters in prearcuate cortex

Roozbeh Kiani et al. Neuron. .

Abstract

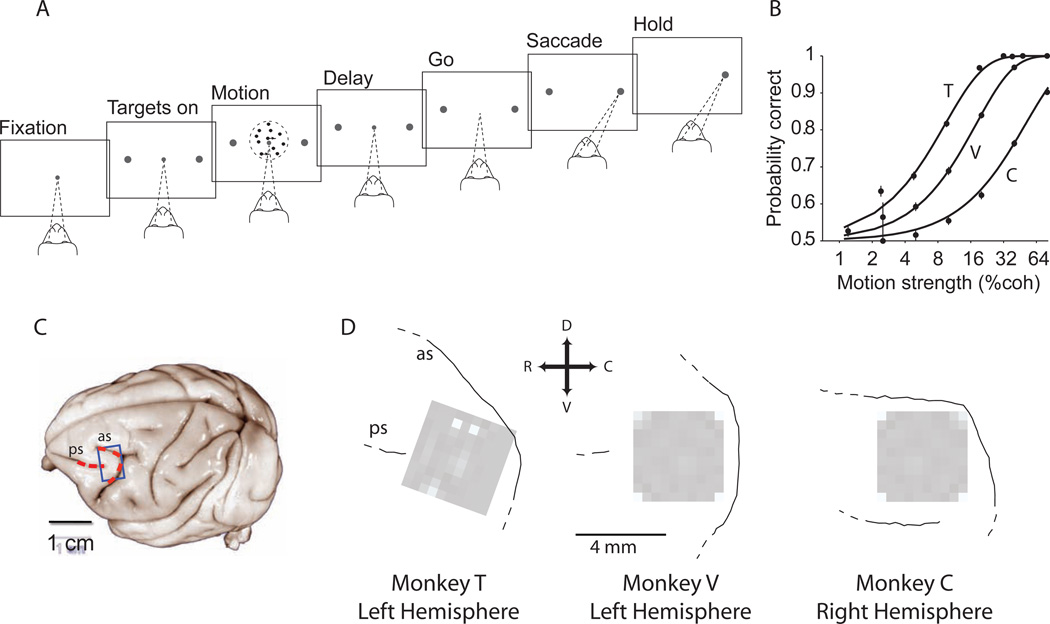
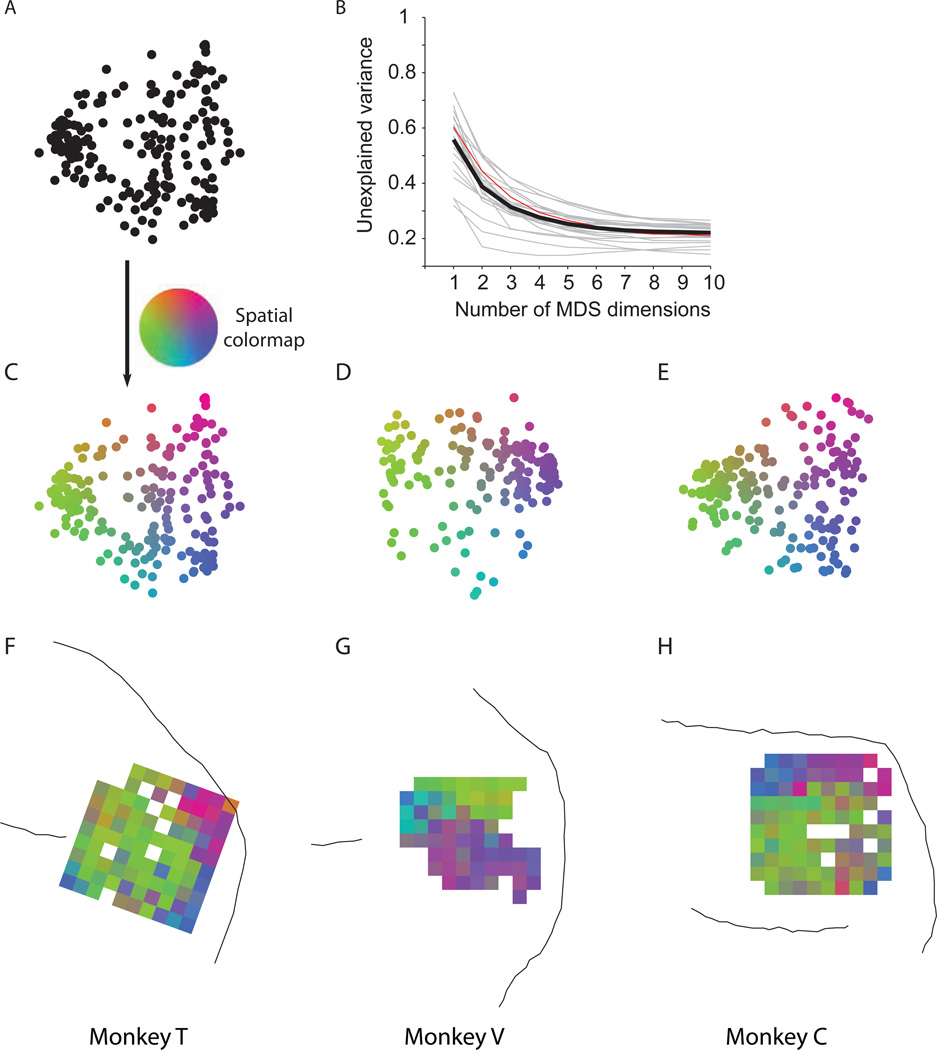
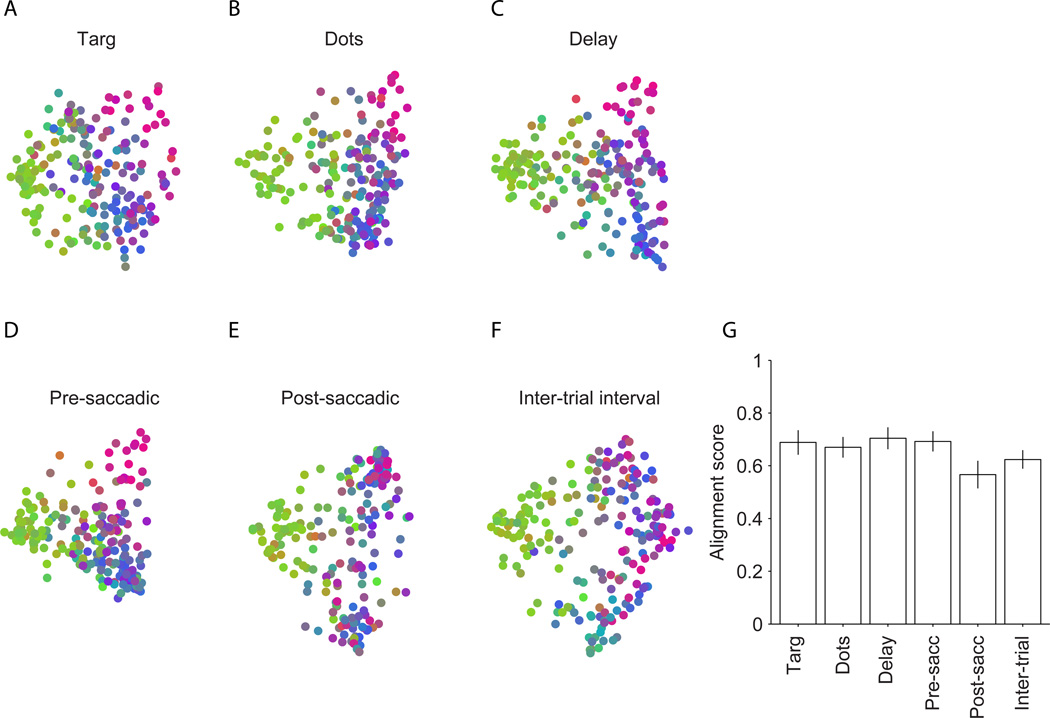
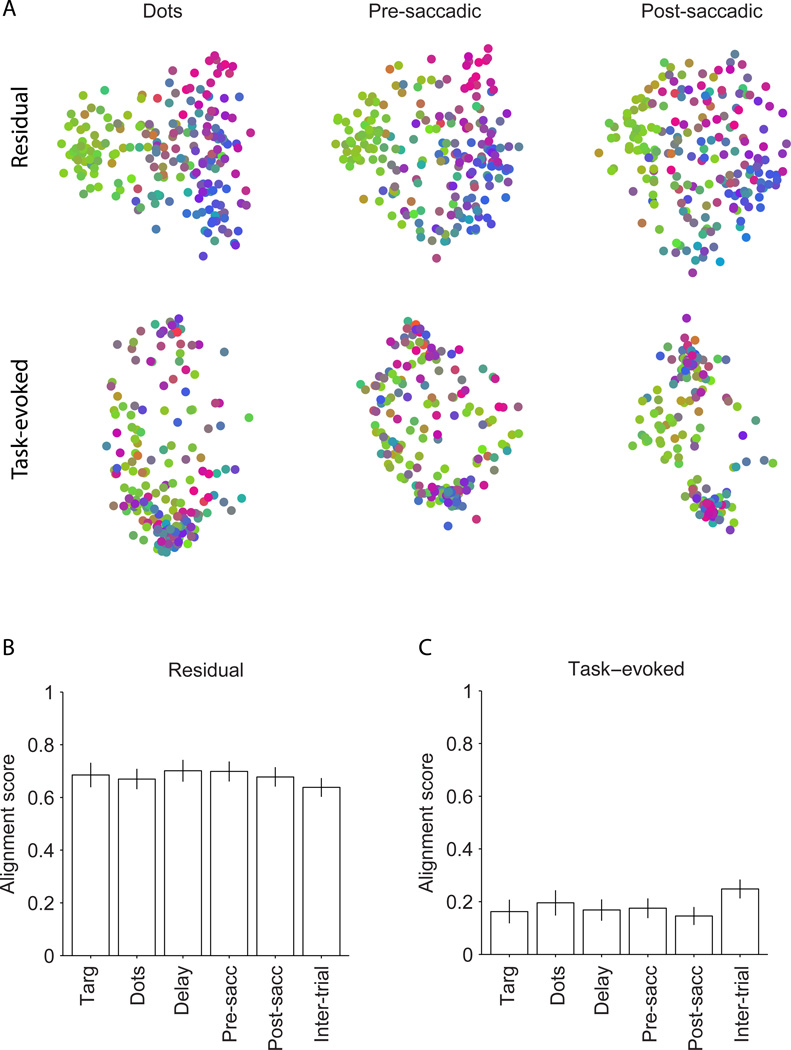
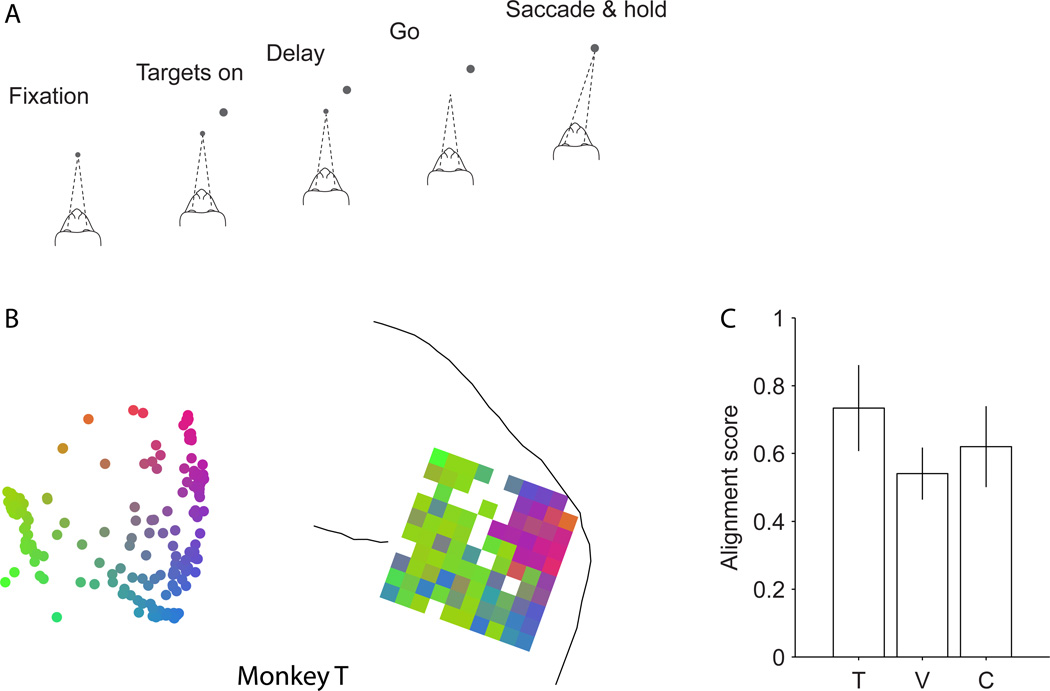
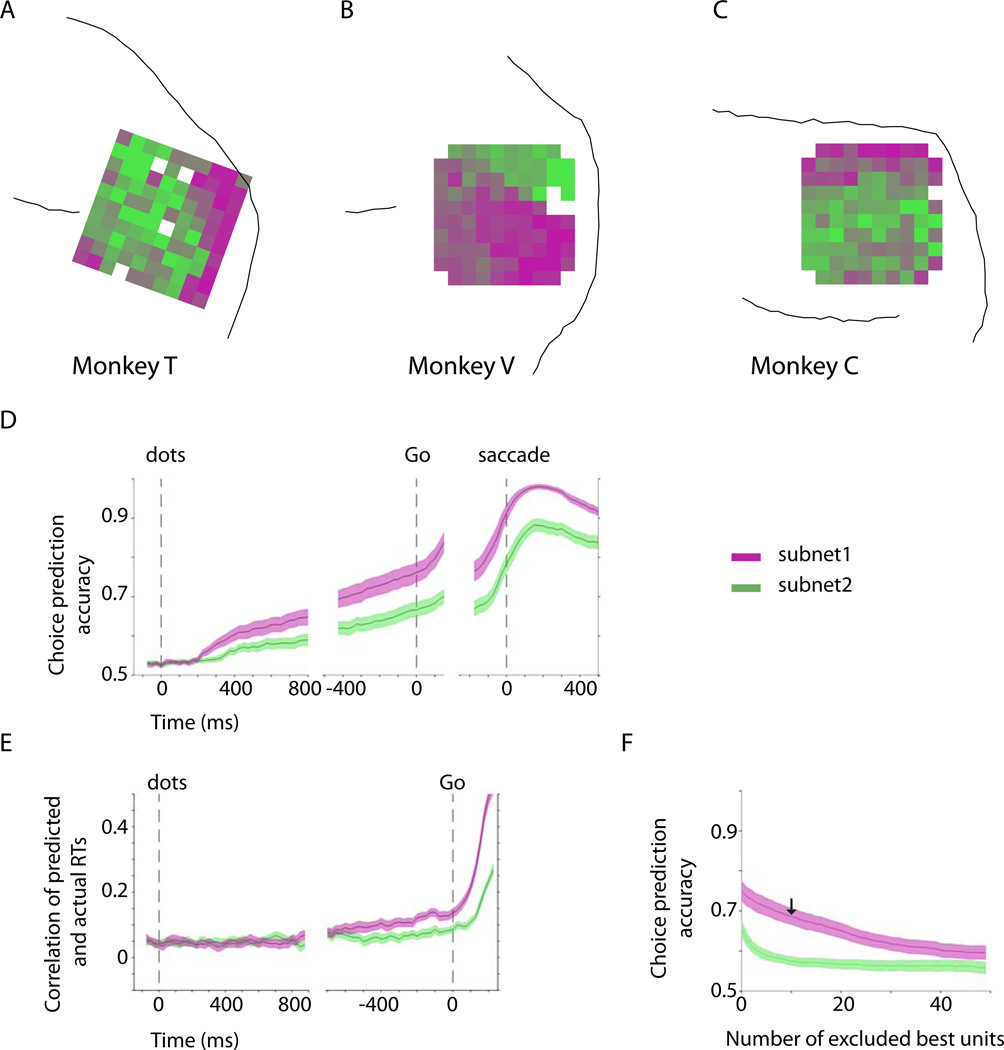
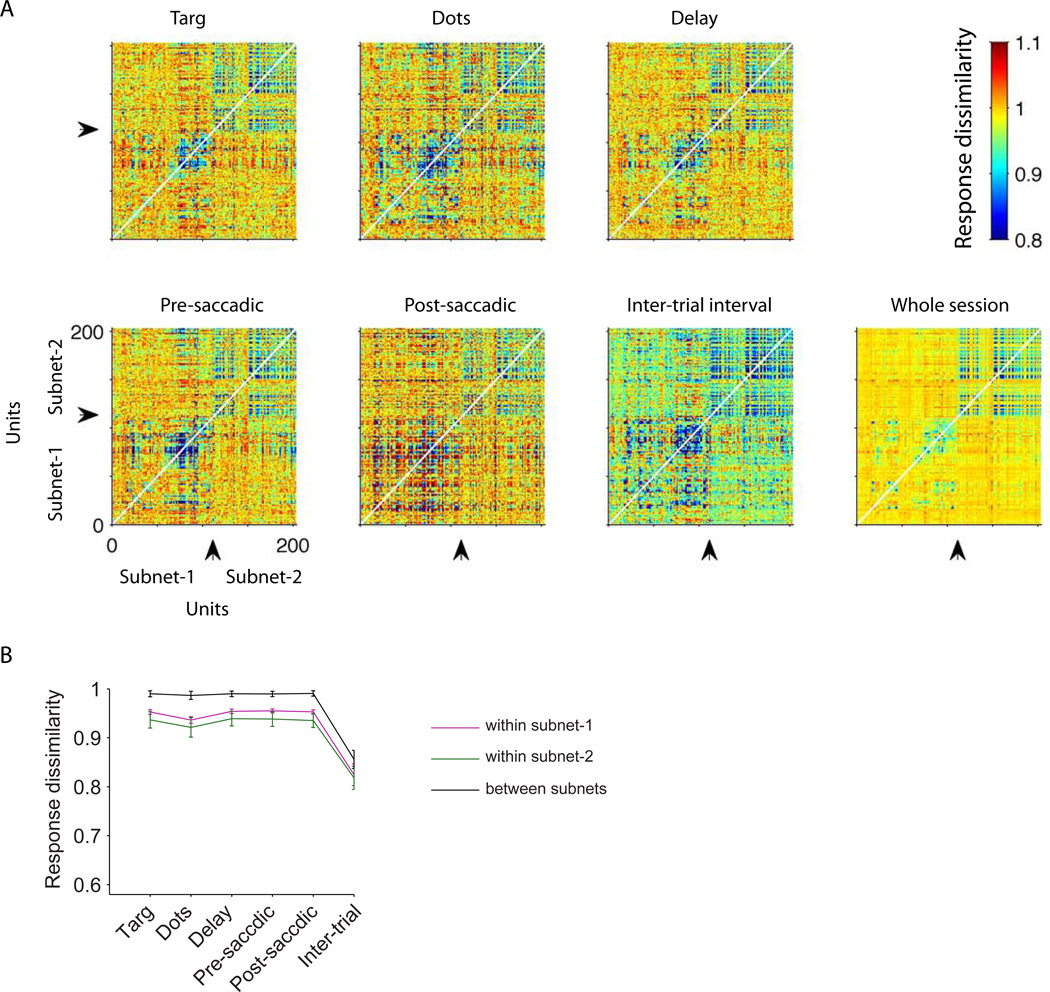
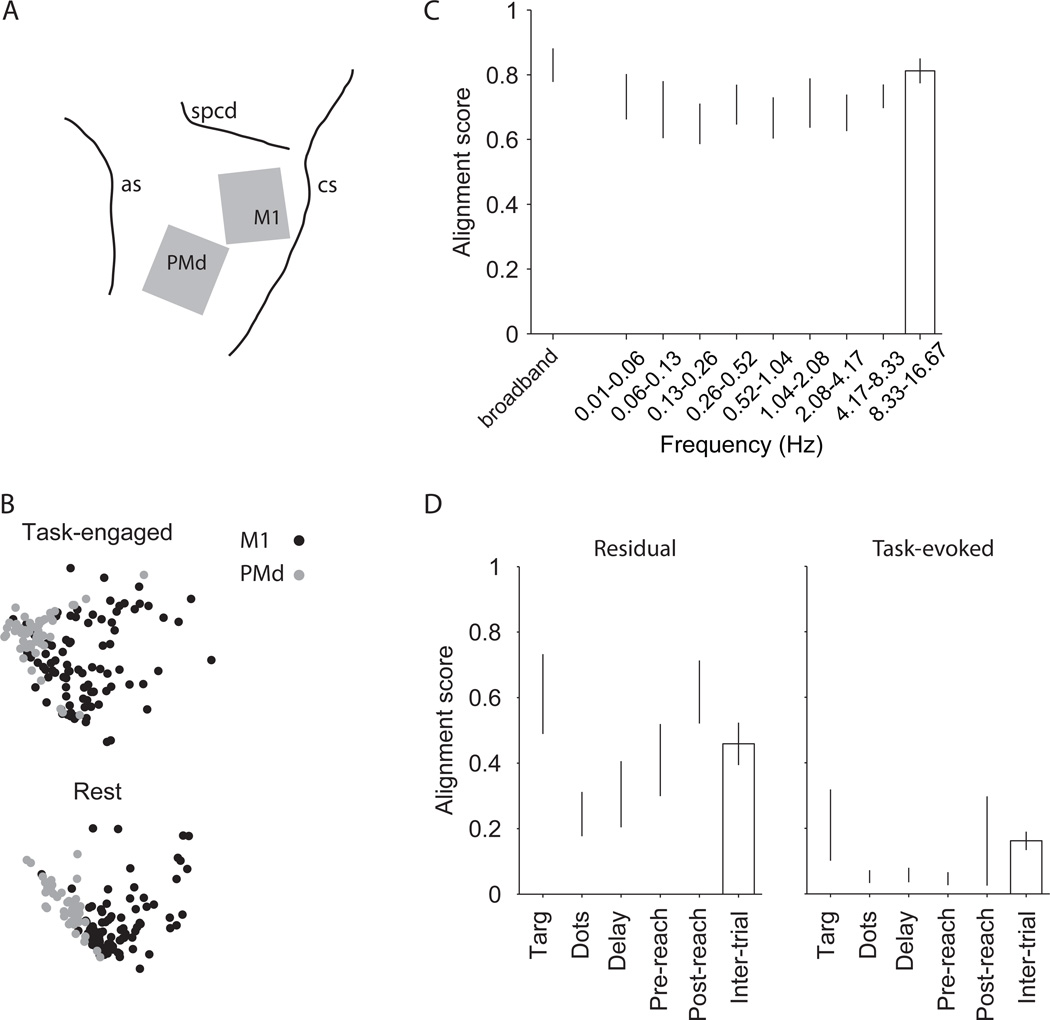
A fundamental challenge in studying the frontal lobe is to parcellate this cortex into "natural" functional modules despite the absence of topographic maps, which are so helpful in primary sensory areas. Here we show that unsupervised clustering algorithms, applied to 96-channel array recordings from prearcuate gyrus, reveal spatially segregated subnetworks that remain stable across behavioral contexts. Looking for natural groupings of neurons based on response similarities, we discovered that the recorded area includes at least two spatially segregated subnetworks that differentially represent behavioral choice and reaction time. Importantly, these subnetworks are detectable during different behavioral states and, surprisingly, are defined better by "common noise" than task-evoked responses. Our parcellation process works well on "spontaneous" neural activity, and thus bears strong resemblance to the identification of "resting-state" networks in fMRI data sets. Our results demonstrate a powerful new tool for identifying cortical subnetworks by objective classification of simultaneously recorded electrophysiological activity.


Figures

Figure 1
Figure 1
Large-scale multi-electrode recording from the prearcuate gyrus during a direction discrimination task. A) Behavioral task. Monkeys viewed the random dot motion for 800 ms and, after a variable delay, reported the perceived motion direction with a saccadic eye movement. Correct responses were rewarded with juice after a short hold period. The strength and direction of motion varied randomly from trial to trial. B) Behavioral performance. The three psychometric functions depict performance for the three monkeys (T, V, and C), averaged across all sessions. Psychophysical thresholds were 9.3% coherence for monkey T, 17.9% coherence for V, and 51% coherence for C. Monkey C’s perceptual sensitivity was poor relative to most animals; thresholds remained high despite months of training. The results in this paper, however, do not depend upon perceptual sensitivity. Our only requirement is that the animal was under behavioral control during task performance, which is demonstrated by the regular psychometric function. C) Target area (blue box) for implantation of the multi-channel electrode array on the prearcuate gyrus. Arcuate (as) and principal (ps) sulci are marked with red dashed lines on the surface of a typical macaque brain (University of Wisconsin Brain Collection). D) The actual location of each array with respect to arcuate and principal sulci. The white squares show the ground pins. In monkey C, the array could not be placed at the concavity of arcuate sulcus due to the unusually short distance between the arcuate and the posterior termination of the principal sulcus. Dashed lines at the end of a sulcus indicate the sulcus extends in this direction beyond our craniotomy.
Figure 2
Figure 2
Spatial topography in prearcuate gyrus. A) Two-dimensional depiction of recorded units based on response correlations in an example session. In this depiction, each point represents one unit, and the Euclidean distances between units represent the dissimilarity of their responses (1 – correlation coefficient) across the session. Isomap multi-dimensional scaling (MDS) was used to create this map. B) Unexplained variance as a function of the number of MDS dimensions suggests that the dissimilarity matrix is low dimensional. Two dimensions capture a large fraction of variance across sessions (mean=61.2%). Gray lines represent individual sessions. The thick black line is the average. The red line represents the example session in A. C) The units of the example session in A are colored according to a 2D color map in which hue represents radial angle and saturation represents eccentricity. D–E) Two-dimensional depictions of example sessions in the other monkeys. F–H) Projection of the unit colors onto the recording electrodes reveals spatial topography (clustering of colors) within the recording area. White squares correspond to ground pins or to electrodes that failed to record a unit in the depicted session. If an electrode recorded from more than one unit, the average color of the units is projected onto that electrode.
Figure 3
Figure 3
Topography in the MDS plots, and thus spatial topography on the arrays, is stable across task epochs. Same experiment as in Fig. 2C. A–F) MDS plots calculated independently for six temporal epochs in the task (see Experimental Procedures). Each unit inherited the same color assigned to it in the whole-session MDS map in Fig. 2C. Thus, clustering of units with similar colors indicates that the observed topography is preserved across task epochs. G) To quantify the preservation of topography, we calculated the correlation of the whole-session dissimilarity matrix with epoch-based dissimilarity matrices (alignment score). The bars show the average alignment scores across sessions. Error bars represent 95% confidence interval.
Figure 4
Figure 4
Common noise is the main underlying factor for the topography. A) Two-dimensional plots of units based on task-evoked and residual responses for the example session in Fig. 2C. The measured neural responses in each trial epoch consisted of a task-evoked component (the mean across trials with similar motion direction, motion strength, and choice) and a residual component (the variation around the mean). We recomputed dissimilarities for all six temporal epochs based on the task-evoked and residual components. MDS plots are shown for three epochs. The unit colors are inherited from Fig. 2C. MDS maps are largely preserved for residual responses, but not for task-evoked responses. B) Alignment scores of dissimilarity matrices for the residual responses with those for the whole-session responses in six temporal epochs. The bars show average alignments across sessions. C) Alignment scores of dissimilarity matrices for the task-evoked responses with those for whole-session response across the same sessions. Error bars represent 95% confidence intervals.
Figure 5
Figure 5
MDS maps and spatial topography is invariant to task modifications. A) We recorded neural responses while the monkey performed a second task: visually guided delayed saccade. In this task, after the acquisition of the fixation point by the monkey, a single target was presented on the screen. The monkey made a saccadic eye movement to the target after the Go cue. B) The two-dimensional MDS plot and the projected topography on the array for an example session in monkey T. The topography is very similar to that observed in other sessions where the monkey performed a direction discrimination task (e.g. Fig. 2F). C) The alignment score of the average ‘electrode-based’ dissimilarity matrices (see Experimental Procedures) across the two tasks. The bars show the alignment score for each monkey. Error bars represent 95% confidence intervals for the alignment between the two dissimilarity matrices.
Figure 6
Figure 6
Differential physiological properties of the two subnets. A–C) Average layout of the two subnets across the sessions for each monkey. We used K-means clustering to objectively divide the recorded units into two subnets in each session. The subnets were assigned magenta (subnet-1) and green colors (subnet-2) and projected back onto the arrays. The average maps across the sessions are shown for each monkey. The electrodes with in-between colors contributed to different subnets across experiments. D) Choice prediction accuracy based on a logistic regression analysis (see Supplemental Experimental Procedures) of the population responses of subnet-1 and subnet-2. E) RT prediction accuracy based on a linear Ridge regression analysis of the population responses of the two subnets. Subnet-1 is a better predictor of both choice and reaction time. RTs were measured from the Go cue. F) Choice predictive responses were more distributed in subnet-1. In each session we ranked individual units of subnet-1 and subnet-2 based on their choice prediction accuracy and then measured the effect of the exclusion of best units on the choice prediction accuracy of the population response. The arrow indicates prediction accuracy of subnet-1 after exclusion of its 10 best units. The analysis focuses on the 150 ms window immediately before the Go cue. The shaded areas represent SEM across sessions.
Figure 7
Figure 7
Overall response dissimilarity levels vary across task epochs, but the structure of the dissimilarity matrix is stable. A) The pairwise dissimilarity matrices for all recorded pairs of units in the example session of Fig. 2C. Response dissimilarities are measured separately for different task epochs. To facilitate visualization, the units are ordered based on the subnet membership. Arrows indicate the border between the two subnets for this session. The cooler colors during the inter-trial interval indicate that dissimilarity is overall lower (response correlation is higher). B) Average response dissimilarities within and between the subnets in different task epochs across sessions. Error bars indicate SEM across sessions.
Figure 8
Figure 8
Motor cortex data are similar to the pre-arcuate data, and extend our results to the resting state. A) Two multi-electrode arrays were implanted in the left primary motor cortex (M1) and dorsal premotor cortex (PMd) of a monkey trained for a direction discrimination task with reaching movements as the operant response. The gray squares show the array locations with respect to major sulci (as, arcuate sulcus; cs, central sulcus; spcd, superior precentral dimple). B) MDS plots of an example session. M1 and PMd are well segregated both during the direction discrimination task and in rest periods between the task-engaged blocks of trials. C) Alignment score of the resting and task-engaged dissimilarity matrices. Response dissimilarity matrices were calculated for the combined population across the two arrays. Alignment scores were calculated for the broadband data (unfiltered, leftmost bar) and for same frequency bands depicted in Fig. S6 for the prearcuate data. The matrices are well aligned for the resting and task-engaged periods (left bar), and the signals underlying the alignment are distributed across temporal frequency bands spanning three orders of magnitude (right bars). D) Common noise is the main factor underlying the structure of dissimilarity matrices and segregation of M1 and PMd subnets in this analysis. Alignment scores show the correlation between the resting period dissimilarity matrix and the task-evoked (right) and residual dissimilarity matrices (left). Conventions are similar to Fig. 4B–C.

Comment in

  • Noisy neurons, neat networks.
    Vanduffel W, Arsenault JT. Vanduffel W, et al. Neuron. 2015 Mar 18;85(6):1155-7. doi: 10.1016/j.neuron.2015.03.001. Neuron. 2015. PMID: 25789752

Similar articles

Cited by

References

    1. Abe H, Lee D. Distributed coding of actual and hypothetical outcomes in the orbital and dorsolateral prefrontal cortex. Neuron. 2011;70:731–741. - PMC - PubMed
    1. Amir Y, Harel M, Malach R. Cortical hierarchy reflected in the organization of intrinsic connections in macaque monkey visual cortex. J Comp Neurol. 1993;334:19–46. - PubMed
    1. Badre D, D'Esposito M. Is the rostro-caudal axis of the frontal lobe hierarchical? Nature reviews Neuroscience. 2009;10:659–669. - PMC - PubMed
    1. Bair W, Zohary E, Newsome WT. Correlated firing in macaque visual area MT: time scales and relationship to behavior. J Neurosci. 2001;21:1676–1697. - PMC - PubMed
    1. Boucsein C, Nawrot MP, Schnepel P, Aertsen A. Beyond the cortical column: abundance and physiology of horizontal connections imply a strong role for inputs from the surround. Frontiers in neuroscience. 2011;5:32. - PMC - PubMed

Publication types

LinkOut - more resources