. 2015 Mar 12;160(6):1061-71.
doi: 10.1016/j.cell.2015.01.049. Epub 2015 Feb 26.

TREM2 lipid sensing sustains the microglial response in an Alzheimer's disease model

Affiliations

TREM2 lipid sensing sustains the microglial response in an Alzheimer's disease model

Yaming Wang et al. Cell. .

Abstract

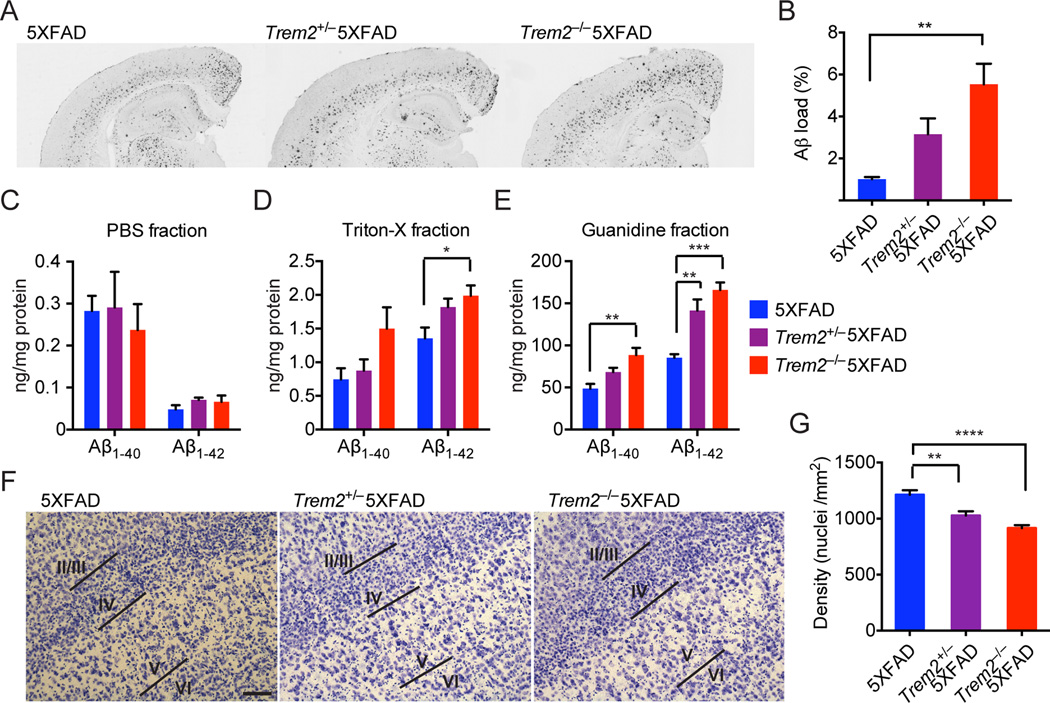
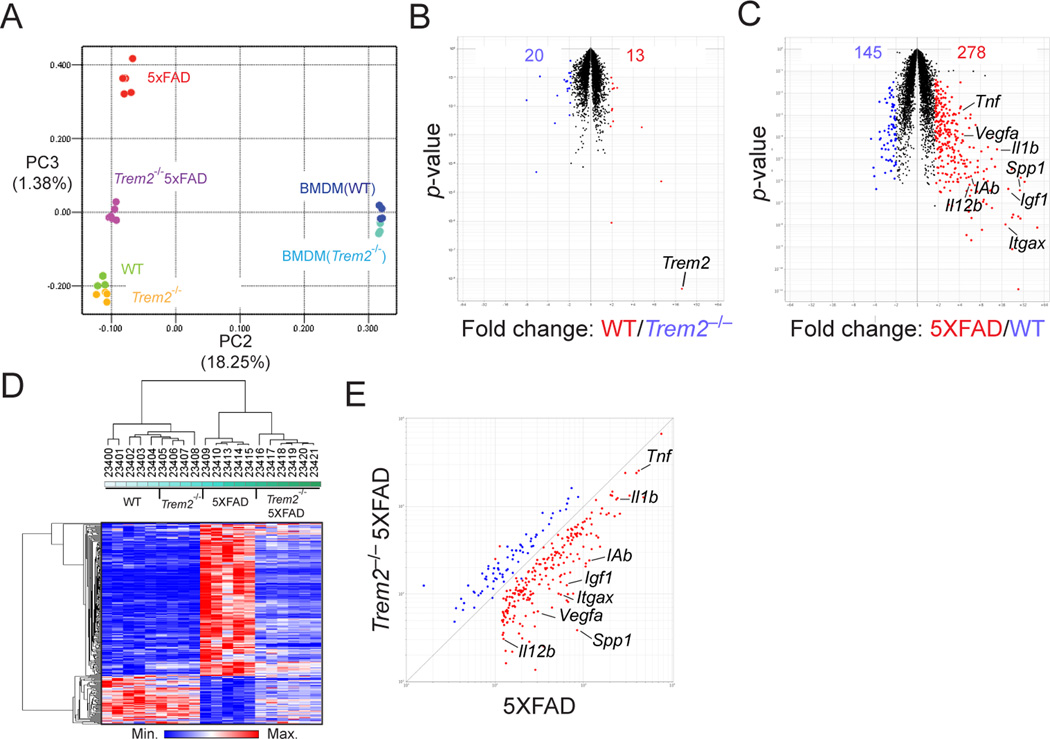
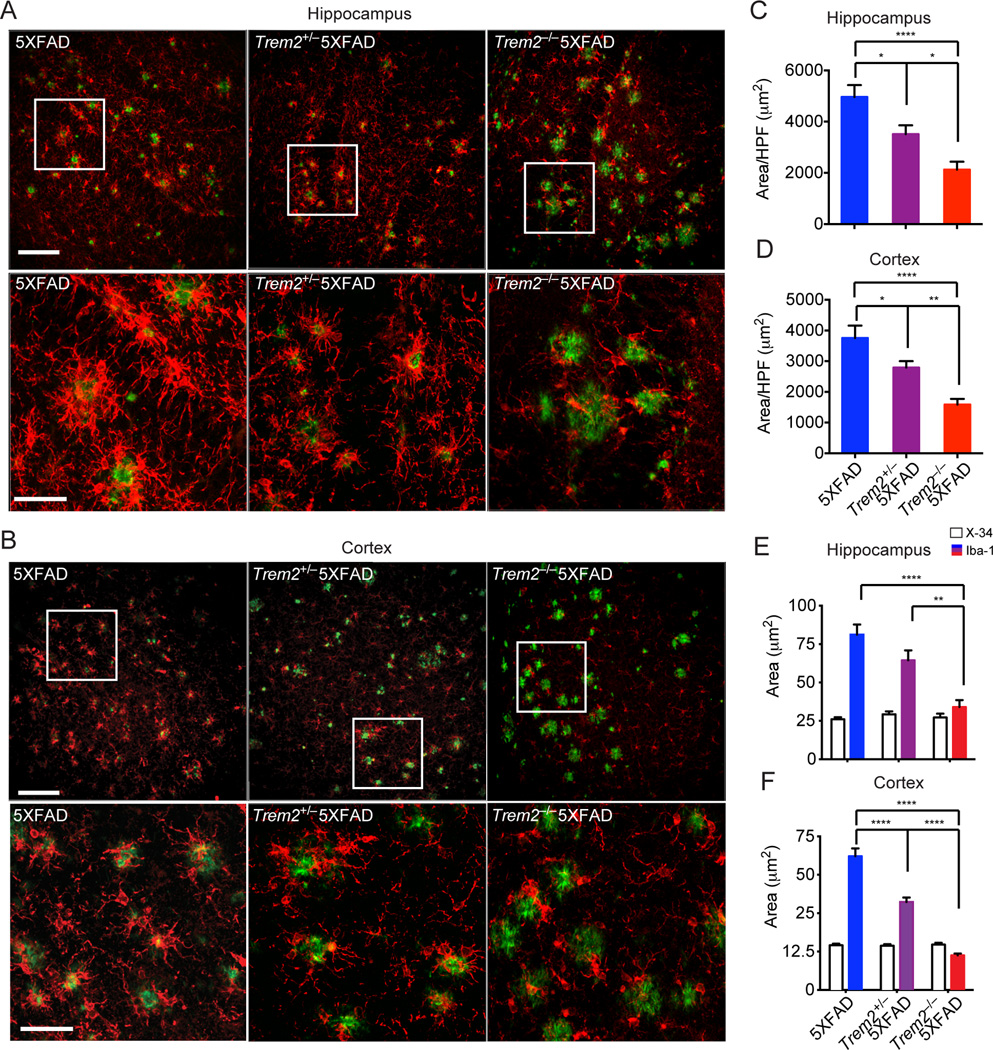
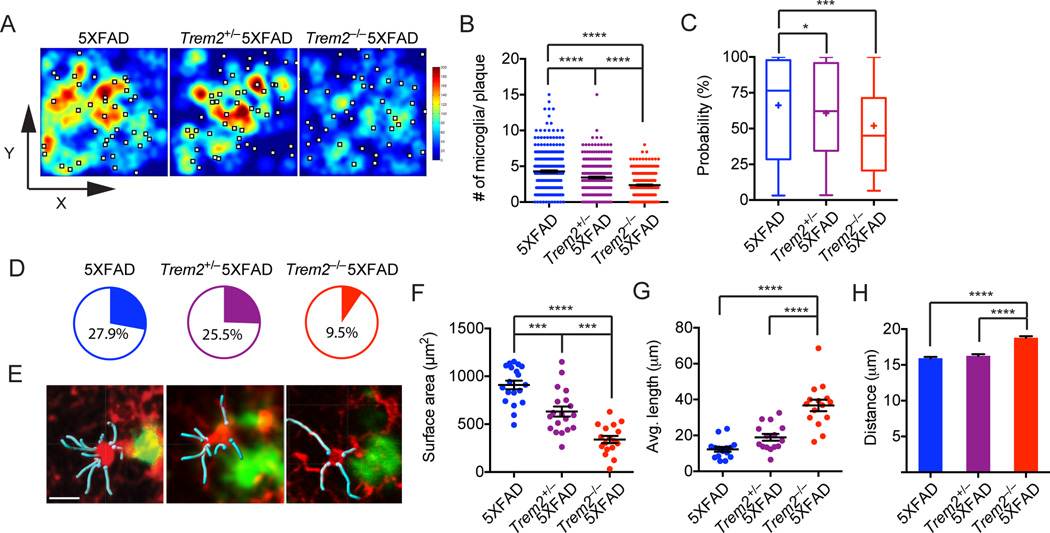
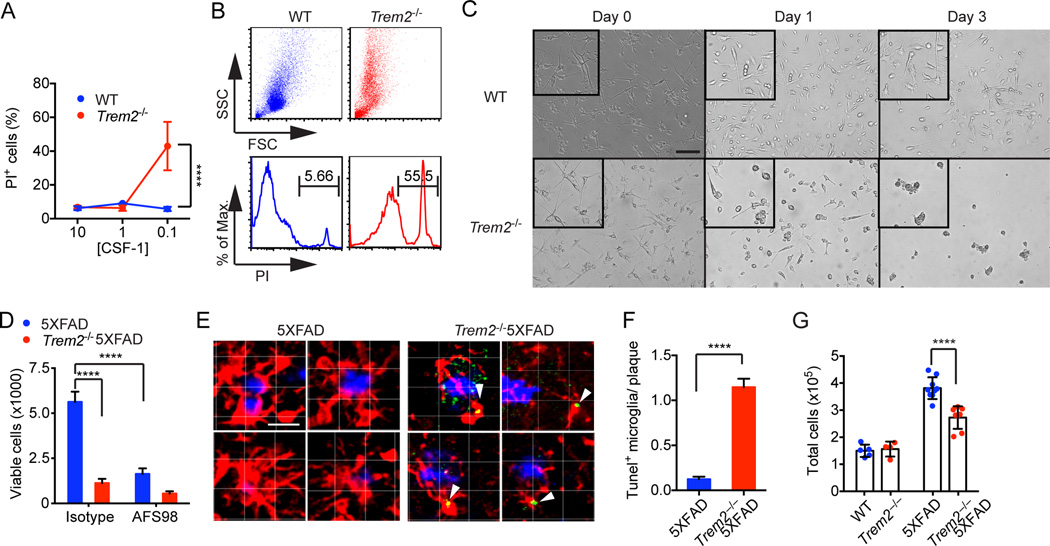
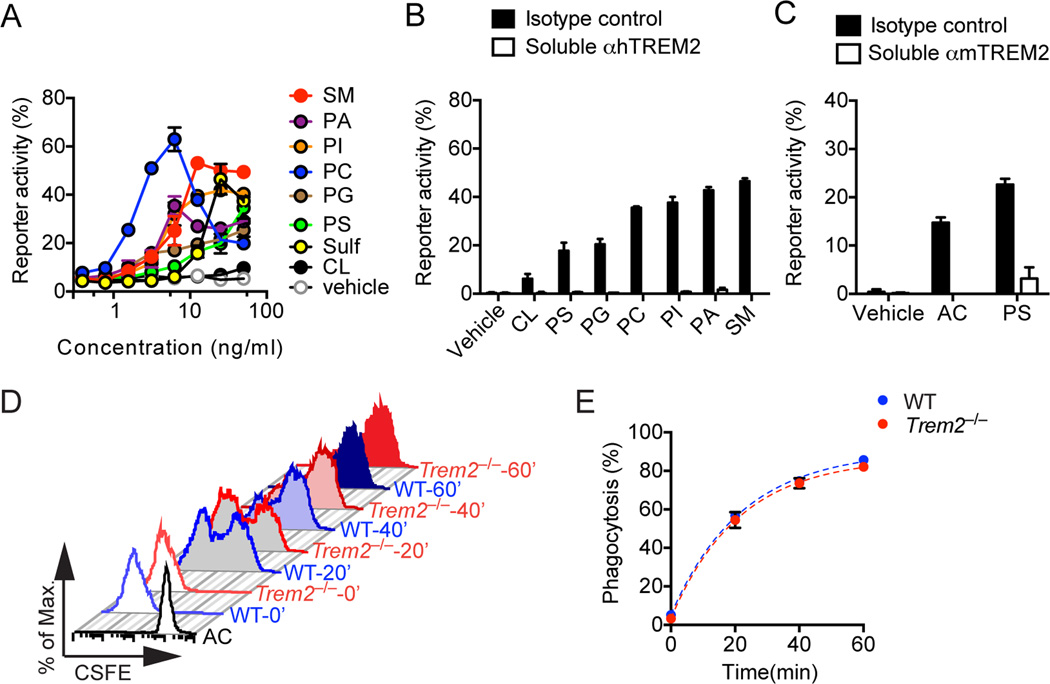
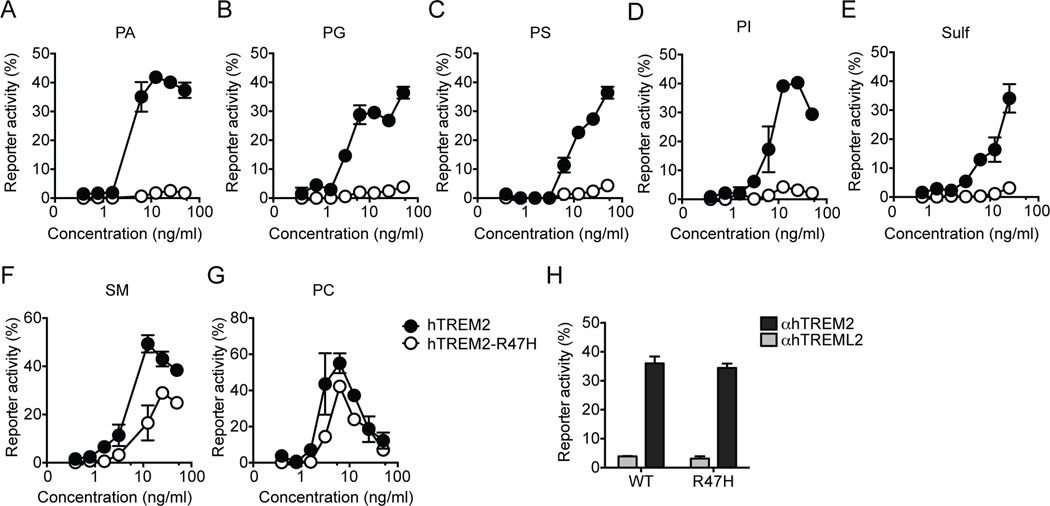
Triggering receptor expressed on myeloid cells 2 (TREM2) is a microglial surface receptor that triggers intracellular protein tyrosine phosphorylation. Recent genome-wide association studies have shown that a rare R47H mutation of TREM2 correlates with a substantial increase in the risk of developing Alzheimer's disease (AD). To address the basis for this genetic association, we studied TREM2 deficiency in the 5XFAD mouse model of AD. We found that TREM2 deficiency and haploinsufficiency augment β-amyloid (Aβ) accumulation due to a dysfunctional response of microglia, which fail to cluster around Aβ plaques and become apoptotic. We further demonstrate that TREM2 senses a broad array of anionic and zwitterionic lipids known to associate with fibrillar Aβ in lipid membranes and to be exposed on the surface of damaged neurons. Remarkably, the R47H mutation impairs TREM2 detection of lipid ligands. Thus, TREM2 detects damage-associated lipid patterns associated with neurodegeneration, sustaining the microglial response to Aβ accumulation.


Figures

Figure 1
Figure 1. TREM2 deficient 5XFAD mice have increased hippocampal Aβ burden and accelerated loss of layer-V cortical neurons
Aβ burden in 8.5 month-old Trem2−/−5XFAD, Trem2+/−5XFAD, and 5XFAD mice. (A) Matching coronal hippocampus and cortex sections were stained with an Aβ-specific antibody mHJ3.4. (B) Amounts of Aβ loads in hippocampi. (CE) Soluble and insoluble Aβ1–40 and Aβ1–42 levels in hippocampi as detected by ELISA. (FG) Densities of layer-V neurons in 8.5 month-old Trem2−/−5XFAD, Trem2+/−5XFAD and 5XFAD mice. (F) Matching coronal sections stained with cresyl violet. (G) Summary of densities of layer-V neurons. Original magnification: 10×; scale bar= 100µm. *p<0.05, **p<0.01, ***p<0.001, ****p<0.0001, one-way ANOVA. Data represent analyses total of 8–10 5XFADmice, 8–12 Trem2+/− 5XFAD mice, and 8–16 Trem2−/−5XFAD mice (B, C–E, G). Bars represent mean±SEM. See also Figure S1.
Figure 2
Figure 2. TREM2 deficiency impairs Aβ-induced transcriptional program in microglia
Transcriptional analysis of microglia isolated from hippocampi and cortices of 8.5 month-old Trem2−/−5XFAD, 5XFAD, Trem2−/− and WT mice. (A) Top 15% most variable transcripts were subjected to principle component analysis (PCA). Plot shows 2-dimensional (PC2 vs. PC3) comparison of transcriptional changes in all classes analyzed. WT and Trem2−/− BM-derived macrophages were used as references. (B) Volcano plot comparing microglia transcripts in Trem2−/− and WT mice. Trem2 transcript is indicated. (C) Volcano plot comparing microglia transcripts in 5XFAD and WT mice. Numbers in plots B and C indicate probes that are significantly upregulated or downregulated (±2 fold, p<0.05, Student's t-test). Representative transcripts are indicated. (D, E) Visualization of Aβ-induced changes in microglia transcripts from (C). (D) A heatmap displays hierarchical clustering of all samples analyzed. (E) A scatter plot compares these transcriptional changes in Trem2−/−5XFAD and 5XFAD microglia. Representative transcripts are shown. See also Figure S2.
Figure 3
Figure 3. TREM2 deficiency leads to reduced microgliosis in 5XFAD mice
Microgliosis in 8.5 month-old Trem2−/−5XFAD, Trem2+/−5XFAD and 5XFAD mice. (A, B) Matching coronal sections were stained with Iba-1 (red) for microglia and X-34 (green) for amyloid plaques. Representative Z-stack images with maximum projection are shown. (CD) Quantification of total Iba-1 reactivity per high power field (HPF) in hippocampi and cortices. (E, F) Quantification of microgliosis associated with plaques of similar sizes in hippocampi and cortices. Original magnification 20× (A, B, upper panels), 40× (A, B, lower panels); Scale bar= 10µm (A, B, upper panels), 50 µm (A, B, lower panels). *p<0.05, **p<0.01, ****p<0.0001, one-way ANOVA. Data represent analyses of a total of 8–10 5XFAD, 8–12 Trem2+/− 5XFAD mice, and 8–16 Trem2−/−5XFAD mice. Bars represent mean±SEM. See also Figure S3 and Movie S1–3.
Figure 4
Figure 4. TREM2 deficiency diminishes the capacity of microglia to cluster around amyloid plaques
Frequencies of plaque-associated microglia in 8.5 month-old Trem2−/−5XFAD, Trem2+/−5XFAD and 5XFAD mice were determined. (A) Heatmap shows frequencies of microglia in relation to amyloid plaques shown as white squares. (B) Summary of frequencies of plaque-associated microglia in all analyzed genotypes. (C, D) Microglia clustering around plaques in 5XFAD, Trem2+/−5XFAD and Trem2−/−5XFAD mice were compared to Monte Carlo simulations that assume total randomness between plaques and microglia. Probabilities that any given microglia-plaque cluster are non-random are shown in (C). Pie charts show frequencies of microglia-plaque clusters that cannot be statistically explained as random (p<0.05) (D). (E) Morphology of plaque-associated microglia highlighting the shape of cell bodies (red) and primary processes (cyan). (F–H) Plaque-associated microglia are analyzed for their surface area (cell body only), average length of primary processes and distance from the center of adjacent amyloid plaque. Original magnification: 20×; scale bar= 15µm. *p<0.05, ***p<0.001, ****p<0.0001, one-way ANOVA. Data represent analyses of a total 7 mice per group (A–D) and a total of 5 mice per group (E–G). Bars represent mean±SEM. See also Figure S4.
Figure 5
Figure 5. TREM2 promotes microglia survival ex vivo and in vivo
(A–C) Adult primary microglia were cultured with various concentration of CSF-1-containing L-cell medium (LCM). Viability of microglia by PI staining (A–B) and morphology (C) were assessed on day 3. (D) Microglia were purified ex vivo from 5XFAD mice and cultured in 0.1% LCM with or without CSF-1R blocking antibody AFS98. Viability was determined on day 5. (E, F) Apoptosis of plaque-associated microglia cells (Iba-1, red) in 5XFAD and Trem2−/−5XFAD mice was determined by TUNEL staining (green). Plaques were identified by X-34 (blue). Representative single-stack images of 5XFAD and Trem2−/−5XFAD microglia (E) and summary of frequencies of TUNEL+ microglia associated with plaques (F) are shown. Original magnification: 20×; scale bar= 10µm (C), 15µm (E). (G) Total numbers of live microglia cells in cortices and hippocampi of 5XFAD, Trem2−/− 5XFAD, Trem2−/− and WT mice. ****p<0.0001, two-way ANOVA (A, D, G), student's t-test (F). Data represent a total of three independent experiments (A–D) and a total of 5–8 mice per group (E–G). Bars represent mean±SEM. See also Figure S5 and Movie S4.
Figure 6
Figure 6. TREM2 is a receptor for lipid patterns associated with Aβ
(A, B) Human TREM2 reporter cells were stimulated with various phospholipids, anionic and zwitterionic lipids at the indicated concentrations. Reporter activation (GFP expression) was assessed after overnight incubation by flow cytometry. Kinetics of TREM2 reporter cells responding to lipids at various concentrations are shown in (A). Blockade of reporter activation by a soluble anti-hTREM2 mAb is shown in (B). (C) mTREM2 reporter cells were cultured with either apoptotic cells (AC) or phosphatidylserine (PS) in the presence of soluble anti-TREM2 mAb or isotype control. (D, E) Adult primary microglia from Trem2−/−5XFAD and 5XFAD mice were pulsed with CSFE-labeled AC. (D) Phagocytosis of AC was determined 20, 40 and 60 min post co-culturing by flow cytometry. (E) Summary of AC uptake by WT and Trem2−/− microglia. Data represent a total of three (A–C) and two (D, E) independent experiments.
Figure 7
Figure 7. R47H mutation attenuates TREM2 recognition of lipids
(A–H). Reporter cells expressing either common allele or R47H variant of human TREM2 were stimulated with various species of lipids or plate-bound anti-hTREM2 mAb. A plate-bound control antibody (anti-hTREML2) was used as a negative control. Data represent a total of two independent experiments. Bars represent mean±SEM.

Comment in

References

    1. Ahyayauch H, Raab M, Busto JV, Andraka N, Arrondo JL, Masserini M, Tvaroska I, Goni FM. Binding of beta-amyloid (1–42) peptide to negatively charged phospholipid membranes in the liquid-ordered state: modeling and experimental studies. Biophys j. 2012;103:453–463. - PMC - PubMed
    1. Bouchon A, Hernandez-Munain C, Cella M, Colonna M. A DAP12-mediated pathway regulates expression of CC chemokine receptor 7 and maturation of human dendritic cells. J Exp Med. 2001;194:1111–1122. - PMC - PubMed
    1. Butovsky O, Jedrychowski MP, Moore CS, Cialic R, Lanser AJ, Gabriely G, Koeglsperger T, Dake B, Wu PM, Doykan CE, et al. Identification of a unique TGF-beta-dependent molecular and functional signature in microglia. Nat Neurosci. 2014;17:131–143. - PMC - PubMed
    1. Cannon JP, O'Driscoll M, Litman GW. Specific lipid recognition is a general feature of CD300 and TREM molecules. Immunogenetics. 2012;64:39–47. - PubMed
    1. Chitu V, Stanley ER. Colony-stimulating factor-1 in immunity and inflammation. Curr Opin Immunol. 2006;18:39–48. - PubMed

Publication types

Associated data