. 2015 Mar 12;160(6):1196-208.
doi: 10.1016/j.cell.2015.02.011. Epub 2015 Feb 26.

Tuning cytokine receptor signaling by re-orienting dimer geometry with surrogate ligands

Affiliations

Tuning cytokine receptor signaling by re-orienting dimer geometry with surrogate ligands

Ignacio Moraga et al. Cell. .

Abstract

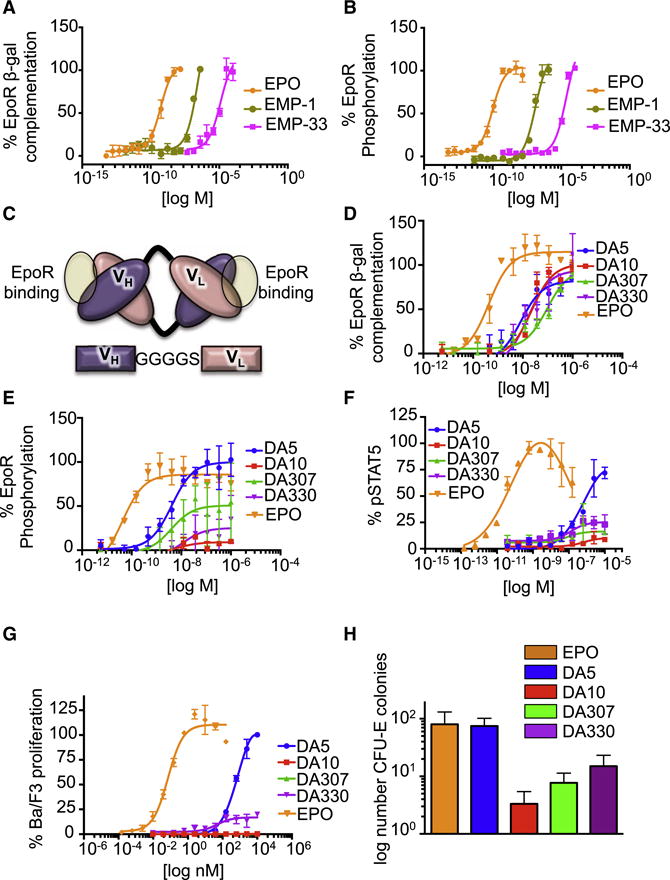
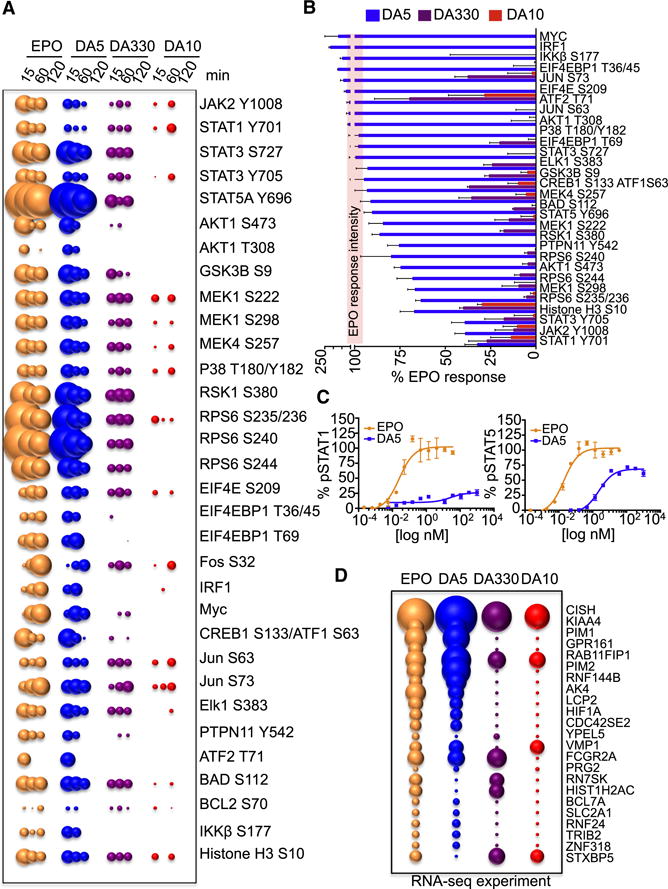
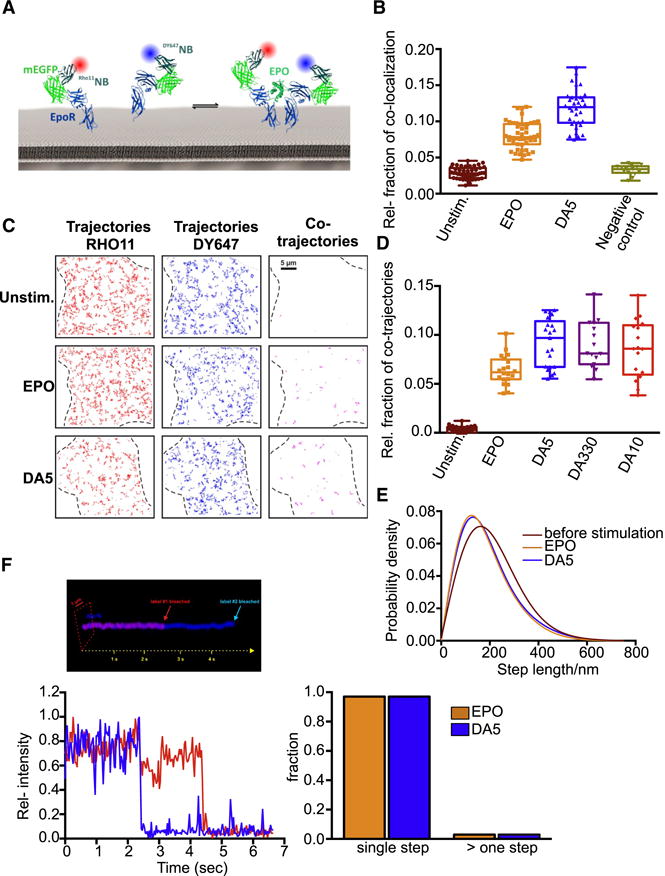
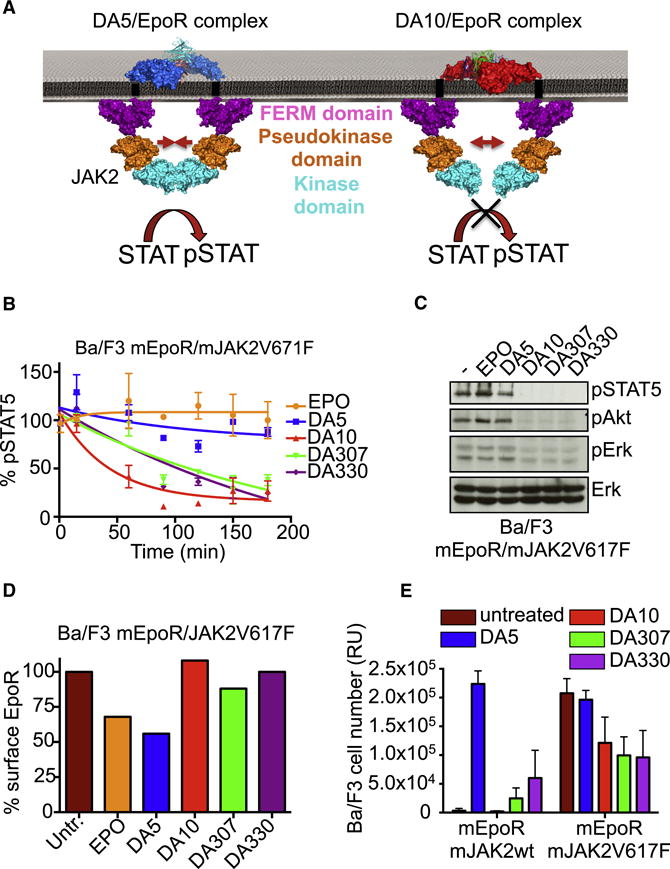
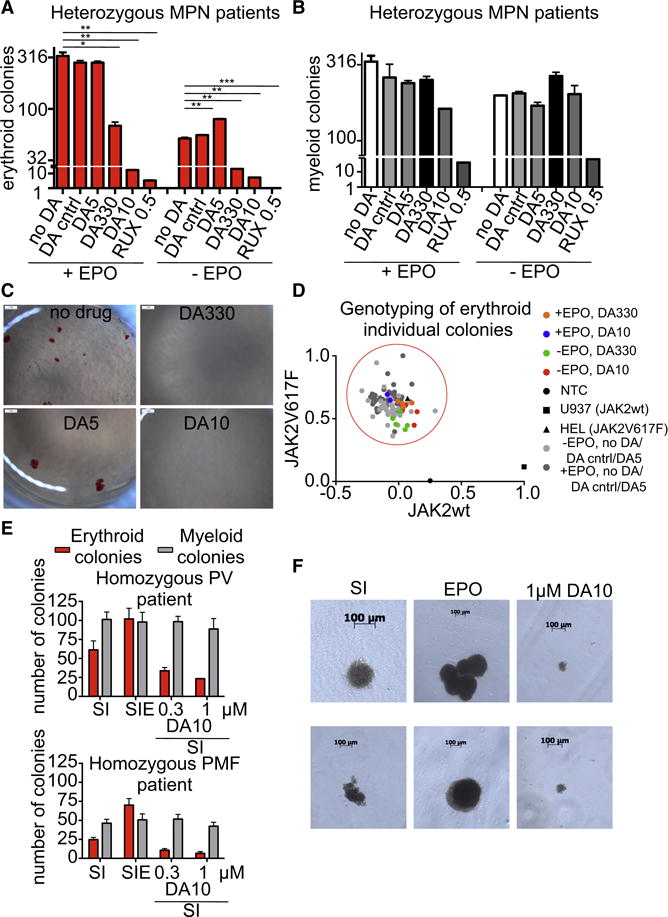
Most cell-surface receptors for cytokines and growth factors signal as dimers, but it is unclear whether remodeling receptor dimer topology is a viable strategy to "tune" signaling output. We utilized diabodies (DA) as surrogate ligands in a prototypical dimeric receptor-ligand system, the cytokine Erythropoietin (EPO) and its receptor (EpoR), to dimerize EpoR ectodomains in non-native architectures. Diabody-induced signaling amplitudes varied from full to minimal agonism, and structures of these DA/EpoR complexes differed in EpoR dimer orientation and proximity. Diabodies also elicited biased or differential activation of signaling pathways and gene expression profiles compared to EPO. Non-signaling diabodies inhibited proliferation of erythroid precursors from patients with a myeloproliferative neoplasm due to a constitutively active JAK2V617F mutation. Thus, intracellular oncogenic mutations causing ligand-independent receptor activation can be counteracted by extracellular ligands that re-orient receptors into inactive dimer topologies. This approach has broad applications for tuning signaling output for many dimeric receptor systems.


Figures

Fig. 1
Fig. 1. EpoR dimerization and signaling potencies induced by EMPs and diabodies
(A,B) Levels of EpoR dimerization (A) and phosphorylation (B) promoted by EMPs at the indicated doses. Data (mean +/− SD) are from four independent replicates (C) Schematic view of a bivalent diabody molecule. VH is connected to the VL domain by a short Gly-linker. EpoR binding sites in the diabody are highlighted with a yellow circle. (D,E) Levels of EpoR dimerization (D) and phosphorylation (E) promoted by diabodies at the indicated doses. Data (mean +/− SD) are from four independent replicates (F) Percentage of pSTAT5 activation induced by the indicated doses of EPO or the four diabodies in Ba/F3 EpoR cells. Data (mean +/− SD) are from two independent experiments. (G) Ba/F3 proliferation in response to EPO or the four diabodies. Data (mean +/− SD) are from two independent replicates (H) Number of CFU-E colonies derived from mouse bone marrow induced by EPO and the four diabodies. Data (mean +/− SD) are from three different experiments. See also Figure S1, Figure S2 and Figure S3.
Fig. 2
Fig. 2. “Biased” signaling activation induced by the diabodies
(A) Bubble plot representation of the signaling pathways activated by EPO and the three diabodies at the indicated times in UT-7-EpoR cells. The size of the bubble represents the intensity of the signal activated. (B) The levels of signal activation induced by the three diabodies at 15 min of stimulation were normalized to those induced by EPO and order based on signaling potency. The red line represents the EPO signaling activation potency normalized to 100 %. Data (mean +/− SD) are from three independent replicates. (C) pSTAT1 and pSTAT5 dose-response experiments performed in UT-7-EpoR cells stimulated with EPO or DA5 for 15 min. Data (mean +/− SD) are from two independent replicates. (D) Bubble plot representation of genes induced by EPO and the three diabodies after stimulation of MEP cells for two hours. The size of the bubble represents the fold of gene induction. See also Figure S3 and Table S1.
Fig. 3
Fig. 3. Crystal structures of DA5, DA10 and DA330 in complex with EpoR
(A) Overlay of the three diabody_EpoR complexes. EpoR binding to DA5 is colored green, EpoR binding to DA10 is colored red and EpoR binding to DA330 is colored purple. The DA330 crystal lattice appears to contain domain-swapped diabodies as scFv in similar but not identical subunit relationships. (B) Diabodies binding footprint on the EpoR surface. Amino acids on EpoR interacting with the diabodies are colored white. DA5 CDRs are colored green; DA10 CDRs are colored red and DA330 CDRs are colored purple. Vectors connecting the VH CDR1 and the VL CDR1 in the diabodies define the binding topology of the three diabodies_EpoR complexes. (C–D) Diabodies and EPO binding footprint on the EpoR surface. Hot-spot interaction on EpoR are colored lime and are shared by the diabodies and EPO. Diabodies use Y34, R98 (DA5), Y105 (DA10), Y32, R101 (DA330) to interact with the amino acids forming the two hot-spots on EpoR. EPO uses similar chemistry with F43 and K45 filling the two hot-spots pockets on EpoR. (E–H) Crystal structures of DA5 (E), DA10 (F), DA330 (G), and EPO (H) dimerizing two EpoR are shown in top (left) and side (right) views. In the side view representation, EpoR is depicted as surface. Yellow spheres represent the C-terminal region of the SD2 EpoR domain. See also Figure S4, Figure S5, Figure S6 and Table S2.
Fig. 4
Fig. 4. Diabodies dimerize EpoR in the surface of living cells
(A) Cell surface labeling of EpoR using dye-labeled anti-GFP nanobodies. (B) Relative co-localization of RHO11EpoR and DY647EpoR in absence and presence of ligand. As a negative control, co-localization of maltose binding protein fused to an indifferent transmembrane domain is shown. (C) Trajectories (150 frames, ~4.8 s) of individual Rho11-labeled (red) and DY647-labeled EpoR (blue) and co-trajectories (magenta) for unstimulated cells as well as after stimulation with EPO (5 nM) and DA5 (250 nM). (D) Relative amount of co-trajectories for unstimulated EPOR and after stimulation with EPO and diabodies (DA5, DA330, DA10). (E) Diffusion properties of EpoR represented as trajectory step-length distribution for unstimulated cells and after dimerization with EPO or DA5. The curves correspond to fitted data from >10 cells (~1500 trajectories each). (F) Diabody-induced dimerization of EpoR demonstrated by dual-step bleaching analysis. Upper panel: A pseudo-3D kymograph illustrating dual-color single-step bleaching for an individual DA5-induced EpoR co-trajectory. Bottom left panel: The corresponding pixel-intensity profiles are shown for both acquisition channels. Bottom right panel: The fraction of signals within co-trajectories that decay within a single step vs. multiple steps. Comparison for complexes obtained with EPO (from 154 co-trajectories) and DA5 (from 186 co-trajectories).
Fig. 5
Fig. 5. DA10 and DA330 inhibit JAK2V617F constitutive activity
(A) Model depicting the mechanism by which the diabodies affect signaling activation potencies. The large dimer intersubunit distances exhibited by the diabodies may alter the position of JAK2 upon ligand binding, decreasing its ability to transactivate each other and start downstream signaling amplification. (B) Kinetics of pSTAT5 in Ba/F3 cells expressing the JAK2V617F mutant after stimulation with EPO or the four diabodies. DA10, DA307 and DA330 induce a decrease on the basal pSTAT5 levels in a time dependent manner. Data (mean +/− SD) are from two independent experiments. (C) pSTAT5, pErk and pAkt levels induced by 1 μM of the four diabodies in Ba/F3 cells expressing the JAK2V617F mutant after 3 hrs of stimulation. (D) EpoR surface levels after 1 hr stimulation with EPO or the four diabodies. (E) Proliferation of Ba/F3 cells expressing JAK2 wt or JAK2 V617F in response to 1 μM of each of the four diabodies after 5 days of stimulation. Data (mean +/− SD) are from three independent experiments.
Fig. 6
Fig. 6. DA10 and DA330 inhibit erythroid colony formation in JAK2V617F-positive patients samples
(A) Number of erythroid BFU-E (EPO-dependent) colonies in heterozygous JAK2V617F positive myeloproliferative neoplasm patient samples after stimulation with the indicated ligands. Data (mean +/− SD) are from three different donors. (B) Number of myeloid colonies in heterozygous JAK2V617F positive myeloproliferative neoplasm patient samples after stimulation with the indicated ligands. (C) Overview pictures highlight EPO-independent BFU-E colonies (no drug and DA5) which are significantly diminished with DA330 and DA10 treatment. *P < 0.05; **P < 0.01; ***P < 0.001; paired Student’s t-test was used to determine significant changes. (D) The genotype of 109 erythroid colonies derived from sorted CD34+ cells derived from PMF cases was determined by multiplexed custom TaqMan SNP assay for JAK2V617F and JAK2 wildtype. Each colony is represented by a single dot in the graph and colored according to different treatment regimens. Grey dots represent colonies derived from conditions without treatment or treatment with an agonist (dark grey with EPO, light grey without EPO), orange and green dots represent few residual colonies treated with DA330, and blue and red dots very rare residual colonies treated with DA10. (E) Number of erythroid colonies (Burst-forming units-erythroid (BFU) or endogenous erythroid colonies (EEC)) and myeloid colonies (EPO-independent) in a Polycythemia Vera (PV) (top panel) and primary Myelofibrosis (PMF) patient (bottom panel) homozygous for JAK2V617F. SI: SCF + IL-3; SIE: SCF +IL-3 + EPO. Data (mean +/− SD) are from three different donors. (F) Morphology of EEC colonies after treatment with the indicated conditions is shown.

Similar articles

Cited by

References

    1. Ballinger MD, Wells JA. Will any dimer do? Nat Struct Biol. 1998;5:938–940. - PubMed
    1. Barclay JL, Kerr LM, Arthur L, Rowland JE, Nelson CN, Ishikawa M, d’Aniello EM, White M, Noakes PG, Waters MJ. In vivo targeting of the growth hormone receptor (GHR) Box1 sequence demonstrates that the GHR does not signal exclusively through JAK2. Mol Endocrinol. 2010;24:204–217. - PMC - PubMed
    1. Baxter EJ, Scott LM, Campbell PJ, East C, Fourouclas N, Swanton S, Vassiliou GS, Bench AJ, Boyd EM, Curtin N, et al. Acquired mutation of the tyrosine kinase JAK2 in human myeloproliferative disorders. Lancet. 2005;365:1054–1061. - PubMed
    1. Bazan JF. Haemopoietic receptors and helical cytokines. Immunol Today. 1990;11:350–354. - PubMed
    1. Bivona TG, Hieronymus H, Parker J, Chang K, Taron M, Rosell R, Moonsamy P, Dahlman K, Miller VA, Costa C, et al. FAS and NF-kappaB signalling modulate dependence of lung cancers on mutant EGFR. Nature. 2011;471:523–526. - PMC - PubMed

Publication types

MeSH terms