. 2015 Apr 2;58(1):147-56.
doi: 10.1016/j.molcel.2015.01.027. Epub 2015 Feb 26.

Bursty gene expression in the intact mammalian liver

Affiliations

Bursty gene expression in the intact mammalian liver

Keren Bahar Halpern et al. Mol Cell. .

Abstract

Bursts of nascent mRNA have been shown to lead to substantial cell-cell variation in unicellular organisms, facilitating diverse responses to environmental challenges. It is unknown whether similar bursts and gene-expression noise occur in mammalian tissues. To address this, we combine single molecule transcript counting with dual-color labeling and quantification of nascent mRNA to characterize promoter states, transcription rates, and transcript lifetimes in the intact mouse liver. We find that liver gene expression is highly bursty, with promoters stochastically switching between transcriptionally active and inactive states. Promoters of genes with short mRNA lifetimes are active longer, facilitating rapid response while reducing burst-associated noise. Moreover, polyploid hepatocytes exhibit less noise than diploid hepatocytes, suggesting a possible benefit to liver polyploidy. Thus, temporal averaging and liver polyploidy dampen the intrinsic variability associated with transcriptional bursts. Our approach can be used to study transcriptional bursting in diverse mammalian tissues.


Figures

Figure 1
Figure 1
Single molecule measurements of intrinsic variability in the intact mouse liver. (A) Single molecule transcript counting enables controlling for ploidy and spatial location of cells. Red dots are single mRNA molecules of Pck1, blue are DAPI-stained nuclei, green is Phalloidin membrane staining. PP – periportal zone, PC – pericentral zone. Scale bar is 30 um. Image is a maximal projection of 12 optical sections spaced 0.3um apart. (B) Magnified view of the boxed region in panel (A) showing polyploid hepatocytes with one or two nuclei, each with either 2,4 or 8 copies of each chromosome. (C) Hepatocytes of the same ploidy and tissue zone exhibit substantial intrinsic variability in gene expression. Blue bars are the distributions of the numbers of Pck1 mRNA per cell in tetraploid hepatocytes in the pericentral zone. Red - theoretical probability distribution function (PDF) expected from a one-state non-bursty model, green - distribution of a bursty two-state model. See also Figure S1.
Figure 2
Figure 2
Single molecule detection and quantification of bursting promoters in the intact mouse liver. (A) Two state bursting model of gene expression. f is the fraction of promoters that are actively transcribing, μ is the transcription rate from an active promoter, δ is the mRNA degradation rate and n is the number of gene copies (ploidy). kON, kOFF are the rates of promoter opening/closing respectively. (B) Dual color labeling of introns and exons reveals active transcription sites (TS). Red dots are Actb mRNA detected using a probe library targeting the exons. Green dots are pre-mRNA detected using a probe library targeting the introns. (C) Actb exhibits rare TS with low transcription rate and stable mRNA (low f, μ and δ). (D) Pck1 exhibits abundant intense TS and high degradation rates (high f, μ and δ). Outlined are two adjacent hepatocytes with substantial difference in transcript counts. Arrowheads mark TS. (E) Ratio of intensities of exon dots at TS to those of mature mRNA facilitates extracting polymerase occupancy and transcription rate (μ). Shown are the distributions of the exonic channel intensities of Pck1 for non-TS dots (top) and TS dots (bottom). Inset shows dot examples. Gray ovals represent Pol2 molecules, green dots represent smFISH probes. See also Figures S2 and S3.
Figure 3
Figure 3
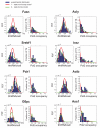
Distributions of cellular mRNA content and of polymerase occupancies fit a two-state bursty model. Left plots for each gene are the probability distribution functions (PDF) of the number of cytoplasmic mRNA per cell, right plots show the PDF of Pol2 occupancies (M). Red is a 1-state non-bursty model fit; green is a 2-state bursty model fit. Both distributions show a better fit to a 2-state bursty model for all genes (Table S1 provides mean square errors of the model fits). All data is for tetraploid hepatocytes in the periportal zone. See also Figures S4 and S5.
Figure 4
Figure 4
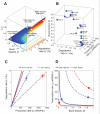
Burst parameters facilitate rapid response while minimizing noise. (A) Coefficient of variation (C.V.) of cellular mRNA among cells with identical mean expression (set to 100 mRNA/cell) increases with degradation rate and decreases with burst fraction. Supplementary equation [18] was used with to kON = 0.5 to generate the distributions used for calculating C.V. μ was tuned for every combination of f and δ to maintain the same steady state. (B) 3D expression parameter space of liver genes. PP-periportal zone, PC- pericentral zone, f prefix denotes fasting state, h prefix denotes highly-fed state. (C) Projection of gene expression space of G6pc (blue) and Pck1 (red) in the periportal zone in fasting (dashed lines) and high-fed (solid lines) metabolic states. X-axis is production rate (β = 4 · f · μ), Y-axis is degradation rate (δ). Data are represented as mean +/− SEM. (D) Projections of the gene expression space on transcription rate (μ) and burst fraction (f) axes. Higher expression in fasting states is attained by increasing burst fraction and degradation rates and to a lesser extent transcription rate. Data are represented as mean +/− SEM. Lines in (C-D) have identical mean transcript level, obtained by different combinations of the gene expression parameters.
Figure 5
Figure 5
Elevated mRNA and protein degradation rates facilitate rapid decline in mRNA and protein levels for G6pc over 1 hour. (A-B) G6pc mRNA (red dots) in mice fasted for 5 hours before (A) and after (B) 1 hour of refeeding. Arrowheads mark TS. Scale bar is 5um. (C) Decrease in transcription rate (left), cytoplasmic mRNA concentration (middle) and protein concentration (right) over an hour of refeeding. (D) Representative western blot for G6PC protein used to calculate the decline in G6PC protein levels presented in (C). α-Tubulin (bottom) was used as a loading control. Data are represented as mean +/− SEM. See also Figure S6.
Figure 6
Figure 6
Tetraploid hepatocytes have reduced gene-expression noise compared to diploid hepatocytes. (A) Examples of Actb expression among diploid cells (left) and tetraploid cells (right). Cell outlines (white dashed lines) are based on phalloidin membrane staining. Scale bar is 5um. (B) Probability distribution function of mRNA concentrations in diploid (gray) and tetraploid (black) hepatocytes for Actb in the periportal zone of a 5-month old mouse in a fed state. Coefficients of variation (C.V.s) are 0.35 for diploids and 0.28 for tetraploids. (C) Single-cell variability in cytoplasmic mRNA concentrations are smaller in tetraploid (4n) hepatocytes compared to diploid (2n) hepatocytes. Every dot is a gene in one of the conditions studied, shown are the ratios of mean cytoplasmic concentration (blue), and C.V. (green). All genes and conditions analyzed had mean concentrations that were not significantly different, and 8 out of these 10 genes had significantly lower C.V.s. in tetraploids.

Comment in

References

    1. Bahar R, Hartmann CH, Rodriguez KA, Denny AD, Busuttil RA, Dollé MET, Calder RB, Chisholm GB, Pollock BH, Klein CA, et al. Increased cell-to-cell variation in gene expression in ageing mouse heart. Nature. 2006;441:1011–1014. - PubMed
    1. Blake WJ, KÆrn M, Cantor CR, Collins JJ. Noise in eukaryotic gene expression. Nature. 2003;422:633–637. - PubMed
    1. Blake WJ, Balázsi G, Kohanski MA, Isaacs FJ, Murphy KF, Kuang Y, Cantor CR, Walt DR, Collins JJ. Phenotypic Consequences of Promoter-Mediated Transcriptional Noise. Mol. Cell. 2006;24:853–865. - PubMed
    1. Boettiger AN, Levine M. Rapid Transcription Fosters Coordinate snail Expression in the Drosophila Embryo. Cell Rep. 2013;3:8–15. - PMC - PubMed
    1. Braeuning A, Ittrich C, Köhle C, Hailfinger S, Bonin M, Buchmann A, Schwarz M. Differential gene expression in periportal and perivenous mouse hepatocytes. FEBS J. 2006;273:5051–5061. - PubMed

Publication types

LinkOut - more resources