. 2015 Jul;207(1):172-187.
doi: 10.1111/nph.13343. Epub 2015 Feb 27.

Modular organization of the white spruce (Picea glauca) transcriptome reveals functional organization and evolutionary signatures

Affiliations

Modular organization of the white spruce (Picea glauca) transcriptome reveals functional organization and evolutionary signatures

Elie S M Raherison et al. New Phytol. 2015 Jul.

Abstract

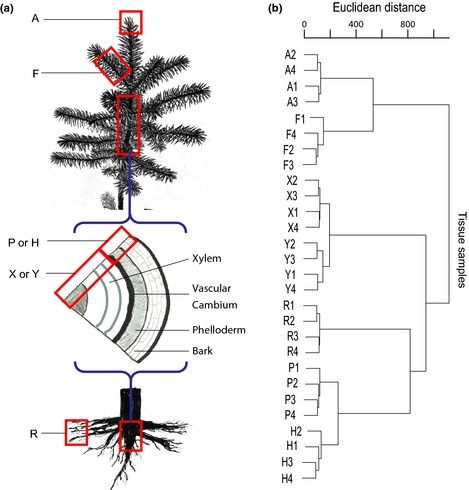
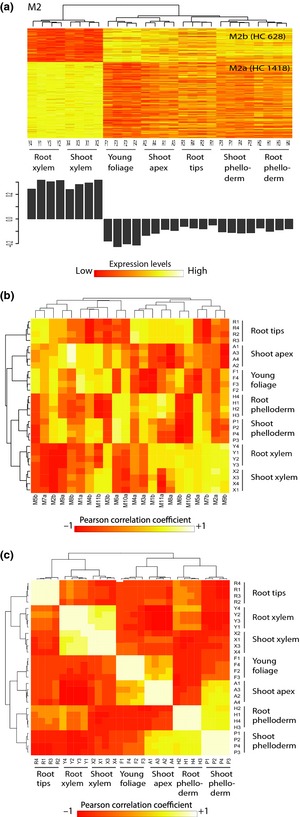
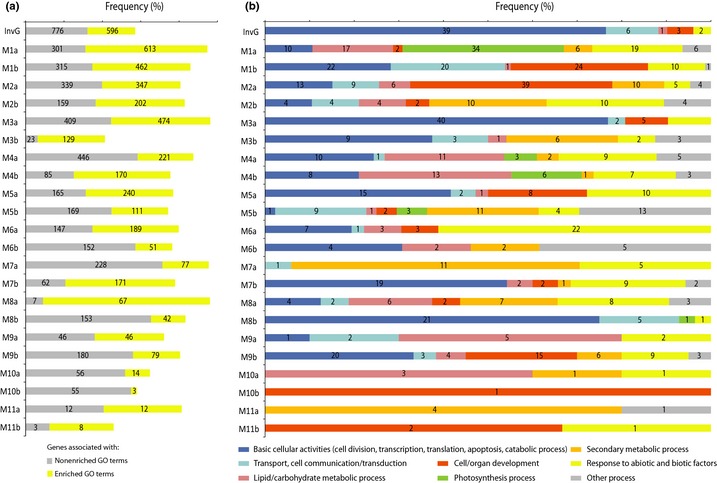
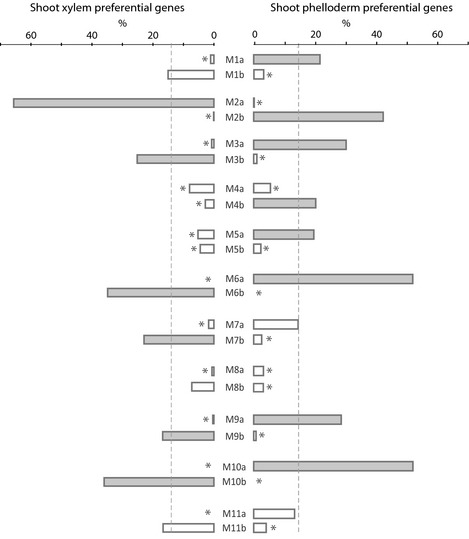
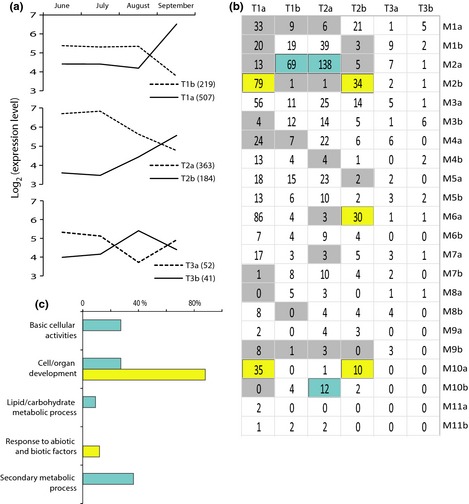
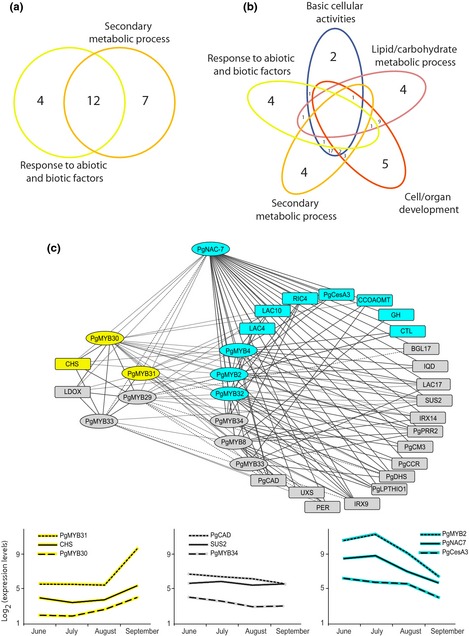
Transcript profiling has shown the molecular bases of several biological processes in plants but few studies have developed an understanding of overall transcriptome variation. We investigated transcriptome structure in white spruce (Picea glauca), aiming to delineate its modular organization and associated functional and evolutionary attributes. Microarray analyses were used to: identify and functionally characterize groups of co-expressed genes; investigate expressional and functional diversity of vascular tissue preferential genes which were conserved among Picea species, and identify expression networks underlying wood formation. We classified 22 857 genes as variable (79%; 22 coexpression groups) or invariant (21%) by profiling across several vegetative tissues. Modular organization and complex transcriptome restructuring among vascular tissue preferential genes was revealed by their assignment to coexpression groups with partially overlapping profiles and partially distinct functions. Integrated analyses of tissue-based and temporally variable profiles identified secondary xylem gene networks, showed their remodelling over a growing season and identified PgNAC-7 (no apical meristerm (NAM), Arabidopsis transcription activation factor (ATAF) and cup-shaped cotyledon (CUC) transcription factor 007 in Picea glauca) as a major hub gene specific to earlywood formation. Reference profiling identified comprehensive, statistically robust coexpressed groups, revealing that modular organization underpins the evolutionary conservation of the transcriptome structure.

Keywords: conifers; modular organization; tissue differentiation; transcriptional network; transcriptome; white spruce (Picea glauca).


Figures

Figure 1
Figure 1
Classification of collected tissues based on gene expression. (a) Tissue sampling (image provided by Dr A. Séguin). (b) Hierarchical clustering of white spruce (Picea glauca) tissues based on microarray data (log2 scale). The analysis used the hclust function of R with Ward's method (Ward, 1963) and based on expression data of detected genes. A, shoot apex; F, young foliage; X, shoot secondary xylem; Y, root secondary xylem; R, root tips; P, shoot phelloderm; H, root phelloderm. Each tissue was replicated four times (1–4).
Figure 2
Figure 2
Expression module and coexpression groups across tissues in white spruce (Picea glauca). (a) Heatmaps show transcript abundance (log2 scale) of high‐confidence variable genes in the M2 expression module and M2a,b coexpression groups determined with the wgcna package of R. Number in parentheses, number of high‐confidence (HC) variable genes in the coexpression group. Total and low‐confidence variable gene numbers are listed in Supporting Information Table S4. Rows (y‐axis), genes which are listed in Table S1; columns (x‐axis), each of the four replicates of tissues (P1–4, shoot secondary phelloderm; Y1–4, root secondary xylem; R1–4, root tip; X1–4, shoot secondary xylem; F1–4, young foliage; A1–4, shoot apex; H1–4, shoot secondary phelloderm). Bar plots display the eigengene modules (or the first principal components). See Fig. S2 for a graphical representation of other expression modules and coexpression groups. (b) Correlation between coexpression groups (M1a–M11b) and tissues based on eigengene groups. (c) Correlation between tissues based on eigengene groups.
Figure 3
Figure 3
Functional analysis of invariant genes (InvG) and coexpression groups (M1a–M11b) in white spruce (Picea glauca). (a) x‐axis, frequency (%) of genes associated with each of the two annotation categories: enriched and nonenriched biological process gene ontology (GO) terms. Numbers inside bars are the number of genes per category. (b) x‐axis, frequency (%) of enriched GO terms associated with consensus functional classes. Numbers inside bars are the number of enriched GO terms per consensus functional class.
Figure 4
Figure 4
Distribution of secondary xylem or phelloderm preferential genes conserved among Picea species across coexpression groups. Vascular tissue preferential genes in white (P. glauca), Norway (P. abies) and black (P. mariana) spruces were identified in Raherison et al. (2012). Dashed grey vertical lines represent the expected frequency based on chance alone (%) of preferential genes across coexpression groups. Overrepresentation of xylem or phelloderm preferential genes compared with chance alone (hypergeometric test; adjusted P‐value < 0.05) is shown by closed bars and underrepresentation of xylem or phelloderm preferential genes is shown by open bars with an asterisk (hypergeometric test; adjusted P‐value < 0.05). Each of the over‐ and underrepresentations of xylem and phelloderm preferential genes closely matched with the expression profiles of the corresponding coexpression groups as shown in Fig. 2(a) and Supporting Information Fig. S2(a–j).
Figure 5
Figure 5
Distribution of temporally variable xylem expressed genes across coexpression groups. (a) Expression profiles of temporally variable genes in secondary xylem of white (Picea glauca) and Norway (P. abies) spruces. Numbers in brackets are the number of genes within temporally variable clusters (T1a–T3b). (b) Number of temporally variable genes across tissue‐based coexpression groups (M1a–M11b). Grey and blue/yellow areas, under‐ and overrepresentation (hypergeometric test; adjusted P‐value < 0.05), respectively; blue and yellow areas, earlywood and latewood genes, respectively, that is, June–July (T1b and T2a) and September (T1a and T2b) preferential genes that were overrepresented in M2a and M10b, and in M2b, M6a and M10a, respectively. (c) Functional annotation analysis based on gene ontology (GO) term enrichment of earlywood (blue bars) and latewood (yellow bars) genes.
Figure 6
Figure 6
Phenylpropanoid pathway leading to lignin production. Boxes, metabolite; arrows, enzyme reactions; enzymes are reported using a three‐letter code: PAL, phenylalanine ammonia lyase; C4H, cinnamate 4‐hydroxylase; 4CL, 4‐coumarate‐CoA ligase; HCT/C3H, shikimate/quinate hydroxycinnamoyltransferase/p‐coumarate 3‐hydroxylase; CCoAOMT, caffeoyl‐CoA O‐methyltransferase; CCR, cinnamoyl‐CoA reductase; CAD, cinnamoyl alcohol dehydrogenease. Heatmaps next to enzyme name indicate expression value of genes (a1‐4, b1‐2, c1‐3, d1‐9, e1‐3, f1‐2) across tissues (X, Y, P, H, A, F, R); Each expression value is the average of four the biological replicates per tissue; a1‐4, BT112211 (GenBank ID), BT106538, BT119163, BT114680; b1‐2, BT116118, BT117086; c1‐3, BT106671, BT116171, DR551141; d1‐9, BT106698, BT106398, BT101243, BT117977, BT110631, BT102905, BT112333, BT104804, BT114515; e1‐3, DR573886, BT111802, BT112289; f1‐2, BT112280, BT116920; X, shoot secondary xylem; Y, root secondary xylem; P, shoot phelloderm; H, root phelloderm; A, shoot apex; F, young foliage; R, root tips.
Figure 7
Figure 7
Functional annotations, network analysis and temporal expression patterns of PgNAC‐7 (no apical meristerm (NAM), Arabidopsis transcription activation factor (ATAF) and cup‐shaped cotyledon (CUC) transcription factor 007 in Picea glauca) connected genes. (a, b) Venn diagrams show the distribution of PgNAC‐7 (a) negatively and (b) positively connected genes among functional classes. (c) Upper panel, an unweighted and signed network shows connections of PgNAC‐7 with MYB transcription factors (oval‐shaped nodes) and putative genes (rectangle‐shaped nodes) associated with secondary cell wall formation (Mizrachi et al., 2012; Duval et al., 2014). PgNAC‐7/MYB transcription factors and genes are listed in Supporting Information Table S1. LAC4, 10, 17, laccase4, 10 and 17; RIC4, rop‐interactive cdc42/rac‐interactive binding (CRIB) motif‐containing protein 4; CCOAMT, putative caffeoyl‐CoA O‐methyltransferase; GH, glycosyl hydrolase; CTL, chitinase‐like protein; BGL17, β‐glucosidase 17; IQD, protein IQ‐domain; SUS2, sucrose synthase 2; IRX9, 14, irregular xylem (probable β‐1,4‐xylosyltransferase) 9 and 4; PER, peroxidase; UXS, UDP‐xylose synthase; CHS, chalcone synthase; LDOX, leucoanthocyanidin dioxygenase; PgMYB2, 8, 29, 31, 32, 33, 34, MYB transcription factor 2, 8, 29, 31, 32, 33 and 34 in P. glauca; PgPRR2, pinoresinol reductase 2 in P. glauca; PgCesA3, cellulose synthase A 3 in P. glauca; PgCM3, chorismate mutase 3 in P. glauca; PgCCR, cinnamoyl CoA reductase in P. glauca; PgDHS, 3‐deoxy‐d‐arabino‐heptulosonate 7‐phosphate synthase in P. glauca; PgLPTHIO1, esterase/lipase/thioesterase family protein (lysophospholipase 1); PgCAD, cinnamyl alcohol dehydrogenase in P. glauca. Edges or connections are coexpression between genes with a Pearson correlation coefficient < −0.9 (dashed line) or ≥ +0.9 (solid line). Lower panel, temporal variation of genes; node and graph colours, temporal expression of genes in secondary xylem tissue of white (Picea glauca) and Norway (P. abies) spruces during a growing season: blue and yellow, highly expressed genes in June, July or August (earlywood genes) and in September (latewood genes), respectively; grey, temporally invariable genes.

Similar articles

Cited by

References

    1. Aceituno FF, Moseyko N, Rhee SY, Gutiérrez RA. 2008. The rules of gene expression in plants: organ identity and gene body methylation are key factors for regulation of gene expression in Arabidopsis thaliana . BMC Genomics 9: 438. - PMC - PubMed
    1. Allocco DJ, Kohane IS, Butte AJ. 2004. Quantifying the relationship between co‐expression, co‐regulation and gene function. BMC Bioinformatics 5: 18. - PMC - PubMed
    1. Allona I, Quinn M, Shoop E, Swope K, Cyr SS, Carlis J, Riedl J, Retzel E, Campbell MM, Sederoff R. 1998. Analysis of xylem formation in pine by cDNA sequencing. Proceedings of the National Academy of Sciences, USA 95: 9693–9698. - PMC - PubMed
    1. Arabidopsis Genome Initiative . 2000. Analysis of the genome sequence of the flowering plant Arabidopsis thaliana . Nature 408: 796. - PubMed
    1. Baldi P, Pedron L, Hietala AM, La Porta N. 2011. Cold tolerance in cypress (Cupressus sempervirens L.): a physiological and molecular study. Tree Genetics & Genomes 7: 79–90.

Publication types

MeSH terms

Associated data

LinkOut - more resources