. 2015 Feb 12:9:16.
doi: 10.3389/fnins.2015.00016. eCollection 2015.

The inner CSF-brain barrier: developmentally controlled access to the brain via intercellular junctions

Affiliations

The inner CSF-brain barrier: developmentally controlled access to the brain via intercellular junctions

Sophie Whish et al. Front Neurosci. .

Abstract

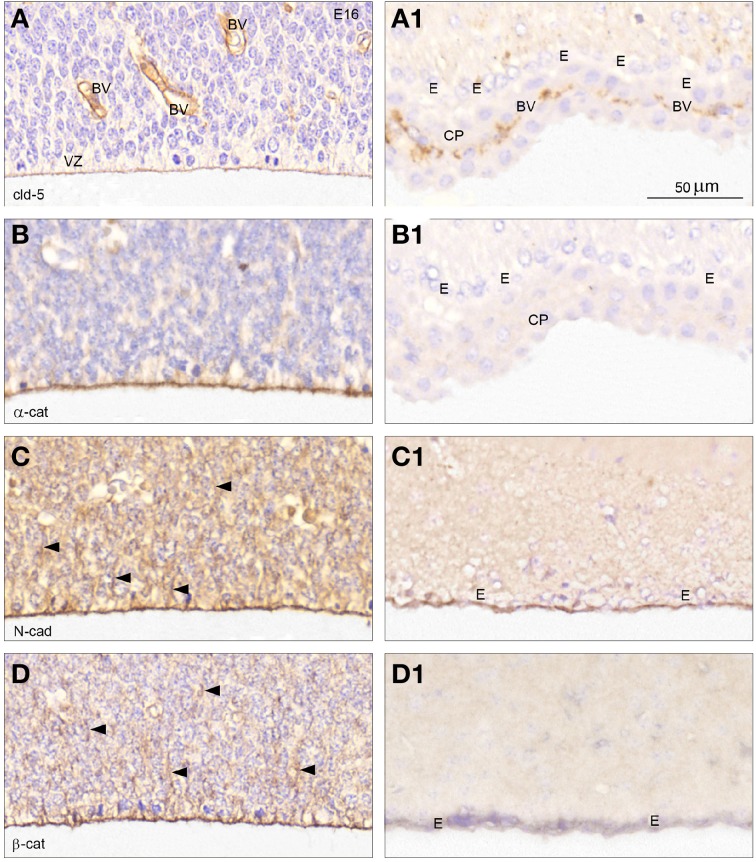
In the adult the interface between the cerebrospinal fluid and the brain is lined by the ependymal cells, which are joined by gap junctions. These intercellular connections do not provide a diffusional restrain between the two compartments. However, during development this interface, initially consisting of neuroepithelial cells and later radial glial cells, is characterized by "strap" junctions, which limit the exchange of different sized molecules between cerebrospinal fluid and the brain parenchyma. Here we provide a systematic study of permeability properties of this inner cerebrospinal fluid-brain barrier during mouse development from embryonic day, E17 until adult. Results show that at fetal stages exchange across this barrier is restricted to the smallest molecules (286Da) and the diffusional restraint is progressively removed as the brain develops. By postnatal day P20, molecules the size of plasma proteins (70 kDa) diffuse freely. Transcriptomic analysis of junctional proteins present in the cerebrospinal fluid-brain interface showed expression of adherens junctional proteins, actins, cadherins and catenins changing in a development manner consistent with the observed changes in the permeability studies. Gap junction proteins were only identified in the adult as was claudin-11. Immunohistochemistry was used to localize at the cellular level some of the adherens junctional proteins of genes identified from transcriptomic analysis. N-cadherin, β - and α-catenin immunoreactivity was detected outlining the inner CSF-brain interface from E16; most of these markers were not present in the adult ependyma. Claudin-5 was present in the apical-most part of radial glial cells and in endothelial cells in embryos, but only in endothelial cells including plexus endothelial cells in adults. Claudin-11 was only immunopositive in the adult, consistent with results obtained from transcriptomic analysis. These results provide information about physiological, molecular and morphological-related permeability changes occurring at the inner cerebrospinal fluid-brain barrier during brain development.

Keywords: barriers; brain development; cerebrospinal fluid; permeability; ventricular zone.


Figures

Figure 1
Figure 1
Injection of biotin dextran amines into the ventricular system of mice. Schematic diagrams (A,B) and images (C,D) illustrating the methods used to inject dextrans into the lateral ventricles of mouse brain. (A) Micropipette injection of dextran into lateral ventricle. (B) Illustrates surface landmarks for injection site. (C) Distribution of dextran following injection. (D) Method used to measure diffusion distance of dextrans (red) using ImageJ64. Mean of 10 measurements, spanning the ventricular zone at right angles to ventricular surface (arrows). Scale bars 500 μm in (C,D). L, length; W, width.
Figure 2
Figure 2
Distribution of Biotin Ethylene Diamine (BED). Coronal sections (paraffin embedded) through cortical wall surrounding lateral ventricles of E17, E19, and P0 mouse brain after BED injection into the contralateral ventricle. Developed with DAB reaction. Note that at E17 there is cellular uptake of BED in some regions of the ventricular zone, but none appears to have penetrated into the brain extracellular space. At E19 and P0 there is both cellular uptake and diffusion into the extracellular space of the brain, especially into the ventral side of the ventricle. Much less staining is detected in the medial wall at all three ages. VZ, ventricular zone; CP, choroid plexus. Scale bar 100 μm in left panels and 50 μm in right panels.
Figure 3
Figure 3
Diffusion of different sized rhodamine labeled biotinylated dextrans (BDA) into postnatal mouse brain. Vibratome coronal sections (80 μm thick) through cortex of mice injected with different sized BDAs (3, 10, and 70 kDa). Markers were injected into the contralateral ventricle and left to diffuse for 2–3 min at E19 and P0, 5 min at P10 and 10 min in the adult. Note that none of the dextrans entered the brain at E19. In older brains there was a progressive increase in penetration depending on the size of the dextran. By adulthood all three dextrans were entering the brain to a similar extent. Apparent diffusion distances shown in Figure 4. Distribution of BED (286 Da) is illustrated in Figure 2 for comparison. E, embryonic day; P, postnatal day. Scale bar 500 μm.
Figure 4
Figure 4
(A) Apparent diffusion distance for three different sized biotinylated dextrans. The values were obtained by measuring the distance to which each marker penetrated into the dorso-lateral wall of the lateral ventricle after injections were made in the contralateral side. Mean ± SEM (only if n > 2), values from individual experiments are illustrated as circles in (B–D). P, postnatal day. Note that none of the dextrans penetrated at E19 (see B–D and Figure 3). (B,C) Standardized apparent diffusion distances compared to theoretical values. Apparent diffusion distances were standardized by estimating the apparent diffusion distance at 1 min after intraventricular injection of each dextran at each age using Fick's second law of diffusion as different sized dextrans were left to diffuse for different periods of time (see Materials and Methods). The broken lines represent the calculated theoretical diffusion distance at 1 min. Each circle represents a value obtained from individual pups. (B) BDA3 kDa appeared to diffuse without restraint from P0. There was no diffusion at E17 or E19 (only E19 illustrated). (C) BDA10 kDa did not enter the ventricular zone at P0 and appeared to diffuse less than the theoretical distance at P10 and P20. (D) BDA70 kDa only penetrated the ependyma at P20 in one pup out or four and in the adult. E, embryonic; P, postnatal.
Figure 5
Figure 5
Total protein concentration in (A) and in CSF (B) during development in the mouse. Mean ± SEM (n = 3–4). *p < 0.05 compared with previous age group. E15 data from Liddelow et al. (2014). In CSF, maximum concentration was in the youngest embryos examined (E15). The lowest concentration was in adults. In plasma the lowest protein concentration was at E15 with a progressive increase to adulthood. ***p < 0.001. E, embryonic day; P, postnatal day.
Figure 6
Figure 6
Tight and adherens junctional proteins in embryonic mouse brain. An overall view of tight and adherens junctional proteins in the ventricular zone of early mouse CSF-brain interface at low magnification in coronal sections of E16 brain showing immunostaining for claudin-5 (A), α-catenin (B), N-cadherin (C), and β –catenin (D). Note the differences in distribution of immunopositive staining between different regions of the surface of the ventricular zone with strongest staining of the dorsolateral telencephalic wall (DLTW) and a weak or lacking immunoreactivity of the ganglionic eminence (GE). Arrows in A point to the border of faint claudin-5 reactivity of the ventricular surface of the dorsolateral wall, and in (C) to the increased staining of the dorsolateral and ventral borders of the ganglionic eminence. The boxed areas in (A–D) are shown in higher magnification in Figure 7. HIP, hippocampus; LV, lateral ventricle; SF, septal fork of the lateral ventricle; SVZ, septal ventricular zone. (A–D) Same magnification, scale bar 500 μm.
Figure 7
Figure 7
Cellular distribution of adherens and tight junctional proteins at the lateral CSF-brain interface. High magnification coronal sections of E16 (A–D) from boxed areas in Figure 6 and of adult (A1–C1) and P20 (D1) forebrain immunostained for claudin-5 (A,A1), α-catenin (B,B1), N-cadherin (C,C1), and for β –catenin (D,D1). (A) At E16 claudin-5 reactivity is prominent in endothelial cells of blood vessels (BV), but a distinct staining is also present corresponding to the apical-most part of the ventricular zone cells (VZ). (A1) In the adult forebrain ependymal cells (E) show no claudin-5 immunoreactivity in marked contrast to the positively stained endothelial cells of fenestrated blood vessels of the choroid plexus (CP). (B–D) At E16 immunostaining for α-catenin (B), N-cadherin (C) and β-catenin (D) outlines the apical and apico-lateral most part of the ventricular zone cells,—compare (A) (apical) and (D) (apical and apico-lateral staining). N-cadherin and β-catenin immunostaining extends into the cytoplasm of the ventricular zone cells (arrowheads in C,D). (B1) Immunoreactivity for α-catenin is not present in adult forebrain, neither in ependymal cells (E) nor in the choroid plexus (CHP). (C1,D1) The surface of the ependymal cells (E) is strongly stained for N-cadherin but only little reactivity is observed after staining for β-catenin in the adult forebrain and virtually no reactivity is observed in the subependymal zone. Same magnification in (A–D) and (A1–D1). Scale bar 50 μm.
Figure 8
Figure 8
Distribution of claudin-11/OSP immunoreactivity in coronal sections of E16 (A) and P15 (B) mouse forebrain. (A) Immunostaining for claudin-11/OSP of the early developing forebrain at E16 demonstrates a lack of reactivity in the entire telencephalic wall. Thus, the apical surface of ventricular zone (VZ) facing the lateral ventricle (LV) is devoid of immunostaining in all subregions— DLTW, dorsolateral telencephalic wall; MW, medial wall; SVZ, septal ventricular zone and GE, ganglionic eminence. The developing arachnoid barrier layer (arrowheads) is however, claudin-11/OSP positive. Leptomeningeal cells in the subarachnoidal space (SAS) and on the outer surface of the telencephalic wall are not stained. (B). At P15 the ependymal zone (E) of lateral ventricle (LV) is unstained in marked contrast to the strongly stained tight junctions of myelin sheaths in early subependymal oligodendrocytes (arrows). Same magnification in (A,B), scale bar 200 μm.
Figure 9
Figure 9
Paravascular distribution of biotin dextrans, following intraventricular injection. Coronal sections of adult brains following intraventricular injection of BDA70K (A) or BDA10K (B). Note that most of the tracer is present in the paravascular or Virchow-Robin space and not in the lumen of blood vessels. Scale bar 200 μm.

Similar articles

Cited by

References

    1. Abbott N. J. (2004). Evidence for bulk flow of brain interstitial fluid: significance for physiology and pathology. Neurochem. Int. 45, 545–552. 10.1016/j.neuint.2003.11.006 - DOI - PubMed
    1. Adams C. L., Nelson W. J., Smith S. J. (1996). Quantitative analysis of cadherin-catenin-actin reorganization during development of cell-cell adhesion. J. Cell Biol. 135, 1899–1911. - PMC - PubMed
    1. Adinolfi M. (1985). The development of the human blood-CSF-brain barrier. Dev. Med. Child Neurol. 27, 532–537. - PubMed
    1. Anders S., Pyl P. T., Huber W. (2015). HTSeq—a Python framework to work with high-throughput sequencing data. Bioinformatics 31, 166–169. 10.1093/bioinformatics/btu638 - DOI - PMC - PubMed
    1. Ayala R., Shu T., Tsai L.-H. (2007). Trekking across the brain: the journey of neuronal migration. Cell 128, 29–43. 10.1016/j.cell.2006.12.021 - DOI - PubMed