

doi: 10.1257/mic.6.2.1.
Neural Activity Reveals Preferences Without Choices
Affiliations
- PMID: 25729468
- PMCID: PMC4339868
- DOI: 10.1257/mic.6.2.1
Item in Clipboard
Neural Activity Reveals Preferences Without Choices
Am Econ J Microecon.
2014 May.
Abstract
We investigate the feasibility of inferring the choices people would make (if given the opportunity) based on their neural responses to the pertinent prospects when they are not engaged in actual decision making. The ability to make such inferences is of potential value when choice data are unavailable, or limited in ways that render standard methods of estimating choice mappings problematic. We formulate prediction models relating choices to "non-choice" neural responses and use them to predict out-of-sample choices for new items and for new groups of individuals. The predictions are sufficiently accurate to establish the feasibility of our approach.
Figures
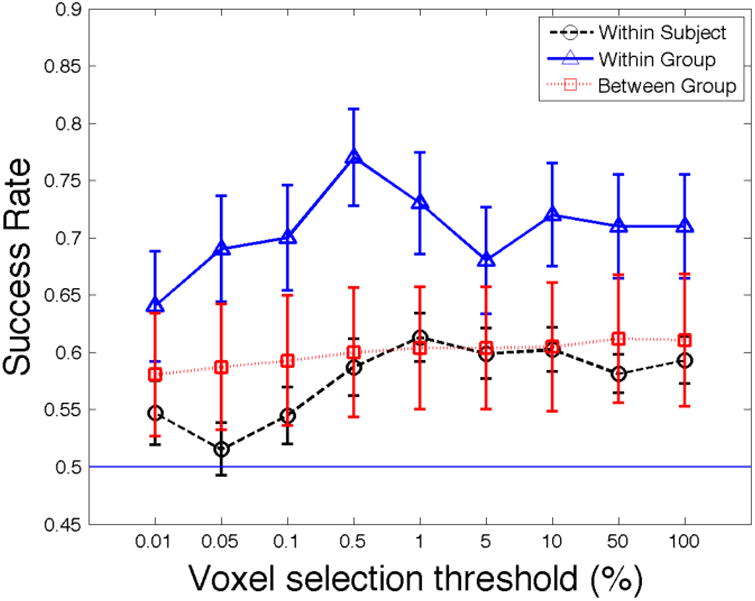
Overall success rate as a function of the percent of voxels retained after initial screening when predicting choices for new items. Notes: The between group standard errors are bootstrapped using the 200 population draws.
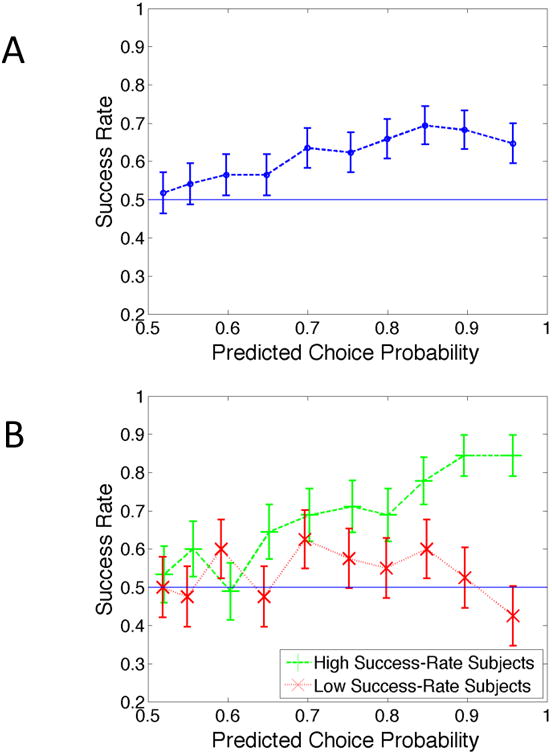
Success rate for within-subject predictions of choices involving new items as a function of predictive choice probability of the more likely item. Notes: (A) the entire group, and (B) separately for high-success-rate and low-success-rate subjects.
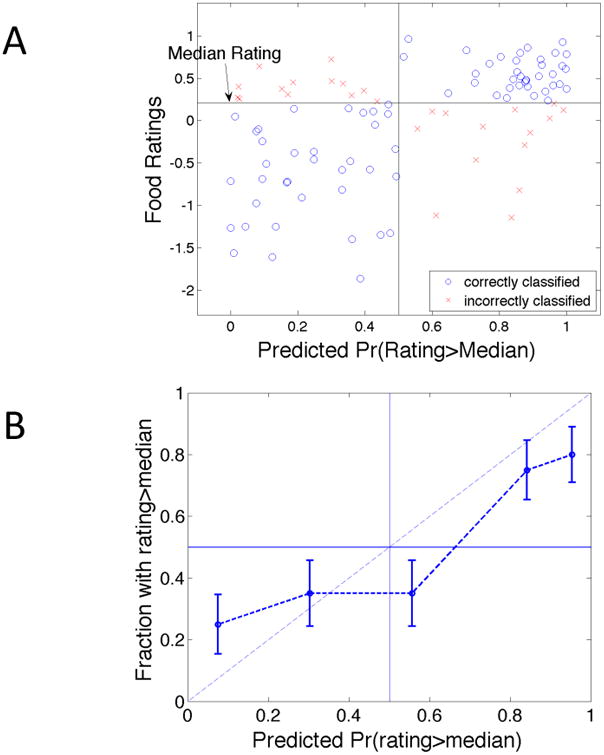
Predicting above-and-below-median ratings for new items within groups. Notes: (A) Scatter plot of mean ratings versus predicted probability that item is in the upper half of the group's valuation distribution. Circles denote correct predictions. Crosses denote incorrect predictions. (B) Fraction of items with ratings exceeding the median versus average predicted probability of rating exceeding the median, grouped by quintiles of the latter.
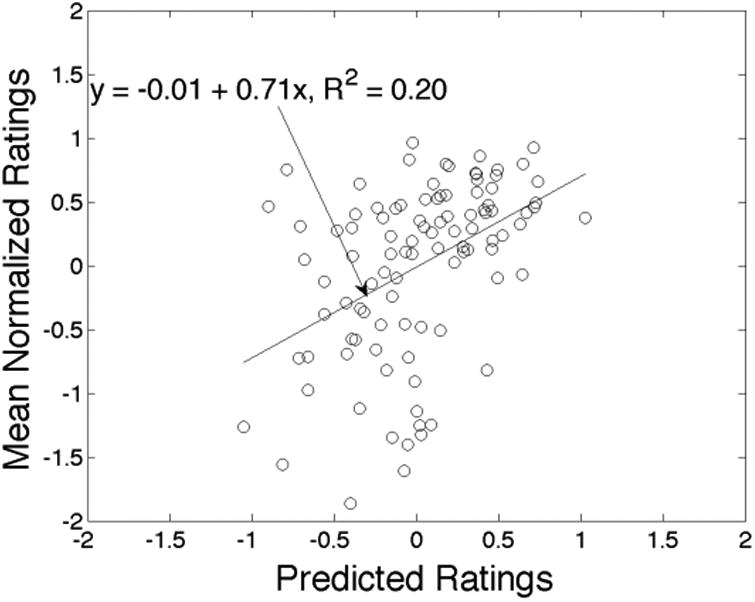
Predicting average ratings for new items within groups. Notes: Scatter plot of actual vs. predicted mean normalized ratings for each item. Each point represents a different food item. Least-squares regression line included.
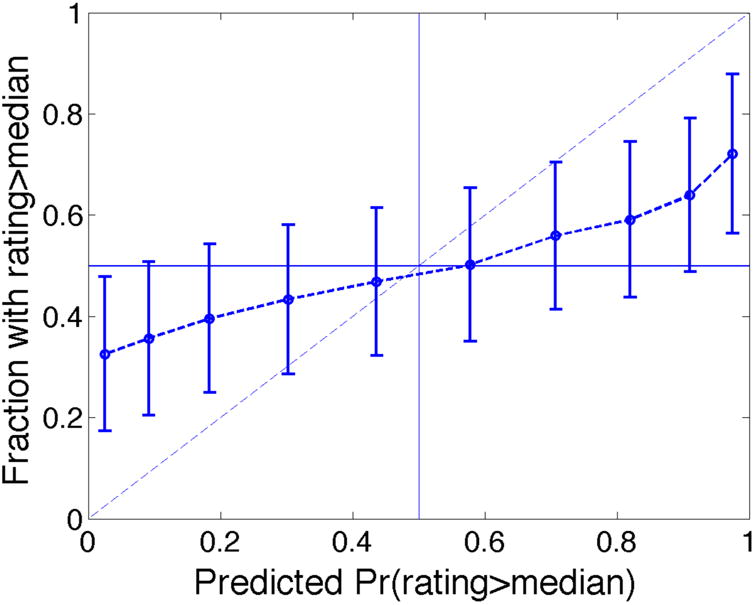
Predicting above-and-below-median average ratings for new items and new groups. Notes: Fraction of items with ratings exceeding the median versus average predicted probability of rating exceeding the median, grouped by deciles of the latter. Standard errors computed via bootstrap over the 200 population draws.
References
-
- Bateman Ian J, Carson Richard T, Day Brett, Hanemann Michael, Hanley Nick, Hett Tannis, Jones-Lee Michael, Loomes Graham, Mourato Susana, Ozdemiroglu Ece, Pearce David W, Sugden Robert, Swanson John. Economic Valuation with Stated Preference Techniques: A Manual. Northampton: Edward Elgar; 2002.
-
- Belloni Alexandre, Chernozhukov Viktor, Hansen Christian. Inference Methods for High-Dimensional Sparse Econometric Models. Advances in Economics and Econometrics; 10th World Congress of the Econometric Society.2011.
-
- Bernheim B Douglas. On the Potential of Neuroeconomics: A Critical (but Hopeful) Appraisal. American Economic Journal: Microeconomics. 2009;1:1–41.
-
- Blackburn McKinley, Harrison Glenn W, Rutstrom E Elisabet. Statistical Bias Functions and Informative Hypothetical Surveys. American Journal of Agricultural Economics. 1994;76:1084–88.
Grants and funding
LinkOut - more resources
Full Text Sources
Other Literature Sources