. 2015 Apr;16(4):397-405.
doi: 10.1038/ni.3122. Epub 2015 Mar 2.

IL-7 coordinates proliferation, differentiation and Tcra recombination during thymocyte β-selection

Affiliations

IL-7 coordinates proliferation, differentiation and Tcra recombination during thymocyte β-selection

Amine Boudil et al. Nat Immunol. 2015 Apr.

Abstract

Signaling via the pre-T cell antigen receptor (pre-TCR) and the receptor Notch1 induces transient self-renewal (β-selection) of TCRβ(+) CD4(-)CD8(-) double-negative stage 3 (DN3) and DN4 progenitor cells that differentiate into CD4(+)CD8(+) double-positive (DP) thymocytes, which then rearrange the locus encoding the TCR α-chain (Tcra). Interleukin 7 (IL-7) promotes the survival of TCRβ(-) DN thymocytes by inducing expression of the pro-survival molecule Bcl-2, but the functions of IL-7 during β-selection have remained unclear. Here we found that IL-7 signaled TCRβ(+) DN3 and DN4 thymocytes to upregulate genes encoding molecules involved in cell growth and repressed the gene encoding the transcriptional repressor Bcl-6. Accordingly, IL-7-deficient DN4 cells lacked trophic receptors and did not proliferate but rearranged Tcra prematurely and differentiated rapidly. Deletion of Bcl6 partially restored the self-renewal of DN4 cells in the absence of IL-7, but overexpression of BCL2 did not. Thus, IL-7 critically acts cooperatively with signaling via the pre-TCR and Notch1 to coordinate proliferation, differentiation and Tcra recombination during β-selection.


Figures

Figure 1
Figure 1
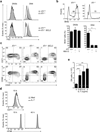
Expression and function of IL-7R in pre- and post-β-selection thymocytes. (a) Flow cytometry of DN3a (CD25+icTCRβ), DN3b (CD25+icTCRβ+) and DN4 (CD25icTCRβ+) thymocytes from wild-type mice (gating strategy, Supplementary Fig. 1) and stained with antibody to IL-7R (Anti-IL-7R), plotted with the fluorescence-minus-one background control (top left), or cultured for 20’ with (+) or without (−) IL-7 and stained with antibody to phosphorylated STAT5 (p-STAT5) (bottom left); right, viability of cells cultured for 10-24 h with or without IL-7, analyzed by staining with propidium iodide and flow cytometry. *P ≤ _0.0001 (unpaired two-tailed Student’s t-test). (b) Flow cytometry of DN3a, DN3b and DN4 Il7r+/+ or Il7r−/− thymocytes that were immediately fixed, permeabilized and stained with antibody to p-STAT5 (left), or stained with antibody to mouse Bcl-2 (mBcl-2), plotted with background control as in a (right). Due to limited cellularity, p-STAT5 was analyzed in total DN3 cells from Il7r−/− mice. Numbers in plots (a, top left, and b) indicate normalized median fluorescence intensity of each marker, calculated by subtraction of the median fluorescence intensity of the fluorescence-minus-one control from that of fully stained cells. Numbers in a (bottom left) indicate normalized median fluorescence intensity p-STAT5 calculated by subtracting the median fluorescence intensity of cells cultured without IL-7 from that of cells cultured with IL-7. Flow cytometry histograms are are representative of three independent experiments with similar results. Viability graphs in a, right, show mean and s.d. of two biological replicates with two technical replicates per group in a, right.
Figure 2
Figure 2
hBcl-2 fails to compensate for loss of IL-7 signaling during β-selection. Thymocytes were counted and analyzed by flow cytomtery to calculate the frequency and total number of cells in each subset. (a) hBcl-2 expression (open) versus FMO control (shaded) in DN2, DN3, and DN4 thymocytes (gated as shown in Supplementary Fig. 1a, c) as well as DP, CD4 and CD8 subsets from Il7r−/− BCL2 mice. Numbers shown in the top right corner of each histogram depict normalized median fluorescence intensity (MFI) of hBcl-2 calculated by subtracting the MFI of the FMO from that of fully stained cells. Similar results were obtained in 3 individual experiments. (b) Bar graphs show the mean (+/− SD) number of cells in each subset for each strain: Il7r+/+ (n=4), Il7r−/− (n=9) and Il7r−/− BCL2 (n=9). The significance of differences between genotypes was assessed using Student’s t-test as described for Fig. 1: *P<0.0001.
Figure 3
Figure 3
Transcriptional response to IL-7 in DN3a, DN3b and DN4 thymocytes. Sorted subsets (4 biological replicates) were cultured with IL-7 (10 ng/ml) or media for 3h prior to isolating RNA and performing Illumina Ref8v2 gene expression profiling. After pre-processing, a paired empirical Bayes moderated t-test with Benjamin-Hochberg correction for multiple testing was conducted using Limma to select probe-sets significantly altered by IL-7 in each subset (FDR q<0.05), which were then collapsed into non-redundant gene lists. (a,b) Bar graphs depict the fold-change (FC) ratio (IL-7-stimulated/unstimulated) of normalized expression values for function-based groups of genes. Asterisks highlight genes more robustly induced by IL-7 in post-selection DN3b and DN4 relative to pre-selection DN3a cells. FC ratios and FDR-adjusted q-values for each gene are indicated in Supplementary Table 2. ND: not detected.
Figure 4
Figure 4
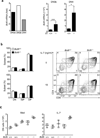
IL-7 signaling promotes DN4 growth and proliferation in vivo. (a) Flow cytometric analysis of forward scatter (FSC), an indicator of cell size and metabolism, of each subset identified as described in Supplementary Fig. 1.: Il7r+/+ (shaded) versus Il7r−/− (open) (Top). Il7r+/+ (shaded) versus Il7r−/− BCL2 (open) (Bottom). (b) Flow cytometric quantification of BrdU incorporation in DN4 cells (Top) from Il7r+/+ and Il7r−/− mice, assessed 2h after the first BrdU injection and identified as shown in Supplementary Fig. 1. Bar graphs show % BrdU+ cells (mean +/− SD) in each subset from Il7r+/+Il7r−/− and Il7r−/− BCL2 mice (Bottom) (3 biological replicates/group). (c) Flow cytometric analysis of CD71 (Top) or CD98 (Bottom) vs CD25 expression, shown as 5% probability contour plots gated on DN CD3 Lin icTCRβ+ thymocytes (d) Histograms show flow cytometric quantification of CD71 expression (Top) or CFSE (Bottom) after WT DN4 thymocytes were cultured in Med (shaded) or IL-7 (open) for 15 or 40h. (e) WT DN4 thymocytes (5×10³/well, indicated by dotted horizontal line) were cultured with OP9-DL4 cells and media containing the indicated IL-7 concentrations for 48h. Bar graphs show the mean (+/− SD) number of DN cells recovered (3 technical replicates/group). The significance of differences between groups was assessed in (b) and (e) using one-way ANOVA with Newman-Keuls post hoc t-test. Similar results were obtained in 3 (a, b, c, e) or 2 independent experiments (d). *P<0.001, **P<0.01, ***P<0.05.
Figure 5
Figure 5
IL-7 signaling delays DN3b and DN4 cell differentiation into DP thymocytes. DN3b or DN4 cells from Il7+/+ and Il7−/− mice were cultured in the absence of stromal cells with or without IL-7 and analyzed by flow cytometry to assess the impact of IL-7 on their differentiation. (a) CD4 versus CD8 expression after DN3b cells from Il7+/+ (white, 3 technical replicates/group) and Il7−/− (black, 4 technical replicates/group) mice were cultured for 15h without (Top) or with (Bottom) IL-7 (Left). Bar graphs show the % (mean +/− SD) of each subset after culture: DN (icTCRβ+ CD4 CD8, ISP (icTCRβ+ CD4 CD8+) and DP (icTCRβ+ CD4+ CD8+) (Right). (b,c) DN4 cells from each genotype were cultured and analyzed by flow cytometry to assess the impact of IL-7 on their differentiation as described for (a). Bar graphs and contour plots show CD4 and CD8 expression on DN4 progeny after 15h without (Top) or with (Bottom) IL-7 (b, 4 technical replicates/genotype/group), or after 5h without IL-7 (c, 3 technical replicates/genotype/group). The significance of differences between means was calculated using Student’s t-test as described for Fig. 1: *P<0.0001, **P<0.001, ***P≤0.01, ****P<0.05. Similar results were obtained in at least 3 independent experiments (a, b, c).
Figure 6
Figure 6
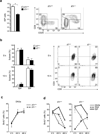
Deletion of Bcl6 improves the self-renewal of DN4 cells in the absence of IL-7. (a) Bcl6 expression in DN3a, DN3b and DN4 wild-type cells cultured in IL-7, presented relative to its expression in their counterparts cultured in medium alone (as in Fig. 3; FDR-adjusted q values, Supplementary Table 2) (left), and quantitative RT–PCR analysis of Bcl6 mRNA in DN3b and DN4 Il7+/+ and Il7−/− thymocytes, normalized to results obtained for Cd45 mRNA. (b) Quantification of cells in the DN, ISP and DP subsets (as in Fig. 5a) among the progeny of DN4 cells sorted from co-cultures of Bcl6+/+ and Bcl6−/− fetal liver hematopoietic progenitor cells cultured for 9 d with OP9-DL4 cells, then re-cultured (after sorting) for 48 h with or without IL-7 (left), and expression of CD4 versus CD8 by the sorted progeny of DN4 cells cultured with or without IL-7 (right), analyzed by flow cytometry (right). (c) Quantification of DN cells among the sorted DN4 cells in b cultured without or with IL-7. Each symbol represents an independent OP9 culture from two Bcl6+/+ or three Bcl6−/− individual fetuses; small horizontal lines indicate the mean (±s.d.). *P < 0.0001, **P ≤ 0.01 (Student’s t-test (a)). Data are representative of two experiments with similar results (mean and s.d. of n = 3 technical replicates per group in a) or one experiment (b,c; mean and s.d. of n = 2 (Bcl6+/+) or 3 (Bcl6−/−) fetuses (three replicate cultures each)).
Figure 7
Figure 7
Il7r−/− DN4 thymocytes are not the precursors of ISP cell subset. (a) Left, thymocytes from Il7+/+ (n=4) and Il7r−/− (n=6) mice were counted and analyzed by flow cytometry to identify ISP cells as CD3 CD24+ cells within the Lin CD4 CD8+ icTCRβ+ subset (See Supplementary Figure 4a). Right, contour plots show representative CD8 vs CD25 distribution gated on Lin CD3 CD4 icTCRβ+ thymocytes. Gates identify ISP (CD25−/+ CD8+), DN4 (CD25 CD8−/lo) and DN3b (CD25+ CD8−/lo) cells in each strain. (b) Sorted ISP cells from each genotype were cultured for 5h (Top) or 15h (Bottom) without IL-7 (3 technical replicates/time point/genotype) and analyzed by flow cytometry as described for Fig. 5 to identify DP (CD4+ CD8+) and ISP (CD4 CD8+) cells. (c, d) Thymocytes from Il7r+/+ and Il7r−/− mice were harvested 2, 24 and 48h after BrdU injection (n=3 biological replicates/time-point/genotype) and analyzed by flow cytometry to measure % BrdU+ (mean +/− SD) cells in DN3a (c), and DN3b (gray filled line), DN4 (black dashed line) and ISP (black filled line) subsets (d). Data for the 2h time-point were re-plotted here from Fig. 4b for comparison. Statistical significance in (a) was assessed using Student’s t-test as described for Fig. 1: *P<0.0001. Similar results were obtained in 3 (a, b) or 2 (c, d) independent experiments.
Figure 8
Figure 8
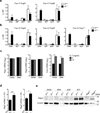
IL-7 signaling prevents premature recombination of Tcra locus in DN4 subset. (a,b) Genomic DNA from DN4, ISP, eDP (CD71hi FSChi) and lDP (CD71lo FSClo) thymocytes was analyzed by qPCR to measure -to- recombination using primers for Trav17 (Vα17) and proximal Traj61 (Jα61) and Traj56 (Jα56) segments (a), or primers for Trav12 (which detect multiple, widely distributed Trav12 (Vα12) family members) and central Traj42 (Jα42) and Traj30 (Jα30) segments vs distal Traj17 (Jα17) segment (b). Bar graphs show relative usage (mean ± SD) in each subset, normalized to levels detected in unfractionated WT thymocytes (n=4, 2 biological replicates/subset/genotype and 2 technical replicate/sort). ND: not detected. (c) Bar graphs depict normalized expression values (Log2 scale) for Rag1, Rag2 and Cish from the Illumina mRNA expression profiling shown in Fig. 3. FDR-adjusted q-values for each comparison are indicated: *FDR q<0.0001. (d) qRT–PCR quantification of Rag1 and Rag2 mRNA in sorted Il7+/+ and Il7−/− DN4 thymocytes (normalized to CD45, 3 technical replicates/group). The significance of differences between groups was assessed using Student’s t-test as described for Fig. 1: *P<0.0001, **P<0.01. (e) Western blotting for Rag2 (top) and β-actin (bottom) protein in the indicated subsets from Il7+/+ and Il7−/− thymi. Protein extracts from total Rag2+/+ and Rag2−/− thymocytes were used as positive and negative controls, respectively. Similar results for each subset were obtained in 2 or more (a, b), 1 (d) and 3 (e) independent experiments.

Comment in

References

    1. Yuan JS, Kousis PC, Suliman S, Visan I, Guidos CJ. Functions of notch signaling in the immune system: consensus and controversies. Annual review of immunology. 2010;28:343–365. - PubMed
    1. Mazzucchelli R, Durum SK. Interleukin-7 receptor expression: intelligent design. Nature reviews Immunology. 2007;7(2):144–154. - PubMed
    1. Akashi K, Kondo M, von Freeden-Jeffry U, Murray R, Weissman IL. Bcl-2 rescues T lymphopoiesis in interleukin-7 receptor-deficient mice. Cell. 1997;89(7):1033–1041. - PubMed
    1. Maraskovsky E, O’Reilly LA, Teepe M, Corcoran LM, Peschon JJ, Strasser A. Bcl-2 can rescue T lymphocyte development in interleukin-7 receptor-deficient mice but not in mutant rag-1−/− mice. Cell. 1997;89(7):1011–1019. - PubMed
    1. Khaled AR, Li WQ, Huang J, Fry TJ, Khaled AS, Mackall CL, et al. Bax deficiency partially corrects interleukin-7 receptor alpha deficiency. Immunity. 2002;17(5):561–573. - PubMed

Publication types

MeSH terms

Associated data