. 2015 Apr 9;20(1):736-46.
doi: 10.2119/molmed.2014.00146.

miR-155 is associated with the leukemogenic potential of the class IV granulocyte colony-stimulating factor receptor in CD34⁺ progenitor cells

Affiliations

miR-155 is associated with the leukemogenic potential of the class IV granulocyte colony-stimulating factor receptor in CD34⁺ progenitor cells

HaiJiao Zhang et al. Mol Med. .

Abstract

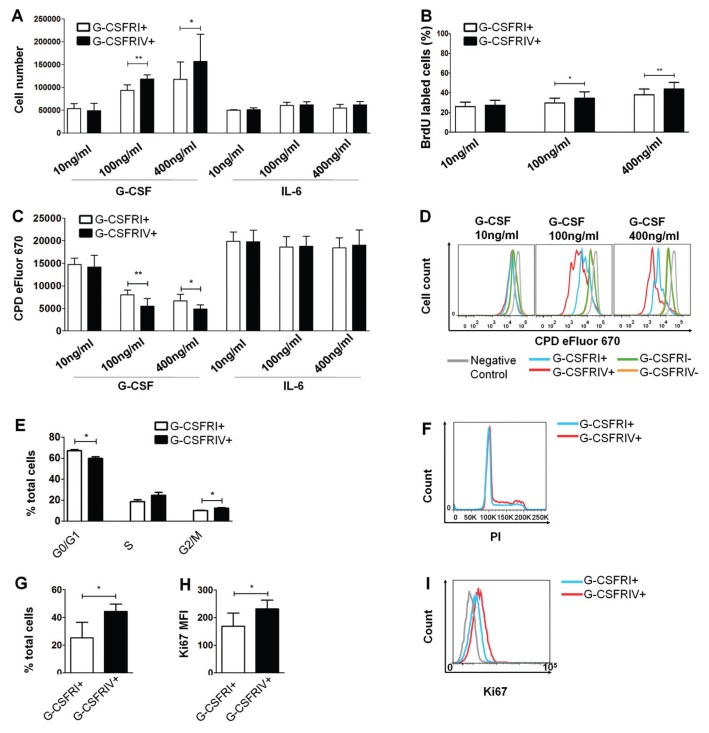
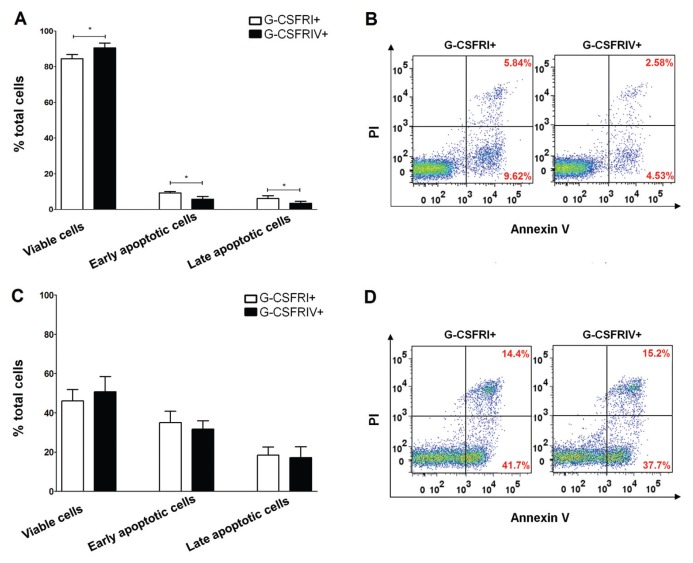
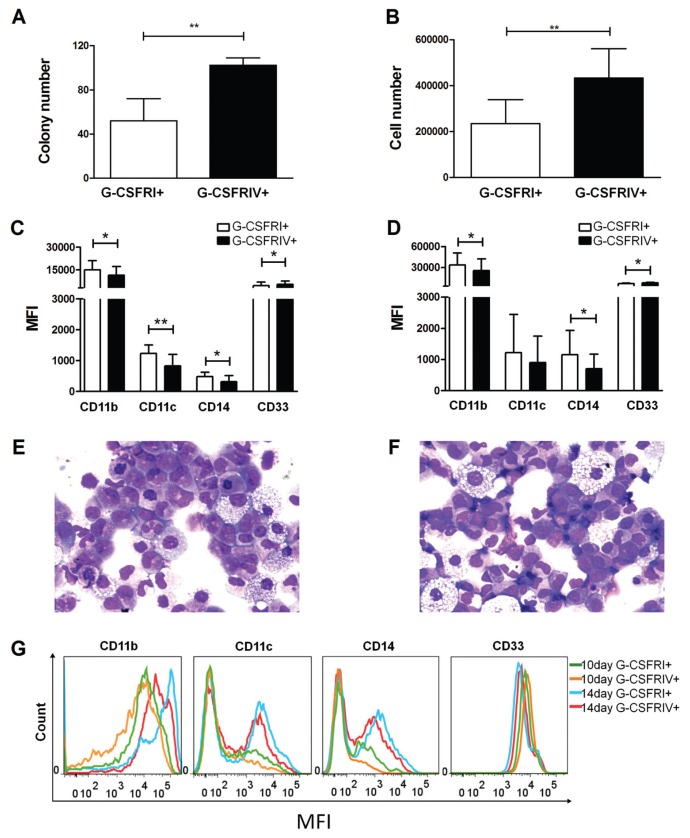
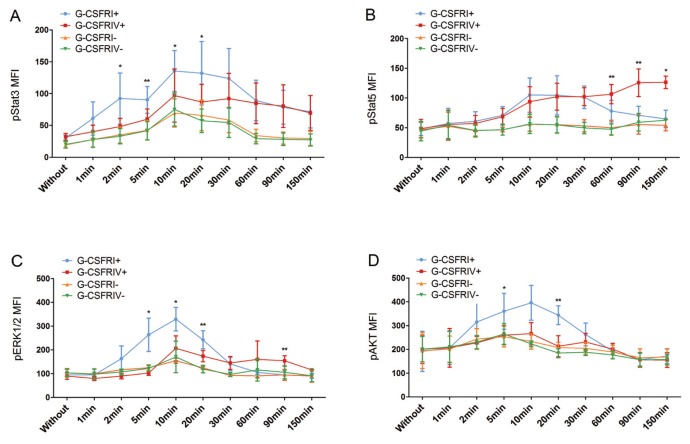
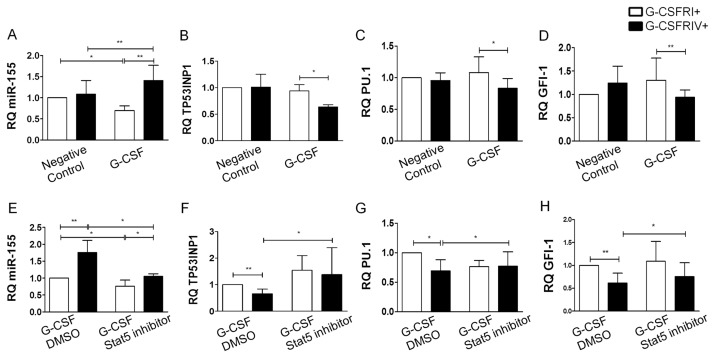
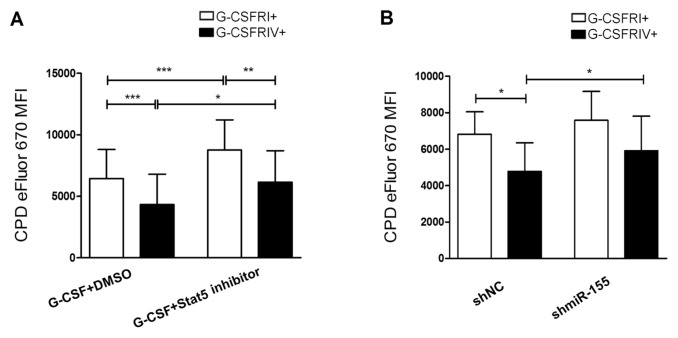
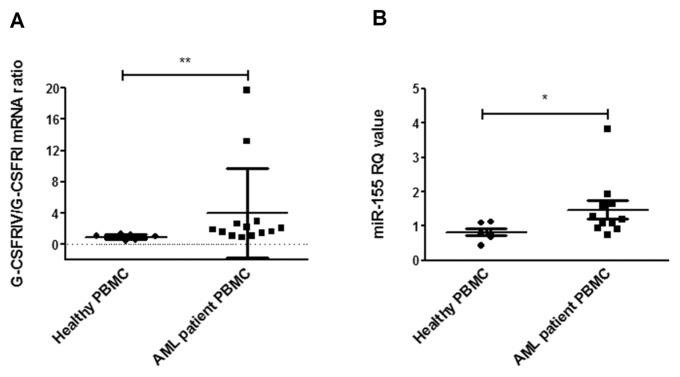
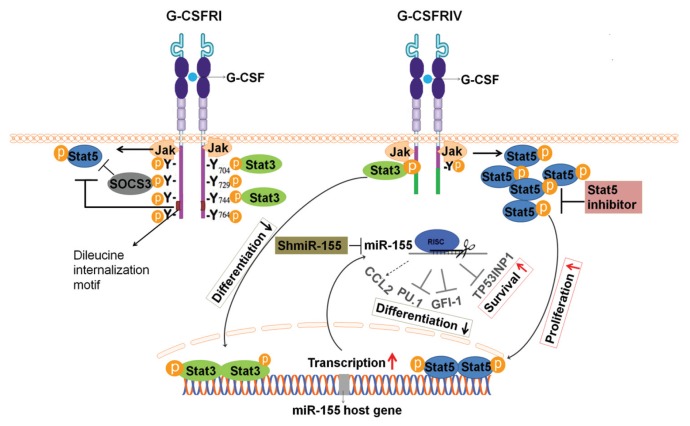
Granulocyte colony-stimulating factor (G-CSF) is a major regulator of granulopoiesis on engagement with the G-CSF receptor (G-CSFR). The truncated, alternatively spliced, class IV G-CSFR (G-CSFRIV) has been associated with defective differentiation and relapse risk in pediatric acute myeloid leukemia (AML) patients. However, the detailed biological properties of G-CSFRIV in human CD34(+) hematopoietic stem and progenitor cells (HSPCs) and the potential leukemogenic mechanism of this receptor remain poorly understood. In the present study, we observed that G-CSFRIV-overexpressing (G-CSFRIV(+)) HSPCs demonstrated an enhanced proliferative and survival capacity on G-CSF stimulation. Cell cycle analyses showed a higher frequency of G-CSFRIV(+) cells in the S and G2/M phase. Also, apoptosis rates were significantly lower in G-CSFRIV(+) HSPCs. These findings were shown to be associated with a sustained Stat5 activation and elevated miR-155 expression. In addition, G-CSF showed to further induce G-CSFRIV and miR-155 expression of peripheral blood mononuclear cells isolated from AML patients. A Stat5 pharmacological inhibitor or ribonucleic acid (RNA) interference-mediated silencing of the expression of miR-155 abrogated the aberrant proliferative capacity of the G-CSFRIV(+) HSPCs. Hence, the dysregulation of Stat5/miR-155 pathway in the G-CSFRIV(+) HSPCs supports their leukemogenic potential. Specific miRNA silencing or the inhibition of Stat5-associated pathways might contribute to preventing the risk of leukemogenesis in G-CSFRIV(+) HSPCs. This study may promote the development of a personalized effective antileukemia therapy, in particular for the patients exhibiting higher expression levels of G-CSFRIV, and further highlights the necessity of pre-screening the patients for G-CSFR isoforms expression patterns before G-CSF administration.


Figures

Figure 1
Figure 1
G-CSFRIV promotes HSPC proliferation and cell cycle progression. CD34+ HSPCs were transduced with G-CSFRI or G-CSFRIV encoding lentiviral vector. (A) Cells (1 × 10⁵) were stimulated with 10, 100 and 400 ng/mL G-CSF or IL-6 for 3 d. Graph displays total cell numbers counted under an optical microscope. (B) Cells (1 × 10⁵) were stimulated with indicated G-CSF concentrations for 1 d and incorporated with BrdU for 3 h followed by anti-BrdU antibody staining and FACS analysis. Anti-CD114 antibody was used to distinguish G-CSFR overexpressing and G-CSFR nonexpressing cells. Graph displays percentages of BrdU-labeled cells in the total G-CSFRI+ and G-CSFRIV+ population. (C) Cells (1 × 10⁵) were labeled with the CPD eFluor 670 and stimulated with G-CSF or IL-6 for 3 d. Cell proliferation was measured by FACS. GFP expression was used to distinguish G-CSFR overexpressing and G-CSFR nontransduced cells. Graph displays MFI of CPD eFluor 670 on G-CSFRI+ and G-CSFRIV+ cells. (D) Representative histograms of CPD eFluor 670 fluorescence levels detected on nonstimulated (negative control), G-CSFRI+, G-CSFRIV+, G-CSFRI and G-CSFRIV HSPCs. Graphs above display mean ± SD of the data acquired in six independent experiments. (E) Enriched G-CSFRI+ and G-CSFRIV+ HSPCs (1.5 × 10⁵) were cultured with 100 ng/mL G-CSF for 3 d and analyzed for cell cycle distribution and Ki67 expression. Graph displays percentages of cells in each phase of the cell cycle. (F) Representative histogram of the cell cycle distribution. (G) Percentages of Ki67-labeled cells of total G-CSFRI+ and G-CSFRIV+ HSPC population. (H) Ki67 MFI of G-CSFRI+ and G-CSFRIV+ HSPCs. (I) Representative histogram of Ki67 expression on G-CSFRI+ and G-CSFRIV+ HSPCs. Data shown are mean ± SD of three independent experiments. Statistically significant differences were calculated using a two-tailed Student t test and are shown with asterisks (*p < 0.05 and **p < 0.01). G-CSFRI, G-CSFRI nontransduced; G-CSFRIV, G-CSFRIV nontransduced.
Figure 2
Figure 2
G-CSFRIV protects HSPCs from apoptosis. (A) Enriched G-CSFRI+ and G-CSFRIV+ HSPCs (1.5 × 10⁵) were cultured with 100 ng/mL G-CSF for 3 d, stained with annexin V/PI and analyzed by FACS. Graph displays higher percentages of viable cells (annexin V/PI) and lower percentages of early and late apoptotic (annexin V+/PI and annexin V+/PI+) cells in the G-CSFRIV+ HSPCs compared with G-CSFRI+ HSPCs. (B) Representative dot plot of apoptosis analyses. On G-CSF stimulation, G-CSFRIV+ HSPCs showed decreased apoptotic rates in comparison to G-CSFRI HSPCs. (Viable cells: left lower quadrant; early apoptotic cells: right lower quadrant; and late apoptotic cells: right upper quadrant.) (C) G-CSFRI+ and G-CSFRIV+ HSPCs (1.5 × 10⁵) were serum and cytokine starved for 1 d and analyzed for apoptotic activity. Graph displays similar percentages of viable, early apoptotic and late apoptotic cells in G-CSFRI+ and G-CSFRIV+ HSPCs. (D) Representative dot plot of annexin V/PI analyses showing comparable apoptotic activity of G-CSFRI+ and G-CSFRIV+ HSPCs without G-CSF stimulation. Data shown are mean ± SD of three independent experiments. Statistically significant differences were calculated using a two-tailed Student t test and are shown with asterisks (*p < 0.05).
Figure 3
Figure 3
G-CSFRIV+ HSPCs demonstrate an increased colony-forming capacity and impaired differentiation. A total of 500 G-CSFRI+ or G-CSFRIV+ HSPCs were cultured in myeloid lineage differentiation medium for 10 or 14 d. Graphs display colony numbers (A) and cell numbers (B) of G-CSFRI+ and G-CSFRIV+ HSPCs after 10 d. Graphs display MFI of CD11b, CD11c, CD14 and CD33 of G-CSFRI+ and G-CSFRIV+ cells after 10 d (C) and 14 d (D). May-Grünwald-Giemsa staining of G-CSFRI+ (E) and G-CSFRIV+ (F) cells after 10 d is shown. (J) Representative histograms for the expression of CD11b, CD11c, CD14 and CD33 of G-CSFRI+ and G-CSFRIV+ cells after 10 and 14 d. Data are mean ± SD of six independent experiments. Statistically significant differences were calculated by using a two-tailed Student t test and are shown with asterisks (*p < 0.05 and **p < 0.01).
Figure 4
Figure 4
G-CSFRIV mediates aberrant activation of the Stat3, Stat5, ERK1/2 and AKT signaling pathways. CD34+ HSPCs were transduced with a lentiviral vector encoding for either G-CSFRI or G-CSFRIV sequences. Unsorted serum-starved cells (1 × 10⁵) were stimulated with 100 ng/mL G-CSF for sequential time points from 0 to 150 min and signaling pathway analysis was performed. GFP expression was used to distinguish G-CSFR overexpressing and nontransduced cells. Levels of phosphorylated proteins at different time points were compared with the respective phosphorylated protein level detected without stimulation. Graph displays MFI of G-CSF–induced phosphorylated Stat3 (A), Stat5 (B), ERK1/2 (C) and AKT (D) in G-CSFRI+, G-CSFRIV+, G-CSFRI and G-CSFRIV HSPCs. Data shown are mean ± SD of six independent experiments. Statistically significant differences were calculated using a two-tailed Student t test and are shown with asterisks (*p < 0.05 and **p < 0.01). G-CSFRI, G-CSFRI nontransduced; G-CSFRIV, G-CSFRIV nontransduced.
Figure 5
Figure 5
Sustained Stat5 activation in G-CSFRIV+ HSPCs upregulates miR-155 and downregulates its target genes expression. Enriched G-CSFRI+ or G-CSFRIV+ HSPCs (2 × 10⁵) were grown in presence or absence of 100 ng/mL G-CSF for 1 d. Levels of miR-155 and its candidate target genes expression were analyzed by real-time PCR. U6 or GAPDH levels were used as endogenous control of miR-155 or mRNA levels, respectively. Levels of the miR155 and all analyzed target genes were normalized to the respective levels detected in the G-CSFRI+ cells without cytokine stimulation. Graphs display RQ values of miR-155 (A), TP53INP1 (B), PU.1 (C) and GFI-1 (D). G-CSFRI+ or G-CSFRIV+ cells (2 × 10⁵) were stimulated with 100 ng/mL G-CSF in combination with DMSO as control or with a Stat5 inhibitor (100 μmol/L) for 1 d. Levels of the miR155 and all analyzed target genes were normalized to the respective levels detected in the G-CSFRI+ cells with G-CSF plus DMSO stimulation. Graphs display RQ values of miR-155 (E), TP53INP1 (F), PU.1 (G) and GFI-1 (H). Data were shown as mean ± SD of six independent experiments. Statistically significant differences were calculated using a two-tailed Student t test and are shown with asterisks (*p < 0.05 and **p < 0.01).
Figure 6
Figure 6
G-CSFRIV–mediated hyperproliferative response is compromised in the presence of a Stat5 inhibitor or shmiR-155. (A) CD34+ HSPCs were transduced with a lentiviral vector containing either G-CSFRI or G-CSFRIV encoding sequences. Cells (1 × 10⁵) were labeled with CPD eFluor 670 and stimulated with 100 ng/mL G-CSF together with DMSO as control or with a Stat5 inhibitor (100 μmol/L) for 3 d followed by FACS analysis. GFP expression was used to distinguish G-CSFR overexpressing and nontransduced cells. Graph displays MFI of CPD eFluor 670 on G-CSFRI+ and G-CSFRIV+ HSPCs. Data are mean ± SD of eight independent experiments. (B) CD34+ HSPCs were transduced with a G-CSFRI or G-CSFRIV encoding lentiviral vector together with shmiR-155 or shNC. GFP and DsRed were used to distinguish transduced and nontransduced cells. Cells (1 × 10⁵) were labeled with CPD eFluor 670 and stimulated with 100 ng/mL G-CSF for 3 d followed by FACS analysis. Graph displays MFI of CPD eFluor 670 on G-CSFRI+ shNC, G-CSFRI+ shmiR-155, G-CSFRIV+ shNC and G-CSFRIV+ shmiR-155 cells. The data shown are mean ± SD of four independent experiments. Statistically significant differences were calculated using a two-tailed Student t test and are shown with asterisks (*p < 0.05, **p < 0.01 and ***p < 0.001).
Figure 7
Figure 7
G-CSF induces G-CSFRIV and miR-155 expression in PBMCs from AML patients. (A) PBMCs collected from 13 AML patients and 8 healthy donors were cultured with or without 100 ng/mL G-CSF for 2 d and subjected to total RNA extraction and G-CSFRI and G-CSFRIV mRNA quantification. GAPDH levels were used as endogenous control. G-CSFRIV:G-CSFRI ratio was normalized to the respective ratio detected in the cells cultured without G-CSF. Graph displays mean ± SD of G-CSFRIV:G-CSFRI mRNA ratios. (B) PBMCs collected from 10 AML patients and 6 healthy donors were cultured with or without G-CSF for 2 d and subjected to total RNA extraction and miR-155 quantification. U6 levels were used as endogenous control. The level of miR155 was normalized to the respective level detected in the cells cultured without G-CSF. Graph displays RQ values (mean ± SD) of miR-155. Statistically significant differences were calculated using a two-tailed Student t test and are shown with asterisks (*p < 0.05 and **p < 0.01).
Figure 8
Figure 8
Schema of structure and signaling pathway of G-CSFRI and G-CSFRIV. G-CSFRI consists of an extracellular domain, a transmembrane domain and a cytoplasmic domain. The membrane-proximal region of the cytoplasmic domain has been linked to activation of Jak and Stat5. The C-terminal end of G-CSFR cytoplasmic domain contains the dileucine internalization motif and four conserved tyrosine residues. Y704 and Y744 recruit Stat3, and Y729 is a docking site for SOCS3. The dileucine internalization motif and SOCS3 could inhibit Stat5 activation. In the alternatively spliced G-CSFRIV, 87 amino acids at the C-terminal end of the cytoplasmic domain including Y729, Y744, Y764 and dileucine internalization motif are replaced by 34 amino acids of a novel sequence. In response to G-CSF, the G-CSFR forms ho-modimers and leads to rapid Jak phosphorylation and subsequently the activation of Stat3, Stat5 and SOCS3. The Stat proteins then dimerize, translocate to the nucleus and bind to specific DNA recognition sites and modulate the expression of the target genes. G-CSFRIV induces prolonged Stat5 activation, which causes an upregulation of the miR-155 host gene. miR-155 further downregulates the levels of its target genes including PU.1, GFI-1 and TP53INP1, contributing to growth and survival advantage, increased CCL2 secretion as well as defective differentiation of hematopoietic stem and progenitor cells. The Stat5 inhibitor and shmiR-155 may abrogate G-CSFRIV–mediated Stat5/miR-155/miR-155-targets pathway.

Similar articles

Cited by

References

    1. Demetri GD, Griffin JD. Granulocyte colony-stimulating factor and its receptor. Blood. 1991;78:2791–808. - PubMed
    1. Touw IP, van de Geijn GJ. Granulocyte colony-stimulating factor and its receptor in normal myeloid cell development, leukemia and related blood cell disorders. Front Biosci. 2007;12:800–15. - PubMed
    1. Beekman R, Touw IP. G-CSF and its receptor in myeloid malignancy. Blood. 2010;115:5131–6. - PubMed
    1. Yoshikawa A, Murakami H, Nagata S. Distinct signal transduction through the tyrosine-containing domains of the granulocyte colony-stimulating factor receptor. EMBO J. 1995;14:5288–96. - PMC - PubMed
    1. Richards MK, Liu F, Iwasaki H, Akashi K, Link DC. Pivotal role of granulocyte colony-stimulating factor in the development of progenitors in the common myeloid pathway. Blood. 2003;102:3562–8. - PubMed

Publication types

MeSH terms