. 2015 Dec;64(12):1949-60.
doi: 10.1136/gutjnl-2014-308410. Epub 2015 Mar 2.

Progenitor cell expansion and impaired hepatocyte regeneration in explanted livers from alcoholic hepatitis

Affiliations

Progenitor cell expansion and impaired hepatocyte regeneration in explanted livers from alcoholic hepatitis

Laurent Dubuquoy et al. Gut. 2015 Dec.

Abstract

Objective: In alcoholic hepatitis (AH), development of targeted therapies is crucial and requires improved knowledge of cellular and molecular drivers in liver dysfunction. The unique opportunity of using explanted livers from patients with AH having undergone salvage liver transplantation allowed to perform more in-depth molecular translational studies.

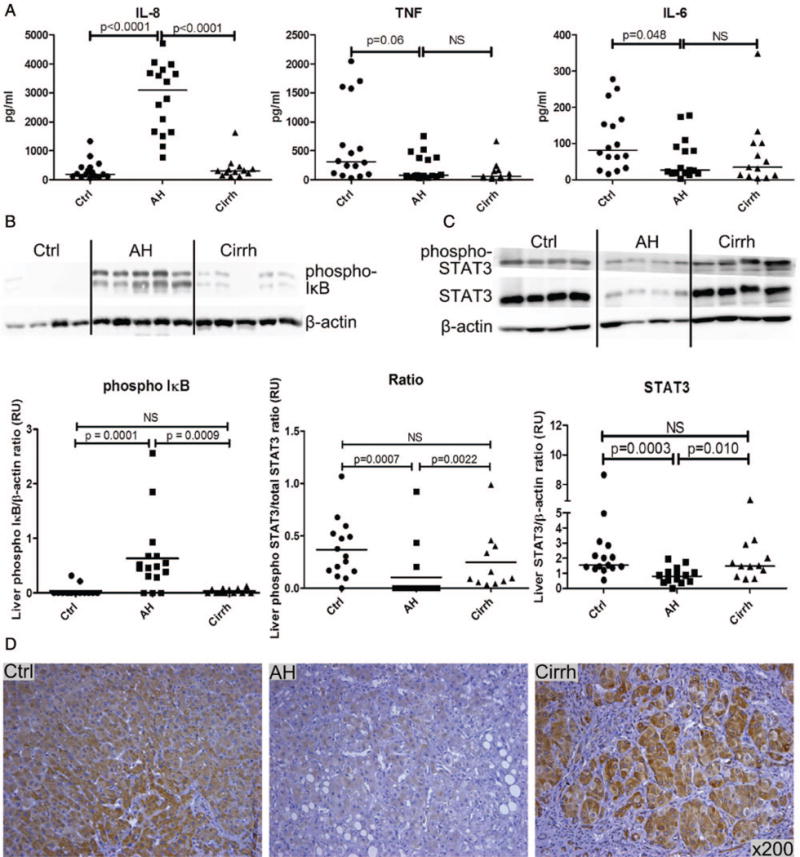
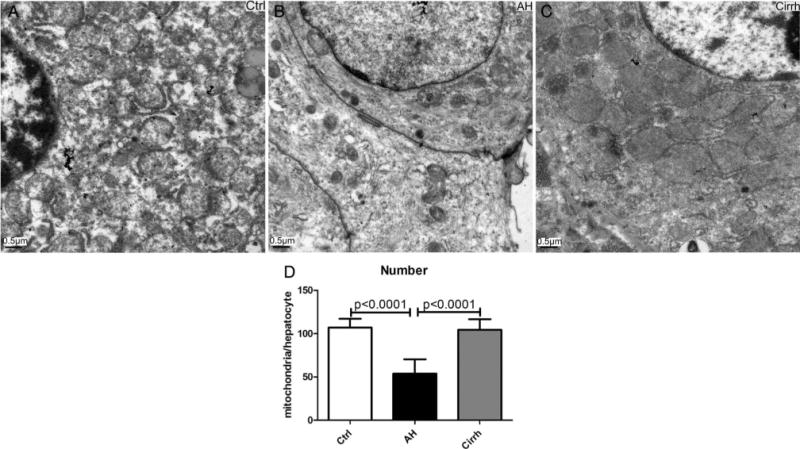
Design: We studied liver explants from patients with AH submitted to salvage transplantation (n=16), from patients with alcoholic cirrhosis without AH (n=12) and fragments of normal livers (n=16). Hepatic cytokine content was quantified. Hepatocyte function and proliferation and the presence of hepatic progenitor cells (HPCs) were evaluated by immunohistochemistry, western blot or quantitative PCR. Mitochondrial morphology was evaluated by electron microscopy.

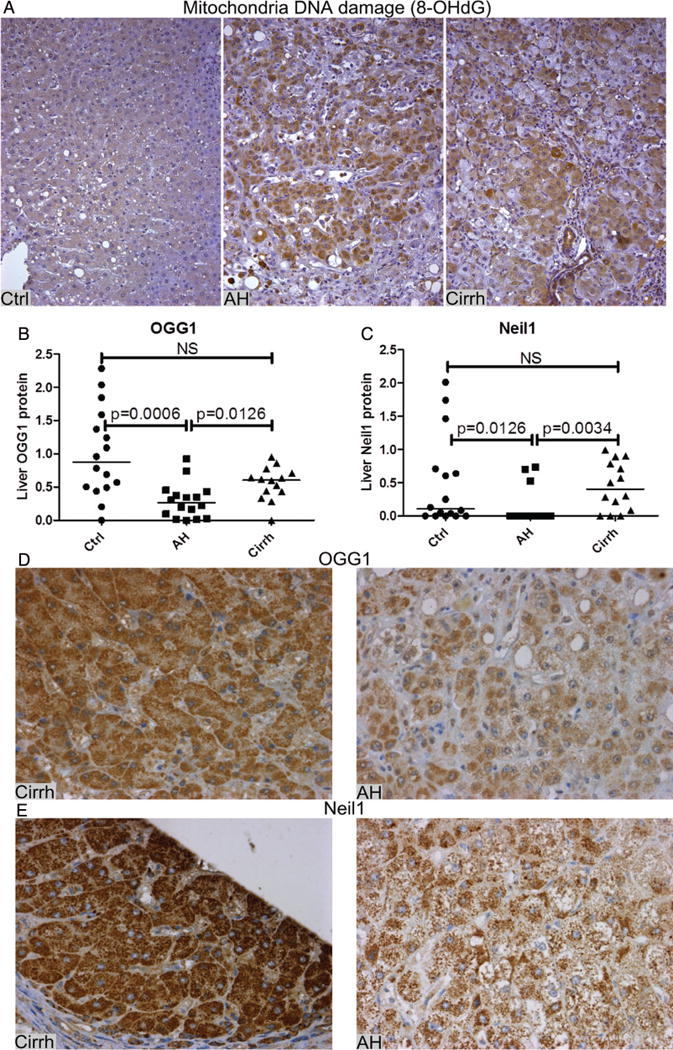
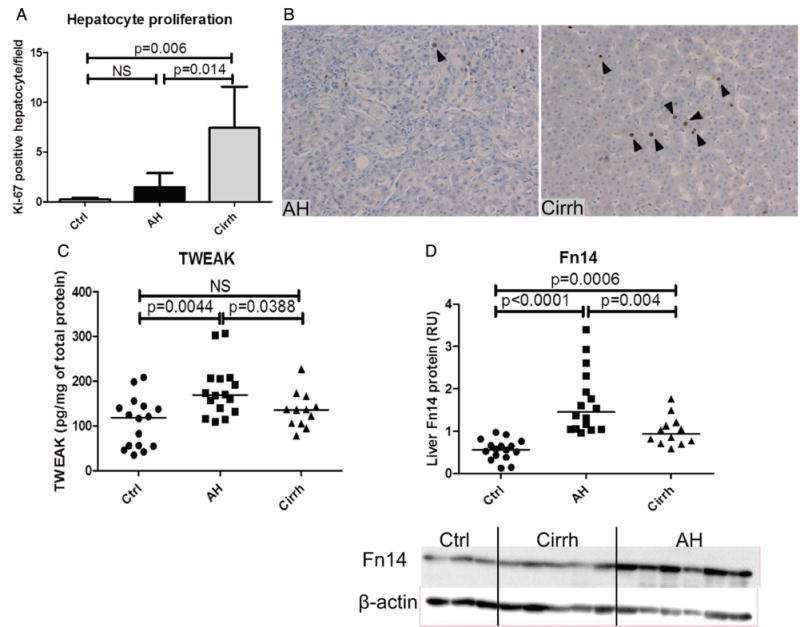
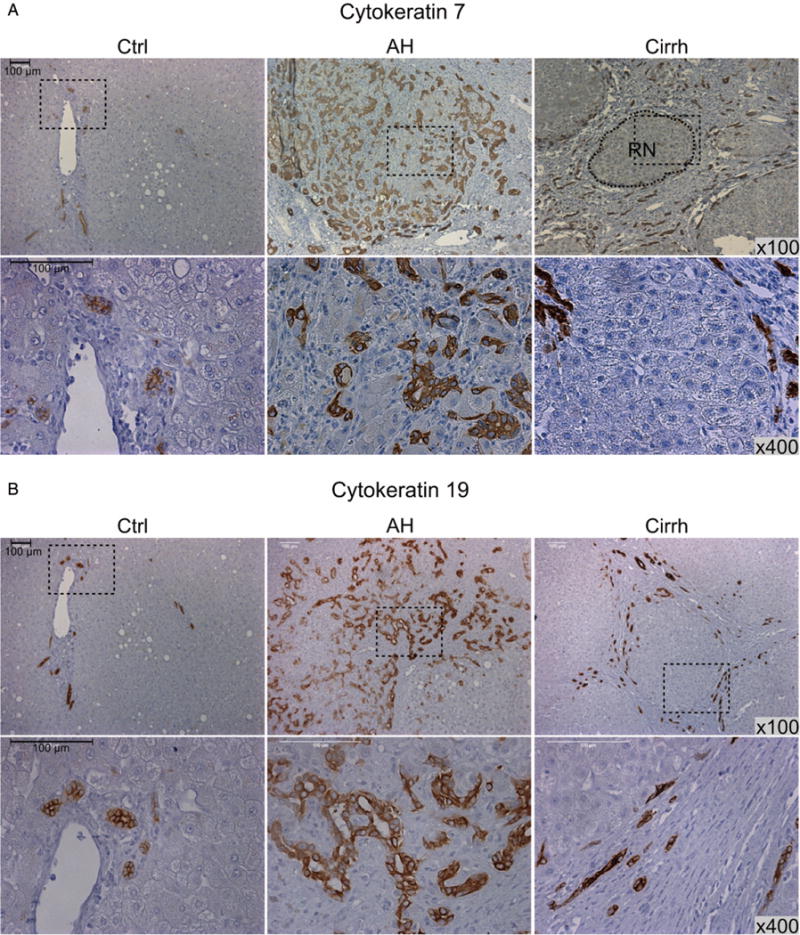
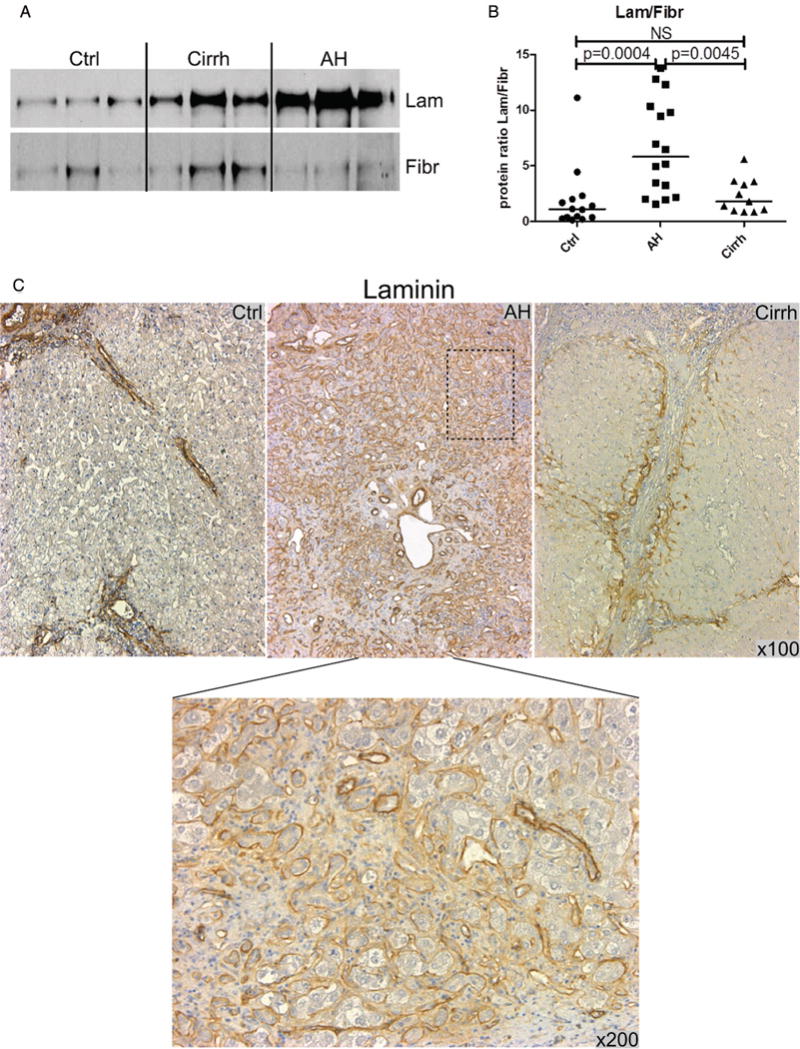
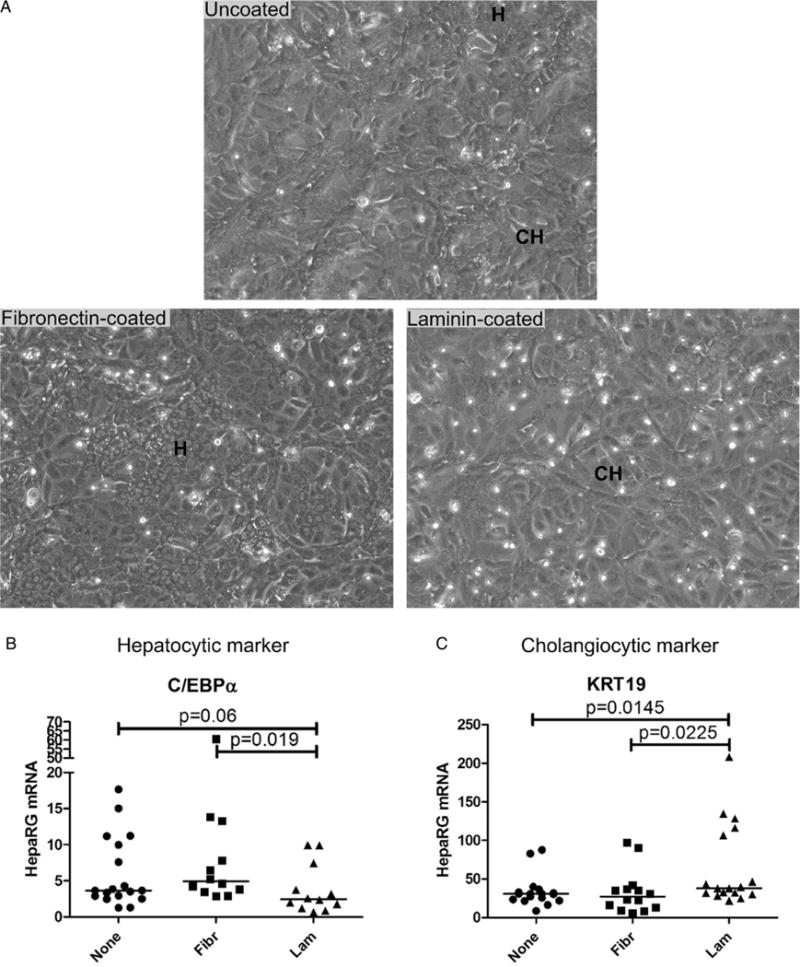
Results: Livers from patients with AH showed decreased cytokine levels involved in liver regeneration (tumour necrosis factor α and interleukin-6), as well as a virtual absence of markers of hepatocyte proliferation compared with alcoholic cirrhosis and normal livers. Electron microscopy revealed obvious mitochondrial abnormalities in AH hepatocytes. Importantly, livers from patients with AH showed substantial accumulation of HPCs that, unexpectedly, differentiate only into biliary cells. AH livers predominantly express laminin (extracellular matrix protein favouring cholangiocyte differentiation); consequently, HPC expansion is inefficient at yielding mature hepatocytes.

Conclusions: AH not responding to medical therapy is associated with lack of expression of cytokines involved in liver regeneration and profound mitochondrial damage along with lack of proliferative hepatocytes. Expansion of HPCs is inefficient to yield mature hepatocytes. Manoeuvres aimed at promoting differentiation of HPCs into mature hepatocytes should be tested in AH.

Keywords: ALCOHOLIC LIVER DISEASE; CYTOKERATINS; EXTRACELLULAR MATRIX; HEPATOCYTE; LIVER REGENERATION.


Conflict of interest statement

Competing interests None.

Figures

Figure 1
Figure 1
Cytokine expression and signalling in liver parenchyma. (A) Protein expression of inflammatory cytokines (interleukin (IL)-8, tumour necrosis factor (TNF) and IL-6) in liver from control (Ctrl), alcoholic hepatitis (AH) and cirrhosis (Cirrh). Results are expressed as the protein level in pg/mL. Each patient is represented, and the median is indicated as a solid line. Statistical significances are indicated. (B) Representative western blots of liver expression levels of phosphorylated IκB (phospho-IκB), and β-actin was used as a loading control. The dot-plot illustrates band intensity quantification for the three groups of patients. Results are expressed as the ratio of phospho-IκB/β-actin in relative units (RUs). Statistical significances are indicated. (C) Representative western blot of liver expression levels of phosphorylated STAT3 (phospho-STAT3), total STAT3 and β-actin used as loading control. The dot-plot illustrates band intensity quantification for the three groups of patients. Results are expressed as the ratio of phosphorylated STAT3/total STAT3 (ratio) and total STAT3/β-actin (STAT3) in RUs. Statistical significances are indicated. (D) Representative immunostaining for total STAT3 in livers from Ctrl, AH and Cirrh. Original magnification is ×200.
Figure 2
Figure 2
Mitochondrial abnormalities in patient hepatocytes. Representative electron microscopy images of hepatocytes (original magnification ×4400). (A) Control (Ctrl) hepatocyte with numerous well-shaped mitochondria. (B) Alcoholic hepatitis (AH) hepatocyte presents sparse cytoplasmic distribution of mitochondria that have a stunted aspect. (C) Hepatocyte from patient with cirrhosis (Cirrh) with numerous mitochondria characterised by slight swelling. (D) Histogram represents the mitochondrial count in five different hepatocytes from four randomly selected patients in controls (Ctrl), AH and Cirrh. Results are expressed as mean±SD of the number of mitochondria per hepatocyte.
Figure 3
Figure 3
Mitochondrial DNA damage and repair enzymes. (A) Representative immunostainings for the 8-hydroxy-2′-deoxyguanosine (8-OHdG) in livers from control (Ctrl), alcoholic hepatitis (AH) and cirrhosis (Cirrh). Magnification is ×200. (B) Dot-plot illustrates band intensity quantification of OGG1 western blot analysis in the three groups of patients. Results are expressed as ratio of OGG1/β-actin in relative units (RUs). Statistical significances are indicated. (C) Dot-plot illustrates band intensity quantification after Neil1 western blot analysis in the three groups of patients. Results are expressed as ratio of Neil1/β-actin in RUs. Statistical significances are indicated. (D) Representative immunostainings for OGG1 in livers from Cirrh and AH. Original magnification is ×400. We mainly observed cytosolic brown staining. (E) Representative immunostainings for Neil1 in livers from Cirrh and AH. Original magnification is ×400. We mainly observed cytosolic brown staining.
Figure 4
Figure 4
Hepatocyte and progenitor proliferation markers. (A) Histogram represents hepatocyte proliferation in livers from control (Ctrl), alcoholic hepatitis (AH) and cirrhosis (Cirrh). Results are expressed as mean±SD of Ki-67-positive hepatocytes per field magnification ×200. Statistical significances are indicated. (B) Representative immunostaining for Ki-67 in liver from AH and Cirrh. Magnification is ×200. (C) Dot-plot shows TWEAK protein expression in livers of patients. Results are expressed as TWEAK protein level in pg/mg of total protein in liver lysate. Each patient is represented and the median is indicated as a solid line. Statistical significances are indicated. (D) Dot-plot illustrates band intensity quantification after Fn14 western blot analysis in livers from the three groups of patients. A western blot representative image is provided. Results are expressed as ratio of Fn14/β-actin in relative units. Statistical significances are indicated.
Figure 5
Figure 5
Cytokeratin 7 and 19 expression profile in liver parenchyma of patients. (A) Representative immunostainings for cytokeratin 7 (KRT7) in livers from control (Ctrl), alcoholic hepatitis (AH) and cirrhosis (Cirrh). Upper panel magnification ×100 and lower panel magnification ×400. Portal bile ducts are stained in Ctrl livers (arrowheads, left panel). In cirrhotic liver, we observe intense staining in the fibrotic string around regenerative nodules (RNs) (right panel). AH liver displays massive staining, which invades the entire parenchyma (middle panel). (B) Representative immunostainings for cytokeratin 19 (KRT19) in livers from Ctrl, AH and Cirrh. Upper panel: original magnification ×100; lower panel: original magnification ×400. The black dotted drawn boxes present in ×100 image represent the areas enlarged in ×400 images.
Figure 6
Figure 6
Laminin (Lam) and fibronectin (Fibr) exhibit different expression profiles in livers of patients. (A) Representative western blot of liver expression levels of Lam and Fibr in control (Ctrl), alcoholic hepatitis (AH) and cirrhosis (Cirrh). (B) Dot-plot shows the Lam/Fibr ratio determined after band intensity quantification of western blot analysis in livers of the three groups of patients. Results are expressed as the ratio of Lam/Fibr in relative units. Statistical significances are indicated. (C) Representative immunostainings for Lam in livers from Ctrl, AH and Cirrh. Original magnification: ×100 and ×200. The black dotted drawn box present in ×100 image represents the area enlarged in ×200 image.
Figure 7
Figure 7
Laminin promotes cholangiocyte phenotype of the bipotent human HepaRG cells. (A) Representative picture of HepaRG cells cultured for 15 days either in uncoated (upper panel), fibronectin-coated (lower left panel) or laminin-coated (lower right panel) 6-well plates. These different coatings influence the proportion of cells with hepatocytic (H) or cholangiocytic (CH) phenotypes. (B and C) Dot-plots show mRNA expression in HepaRG cells cultured for 15 days in uncoated (None), in fibronectin-coated (Fibr) or laminin-coated (Lam) 6-well plates for an early gene of hepatocyte lineage (CCAAT/enhancer binding protein α (C/EBPα)) (B) and a marker of cholangiocyte (cytokeratin 19 (KRT19)) (C). Results are expressed as relative unit. Each experimental well is represented, and the median is indicated as a solid line. Statistical significances are indicated.

Comment in

References

    1. Lucey MR, Mathurin P, Morgan TR. Alcoholic hepatitis. N Engl J Med. 2009;360:2758–69. - PubMed
    1. Altamirano J, Miquel R, Katoonizadeh A, et al. A histologic scoring system for prognosis of patients with alcoholic hepatitis. Gastroenterology. 2014;146:1231–9 e6. - PMC - PubMed
    1. Boetticher NC, Peine CJ, Kwo P, et al. A randomized, double-blinded, placebo-controlled multicenter trial of etanercept in the treatment of alcoholic hepatitis. Gastroenterology. 2008;135:1953–60. - PMC - PubMed
    1. Naveau S, Chollet-Martin S, Dharancy S, et al. A double-blind randomized controlled trial of infliximab associated with prednisolone in acute alcoholic hepatitis. Hepatology. 2004;39:1390–7. - PubMed
    1. Louvet A, Naveau S, Abdelnour M, et al. The Lille model: a new tool for therapeutic strategy in patients with severe alcoholic hepatitis treated with steroids. Hepatology. 2007;45:1348–54. - PubMed

Publication types

MeSH terms