. 2015 Mar 11;17(3):392-403.
doi: 10.1016/j.chom.2015.01.011. Epub 2015 Feb 26.

Structure and function of the bacterial root microbiota in wild and domesticated barley

Affiliations

Structure and function of the bacterial root microbiota in wild and domesticated barley

Davide Bulgarelli et al. Cell Host Microbe. .

Abstract

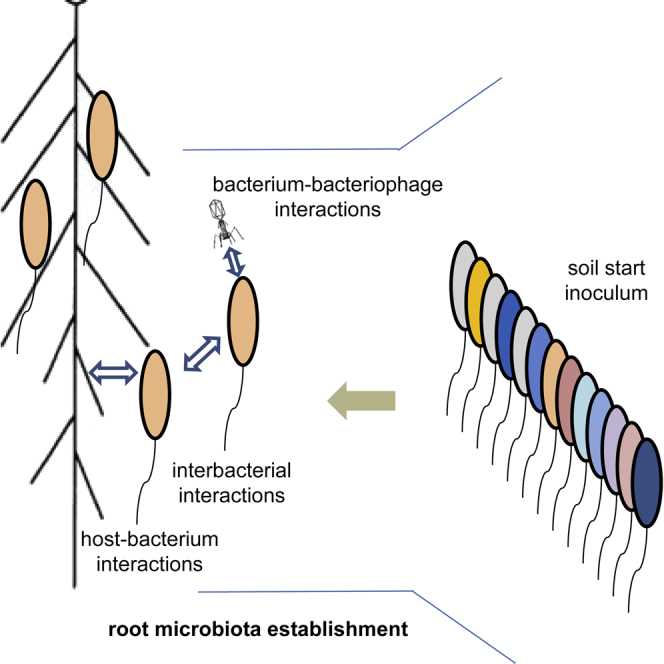
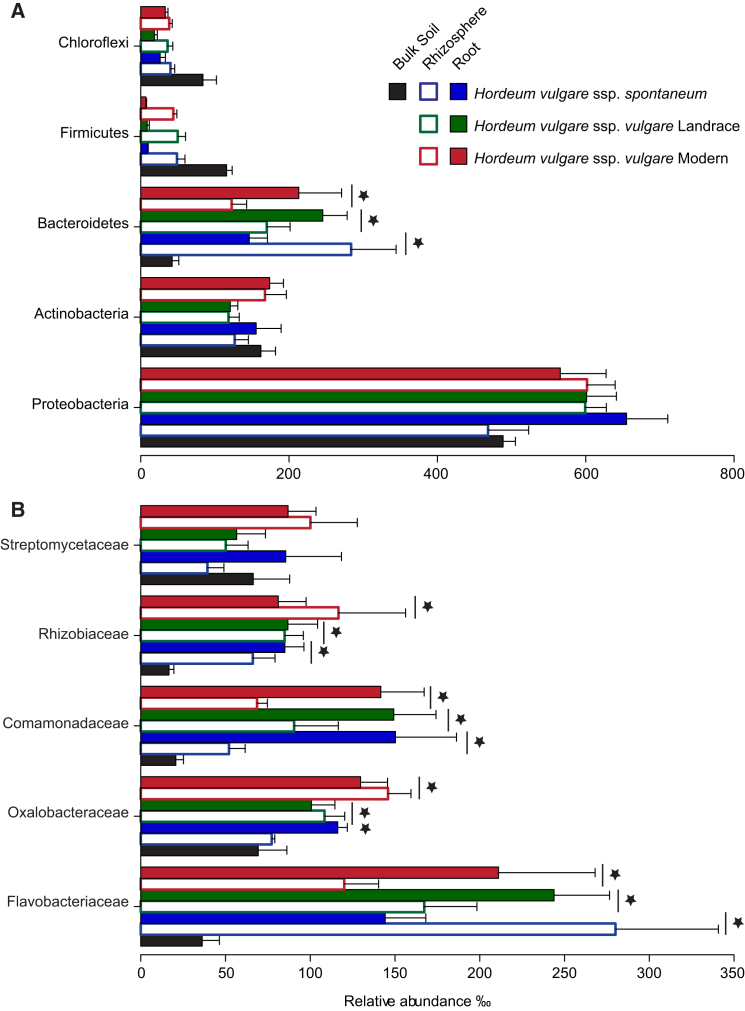
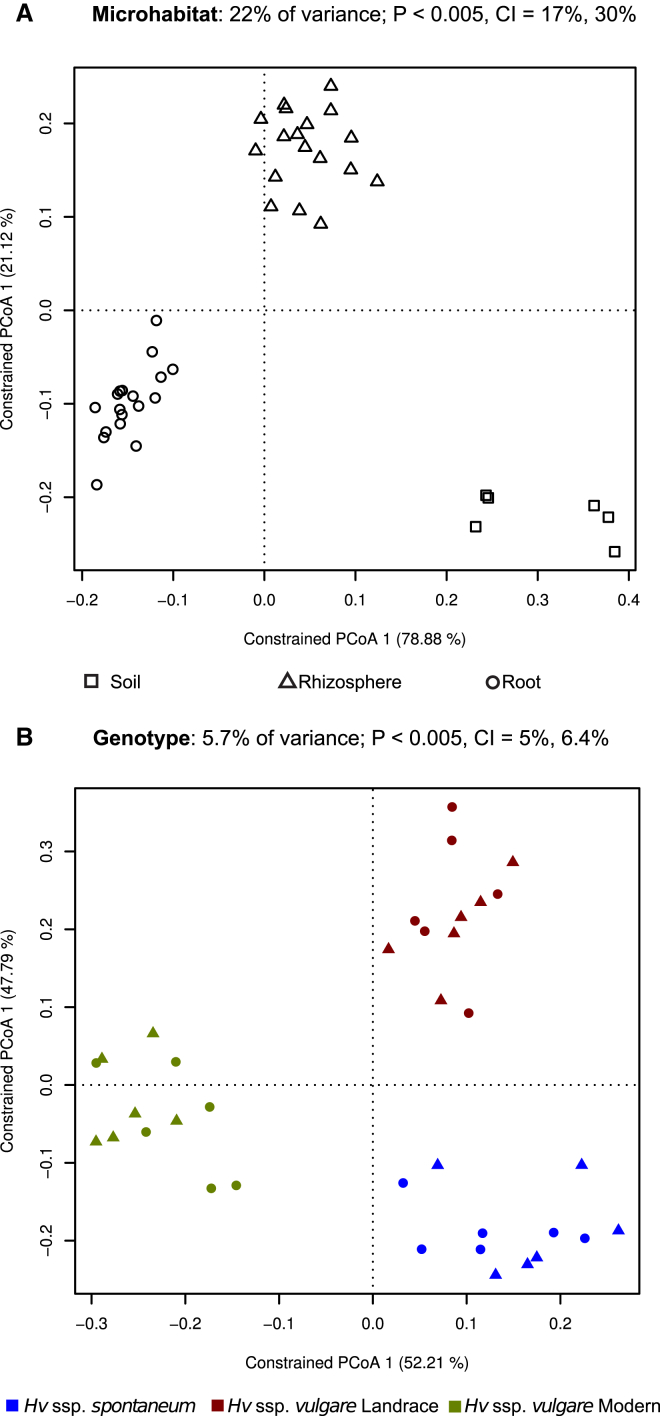
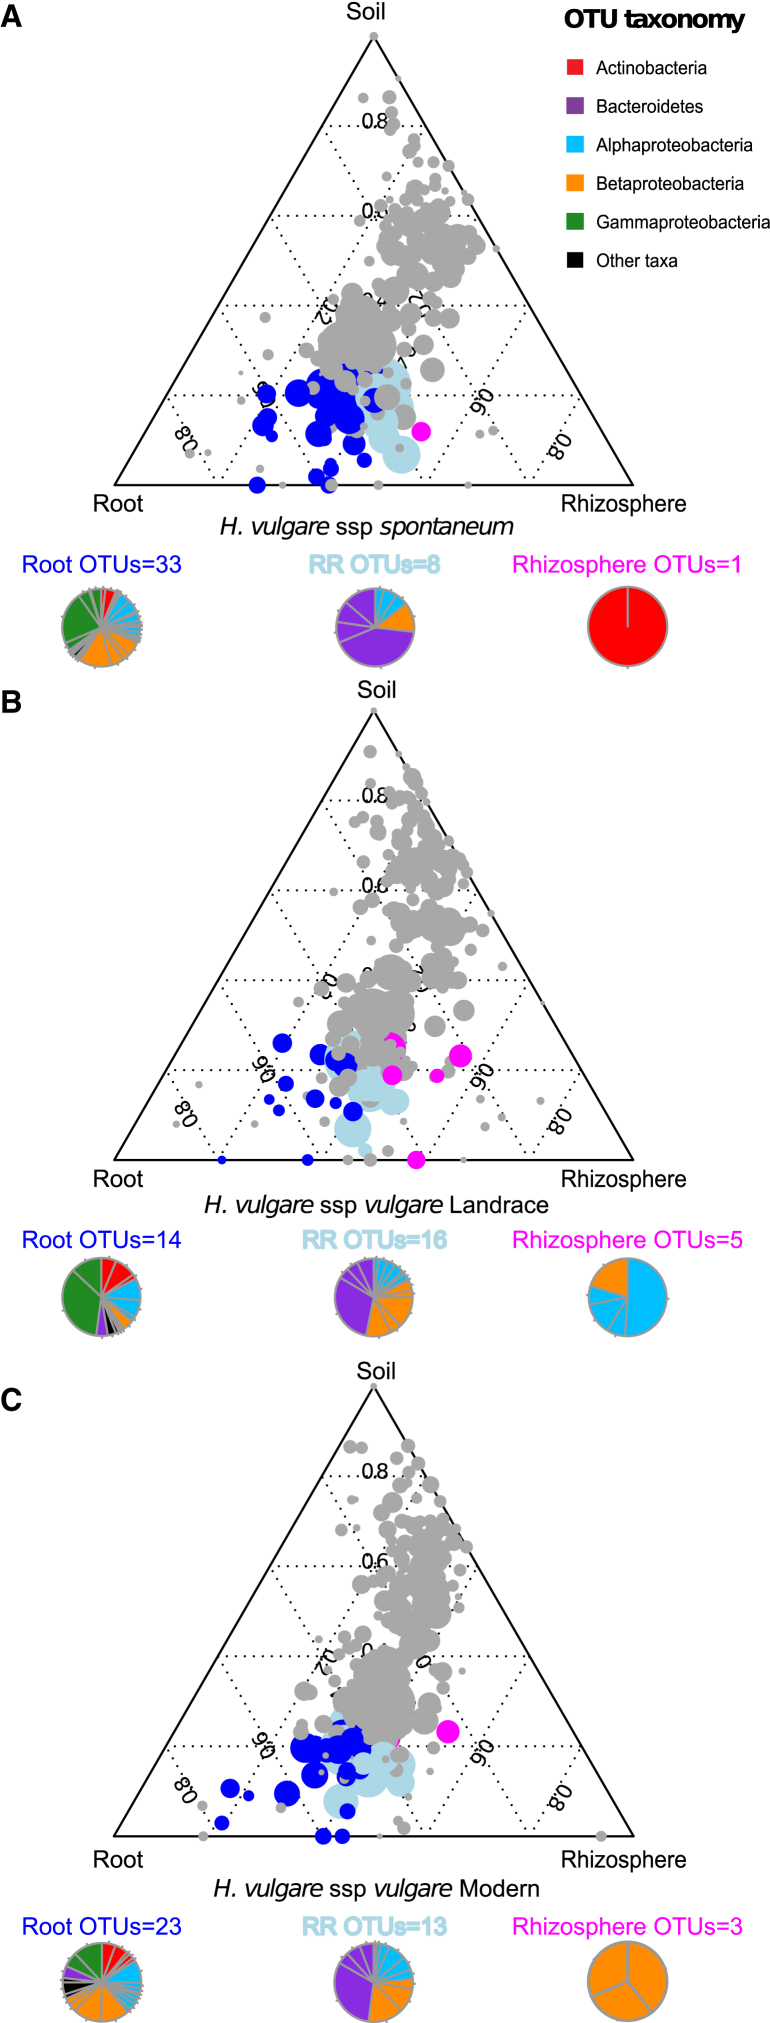
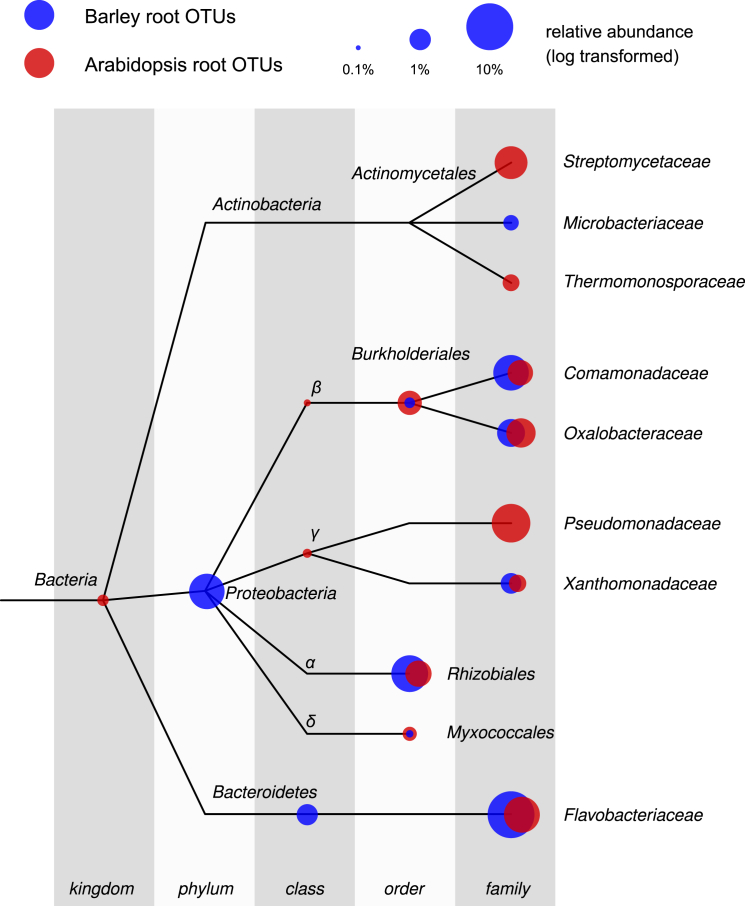
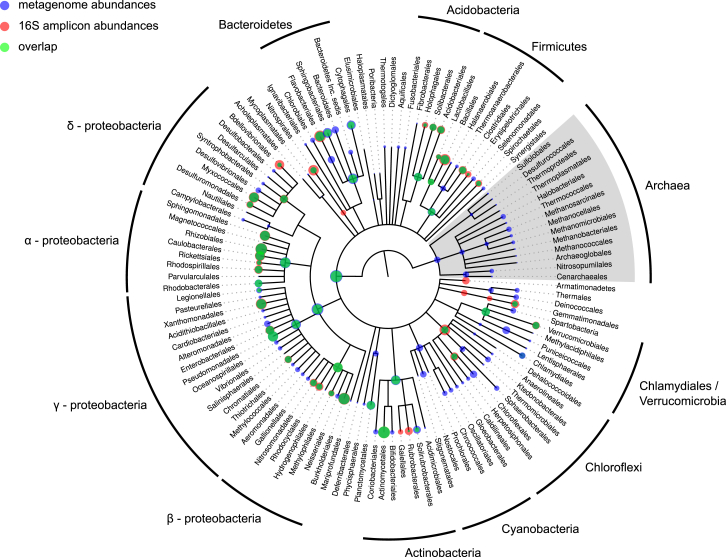
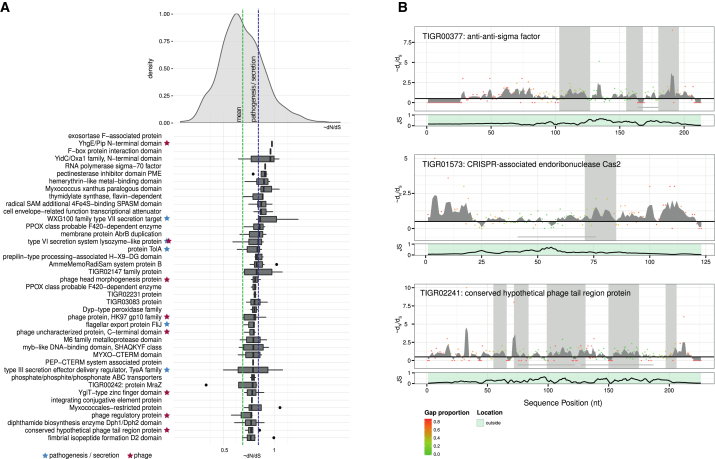
The microbial communities inhabiting the root interior of healthy plants, as well as the rhizosphere, which consists of soil particles firmly attached to roots, engage in symbiotic associations with their host. To investigate the structural and functional diversification among these communities, we employed a combination of 16S rRNA gene profiling and shotgun metagenome analysis of the microbiota associated with wild and domesticated accessions of barley (Hordeum vulgare). Bacterial families Comamonadaceae, Flavobacteriaceae, and Rhizobiaceae dominate the barley root-enriched microbiota. Host genotype has a small, but significant, effect on the diversity of root-associated bacterial communities, possibly representing a footprint of barley domestication. Traits related to pathogenesis, secretion, phage interactions, and nutrient mobilization are enriched in the barley root-associated microbiota. Strikingly, protein families assigned to these same traits showed evidence of positive selection. Our results indicate that the combined action of microbe-microbe and host-microbe interactions drives microbiota differentiation at the root-soil interface.


Figures

None
Graphical abstract
Figure 1
Figure 1
The Barley Rhizosphere and Root Microbiota Are Gated Communities Average relative abundance (RA ± SEM) of the five most abundant (A) phyla and (B) families in soil, rhizosphere, and root samples as revealed by the 16S rRNA gene ribotyping. For each sample type, the number of replicates is n = 6. Stars indicate significant enrichment (FDR, p < 0.05) in the rhizosphere and root samples compared to bulk soil. Vertical lines denote a simultaneous enrichment of the given taxa in all three barley accessions. Only taxa with a RA > 0.5% in at least one sample were included in the analysis.
Figure 2
Figure 2
Constrained Principal Coordinate Analysis on the Soil and Barley Bacterial Microbiota (A) Variation between samples in Bray-Curtis distances constrained by microhabitat (22% of the overall variance; p < 5.00E−2) and (B) by accession (5.7% of the overall variance; p < 5.00E−2). In both panels, triangles correspond to rhizosphere and circles to root samples. The percentage of variation explained by each axis refers to the fraction of the total variance of the data explained by the constrained factor. In (B) soil samples were not included.
Figure 3
Figure 3
OTU Enrichment at the Barley Root/Soil Interface Ternary plots of all OTUs detected in the data set with RA > 0.5% in at least one sample in (A) Hordeum vulgare ssp. spontaneum, (B) H. vulgare ssp. vulgare Landrace, and (C) H. vulgare ssp. vulgare Modern. Each circle represents one OTU. The size of each circle represents its relative abundance (weighted average). The position of each circle is determined by the contribution of the indicated compartments to the total relative abundance. Dark blue circles mark OTUs significantly enriched in the root microhabitat (Root_OTUs, FDR, p < 0.05), magenta circles mark OTUs significantly enriched in the rhizosphere microhabitat (Rhizo_OTUs, FDR, p < 0.05), and cyan circles mark OTUs significantly enriched in both microhabitats (RR OTUs, FDR, p < 0.05).
Figure 4
Figure 4
Taxonomic Representation of the Barley and Arabidopsis Root-Enriched Bacterial Taxa The tree represents a subset of the NCBI taxonomy containing all OTUs found to be enriched in the barley and Arabidopsis root samples with respect to soil. The branches of the tree do not reflect evolutionary distances. The position of the dots corresponds to the taxonomic placement of each OTU-representative sequence in the taxonomy. The size of the dots illustrates the aggregated relative abundance of all OTUs assigned to a given taxon (log scale). OTUs enriched in Arabidopsis roots are depicted in red, whereas Barley root OTUs are shown in blue. Note that the relative abundance of each subset of root-enriched taxa with respect to its respective root community varies (Barley root OTUs, 45.44%; Arabidopsis root enriched OTUs, 59.02%).
Figure 5
Figure 5
Comparison of 16S rRNA Amplicon and Metagenome Abundances The tree represents the NCBI taxonomy for all taxonomically classified OTUs from the rhizosphere samples of the 16S rRNA survey as well as all metagenome bins, resolved down to the order rank. The branches of the tree do not reflect evolutionary distances. The position of the dots in the tree corresponds to the taxonomic placement of the representative sequences in the NCBI taxonomy. The size of the dots illustrates the average relative abundances per sample of each taxa (log scale). Blue dots represent abundances as found in the shotgun metagenome classification, red dots correspond to abundances from the 16S rRNA amplicon data, and green depicts an overlap.
Figure 6
Figure 6
Proteins under Selection in the Barley Rhizosphere Microbiome (A) Top-ranking protein families under positive selection with significantly increased Dn/Ds statistic. The distribution at the top shows the density function over all protein families smoothed with a Gaussian kernel function. The green bar indicates the average ∼Dn/Ds over all the samples, the blue bar the average ∼Dn/Ds for all TIGFRAMS annotated with the term “patho” and/or “secretion.” The boxplot shows the distribution of the ∼Dn/Ds across all samples for the top 50 ranked TIGRFAM families under positive selection, with families sorted by their median ∼Dn/Ds in descending order. TIGRFAMs annotated with “repeat” or with a mean repetitive value of more than 50% were discarded. (B) Sequence clusters of residues under positive selection in selected protein families. Top: dots indicate ∼Dn/Ds for a given position in the protein sequence, and their color corresponds to the proportion of gaps in the multiple sequence alignment (MSA). Gray-shaded areas indicate significant clusters of residues under positive selection. Gray-shaded horizontal lines indicate repetitive elements. Bottom: Jensen-Shannon divergence as a function of the positions in the MSA.

References

    1. Abbo S., Pinhasi van-Oss R., Gopher A., Saranga Y., Ofner I., Peleg Z. Plant domestication versus crop evolution: a conceptual framework for cereals and grain legumes. Trends Plant Sci. 2014;19:351–360. - PubMed
    1. Amaral-Zettler L.A., McCliment E.A., Ducklow H.W., Huse S.M. A method for studying protistan diversity using massively parallel sequencing of V9 hypervariable regions of small-subunit ribosomal RNA genes. PLoS ONE. 2009;4:e6372. - PMC - PubMed
    1. Anderson M.J., Willis T.J. Canonical analysis of principal coordinates: a useful method of constrained ordination for ecology. Ecology. 2003;84:511–525.
    1. Barrangou R., Fremaux C., Deveau H., Richards M., Boyaval P., Moineau S., Romero D.A., Horvath P. CRISPR provides acquired resistance against viruses in prokaryotes. Science. 2007;315:1709–1712. - PubMed
    1. Boller T., Felix G. A renaissance of elicitors: perception of microbe-associated molecular patterns and danger signals by pattern-recognition receptors. Annu. Rev. Plant Biol. 2009;60:379–406. - PubMed

Publication types

Associated data