. 2015 Mar 9;212(3):369-83.
doi: 10.1084/jem.20140474. Epub 2015 Mar 2.

Epithelial NAIPs protect against colonic tumorigenesis

Affiliations

Epithelial NAIPs protect against colonic tumorigenesis

Ramanjaneyulu Allam et al. J Exp Med. .

Abstract

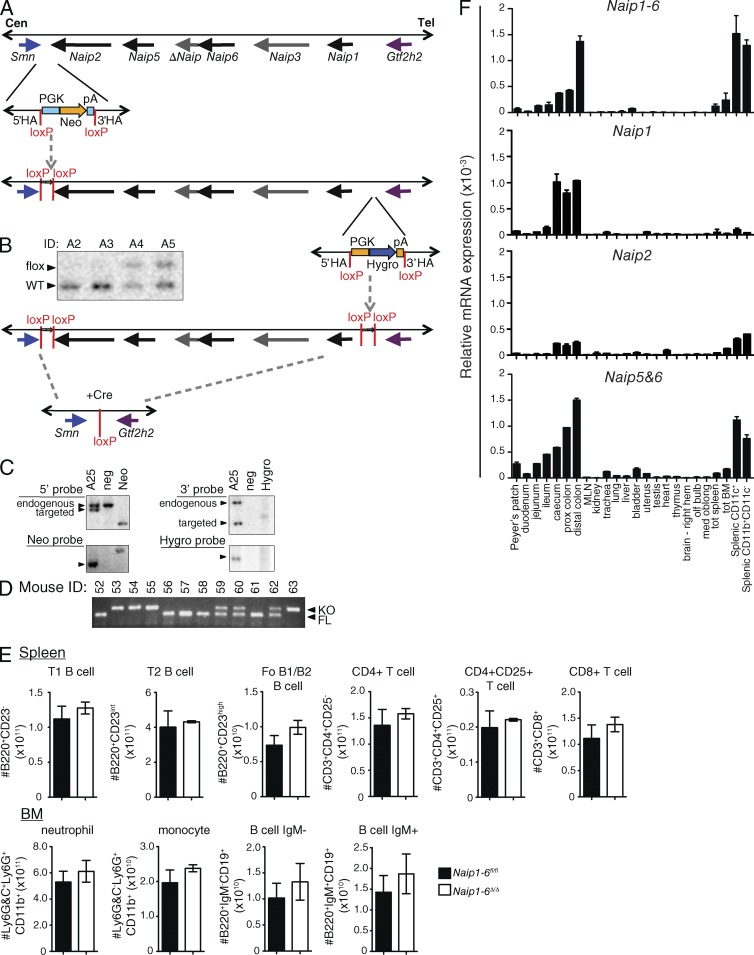
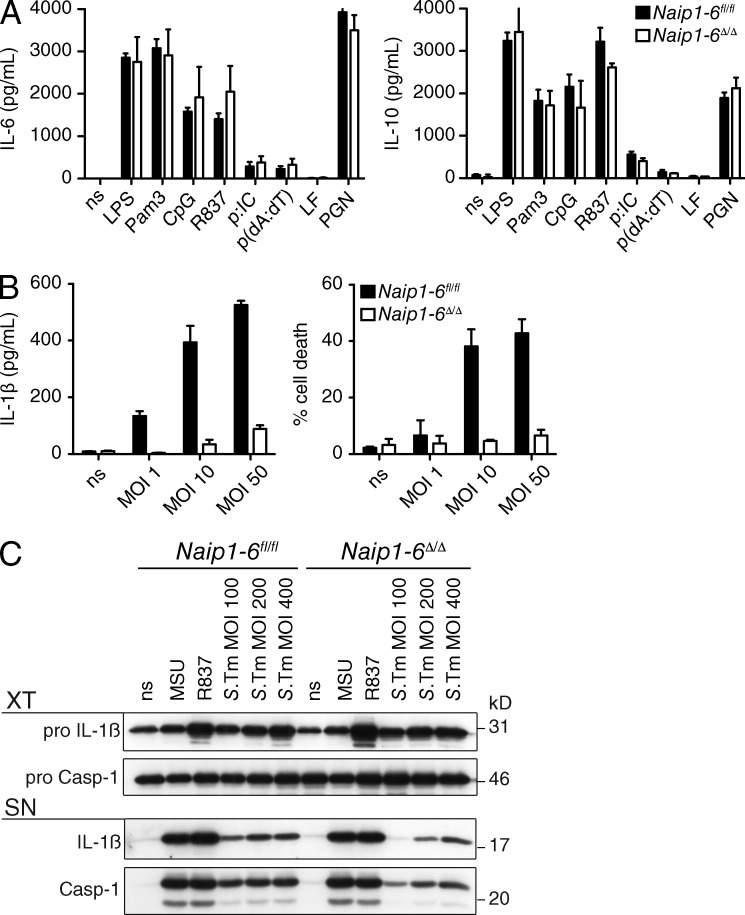
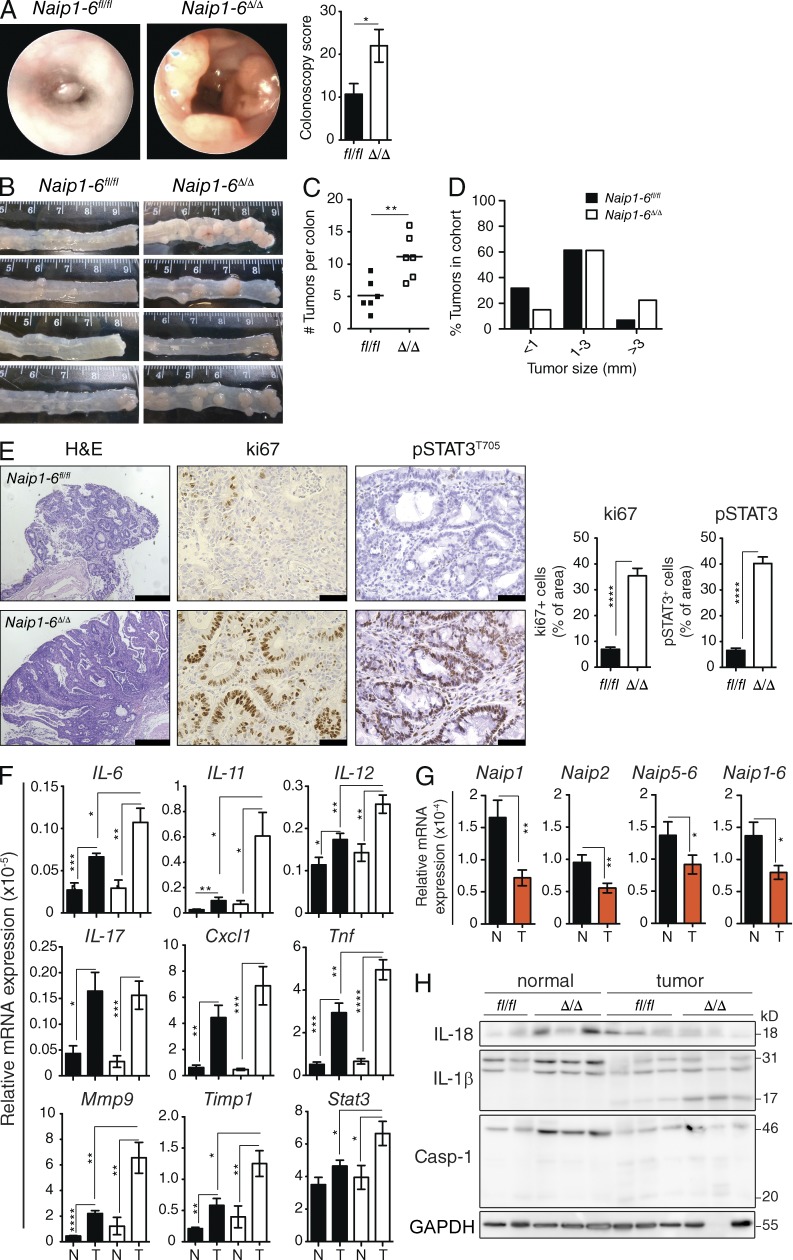
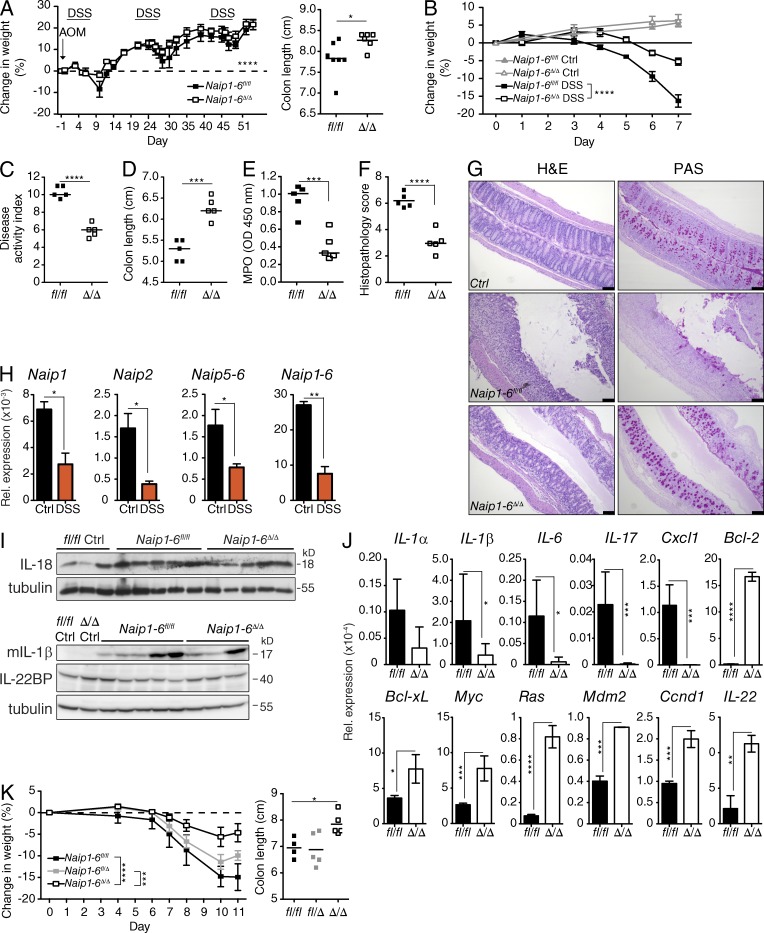
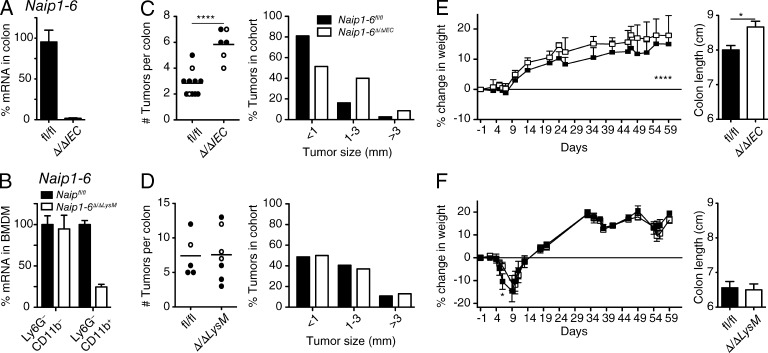
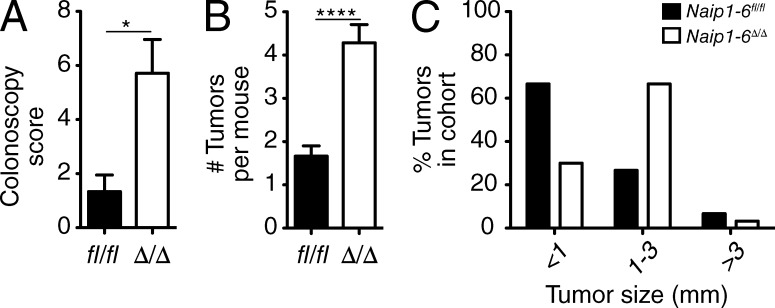
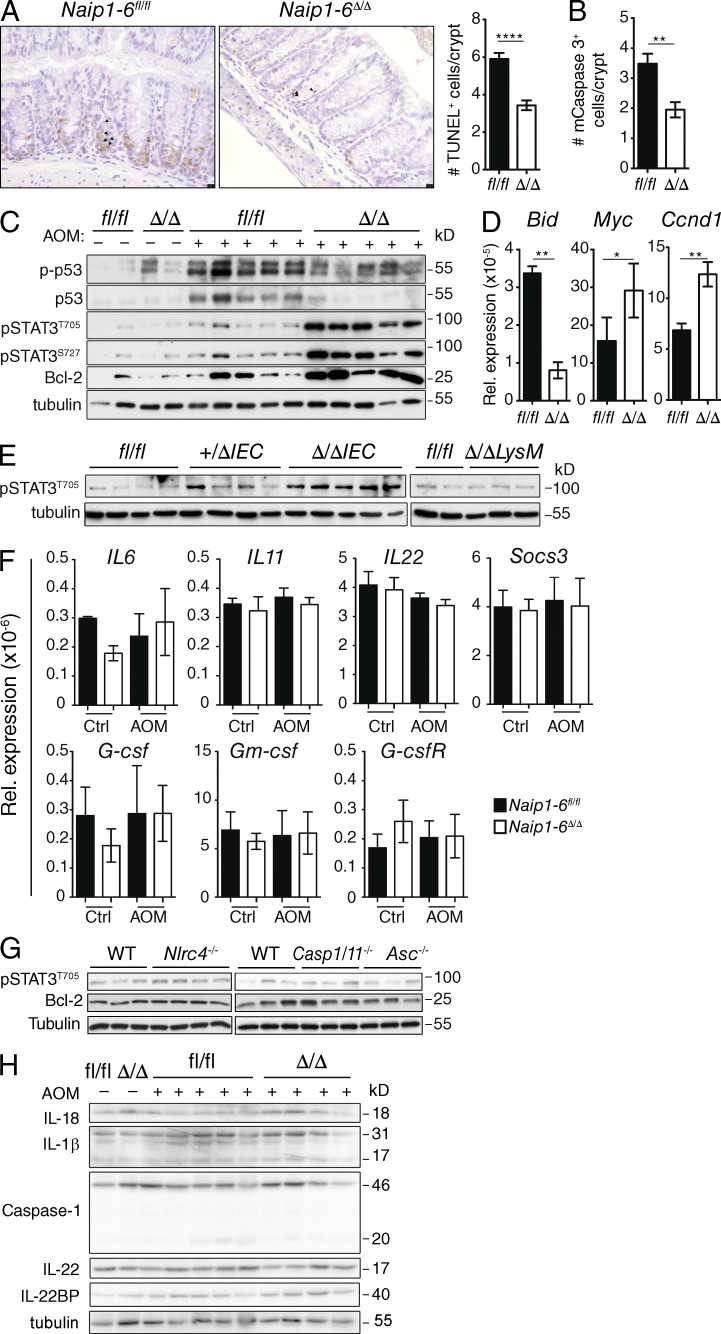
NLR family apoptosis inhibitory proteins (NAIPs) belong to both the Nod-like receptor (NLR) and the inhibitor of apoptosis (IAP) families. NAIPs are known to form an inflammasome with NLRC4, but other in vivo functions remain unexplored. Using mice deficient for all NAIP paralogs (Naip1-6(Δ/Δ)), we show that NAIPs are key regulators of colorectal tumorigenesis. Naip1-6(Δ/Δ) mice developed increased colorectal tumors, in an epithelial-intrinsic manner, in a model of colitis-associated cancer. Increased tumorigenesis, however, was not driven by an exacerbated inflammatory response. Instead, Naip1-6(Δ/Δ) mice were protected from severe colitis and displayed increased antiapoptotic and proliferation-related gene expression. Naip1-6(Δ/Δ) mice also displayed increased tumorigenesis in an inflammation-independent model of colorectal cancer. Moreover, Naip1-6(Δ/Δ) mice, but not Nlrc4-null mice, displayed hyper-activation of STAT3 and failed to activate p53 18 h after carcinogen exposure. This suggests that NAIPs protect against tumor initiation in the colon by promoting the removal of carcinogen-elicited epithelium, likely in a NLRC4 inflammasome-independent manner. Collectively, we demonstrate a novel epithelial-intrinsic function of NAIPs in protecting the colonic epithelium against tumorigenesis.


Figures

Figure 1.
Figure 1.
Generation of Naip1-6 knockout mice and Naip tissue expression. Naip1-6 knockout mice were generated at Ozgene Pty. Ltd. using C57BL/6 material (DNA, blastocysts and ES cells). (A) Schematic of the targeting strategy (Naip locus schematic adapted from; Endrizzi et al., 2000). First, the region between the Smn and Naip2 genes was targeted with a vector containing neomycin selection flanked by loxP sites (HA, homology arms). Targeted ES cells were selected using neomycin (Neo) and germline transmission of the mutation was achieved. (B) Southern blot demonstrating the presence of WT or floxed allele (A2 to A5 represent different mice). ES cells were then isolated from the resulting heterozygous mice and used for the second targeting of the 3′ end of the Naip locus, between Naip1 and Gtf2h2. Successfully double-targeted ES cells were used to generate the double-floxed Naip mice (Naip1-6fl/fl). (C) Southern blot confirmation of double-targeted Naip allele (A25, mouse sample ID A25; neg, negative control; Neo, neomycin control; Hygro, hygromycin control). Naip1-6fl/fl mice were crossed with general deleter CMV-Cre recombinase mice to generate the full knockout mice (Naip1-6Δ/Δ). (D) PCR detection of floxed or KO alleles. (E) Spleen from Naip1-6fl/fl and Naip1-6Δ/Δ mice were stained for B220, CD23, CD3, CD4, CD8 and CD25 and analyzed by flow cytometry. BM cells were stained for Ly6G&C, Ly6G, CD11b, B220, CD19, and IgM and analyzed by flow cytometry. Specific cell populations are indicated above each graph. n = 3 mice per group. Data are representative of two experiments. (F) Tissues were dissected from C57BL/6 mice, immune cell subsets were FACS-sorted from spleens, RNA was isolated from these samples, and qPCR analysis for Naips was performed using pan Naip1-6, as well as Naip1, Naip2, and Naip5-6–specific primers. Data were normalized to 18S rRNA expression. Data are representative of tissues isolated from three individual mice at independent time points. Spleen subsets were obtained from pooled samples and are representative of two independent experiments.
Figure 2.
Figure 2.
TLR and inflammasome activation in Naip1-6Δ/Δ BMDMs. (A) Naip1-6fl/fl and Naip1-6Δ/Δ BMDMs were stimulated with a range of TLR ligands for 6 h. Supernatants were analyzed by ELISA for IL-6 and IL-10 production. Data are representative of two experiments. (B) BMDMs from Naip1-6fl/fl and Naip1-6Δ/Δ mice were prestimulated with LPS (20 ng/ml), and then infected with Salmonella (S.Tm; SB300 WT) at the indicated multiplicity of infection (MOI). Cell supernatants were collected after 2 h for analysis. IL-1β production was measured by ELISA. Cell death was measured by lactate dehydrogenase (LDH) release and results were normalized to a positive control for cell death. Data are representative of greater than three experiments. (C) Naip1-6fl/fl and Naip1-6Δ/Δ BMDMs were primed with LPS and stimulated with inflammasome activators; MSU (300 µg/ml), R837 (20 µg/ml), and S.Tm at the indicated MOI. Expression of pro-IL-1β, IL-1β, pro-caspase-1, and caspase-1 was assessed by Western blot. (top) Cell extract (XT); (bottom) cell supernatant (SN). Data are representative of three independent experiments, conducted on BMDM obtained from one or two mice for each experiment.
Figure 3.
Figure 3.
Increased colon tumorigenesis in Naip1-6Δ/Δ mice AOM/DSS CAC model. Naip1-6fl/fl and Naip1-6Δ/Δ (nonlittermates) mice were injected i.p. with AOM (10 mg/kg) on day −1 and on day 0 mice were treated DSS (2.5% wt/vol) in the drinking water for 7 d, followed by 14 d of normal drinking water. DSS treatment was repeated twice. Mice were sacrificed after last DSS exposure on day 56. (A) Representative endoscopic view at day 55 and colonoscopy score. (B) Macroscopic appearance of colons at autopsy (day 56) shows tumor development in distal colon, (C) tumor burden, and (D) tumor size, expressed as percent of tumors in the entire cohort observed in the indicated size range. (E) Immunohistology staining for H&E showing representative tumor sections (bars, 500 µm) and ki67 and pSTAT3T705 (showing tumors of relatively similar development to enable comparison of proliferation; bars, 50 µm). Bar graphs on the right show quantification of ki67 and pSTAT3 expression. All tumors imaged were in the distal 1–2 cm of colon. (F) Relative expression levels of indicated mRNAs isolated from tumors T or the adjacent normal tissue N (normalized to 18S rRNA). (G) Same as F for the indicated Naips in Naip1-6fl/fl mice. (H) Western blot analysis for IL-18, Caspase-1, and IL-1β in normal and tumor tissue. Data are representative of two independent experiments with six to eight male mice per group. Data are shown as mean ± SEM. *, P < 0.05; **, P ≤ 0.01; ***, P ≤ 0.001; ****, P < 0.0001.
Figure 4.
Figure 4.
Decreased colitis severity in Naip1-6Δ/Δ mice. (A) Change in body weight was assessed at the indicated time points and the length of colons at autopsy of mice undergoing the AOM/DSS CAC model (as per Fig. 3). (B–I) Mice were treated with DSS (2.5% wt/vol) in the drinking water for 7 d, and were sacrificed and tissues analyzed on day 7. n = 5 for each group. (B) The percent change in weight of Naip1-6fl/fl and Naip1-6Δ/Δ mice at the indicated time points; n = 5 mice per group (n = 3 for untreated controls [Ctrl]). (C) Disease activity index on day 6 of the treatment. (D) Colon length. (E) Myeloperoxidase measurements of colon homogenates, expressed as optical density at 450 nm. (F) Histopathology scores performed blinded on H&E-stained colon sections. (G) Representative sections of colons stained with H&E and periodic acid-Schiff stain (PAS). Bars, 100 µm. (H) Expression of Naips mRNA in colon homogenate of control and DSS-treated Naip1-6fl/fl mice at day 7 were measured by qPCR (normalized to GAPDH). (I) Western blot analysis of IL-18, IL-1β, and IL-22BP in colon homogenates from DSS-treated mice on day 7 (genotypes indicated, samples pooled for IL-1β and IL-22BP). (J) Male mice were injected i.p. with AOM (10 mg/kg) and the following day given DSS (2.5% wt/vol) in the drinking water for 7 d, followed by 2 d normal water. Relative expression levels of indicated mRNAs isolated from colons (normalized to 18S rRNA). n = 5 for Naip1-6fl/fl and n = 3 for Naip1-6Δ/Δ mice (data are shown as mean ± SEM). Data are representative of two independent experiments. (K) Weight loss and colon lengths of Naip1-6fl/fl (n = 4), fl/Δ (n = 5), and Δ/Δ (n = 5) littermates undergoing acute DSS (2.5% wt/vol) induced colitis (7 d of DSS followed by normal water until day 11). Data representative of three independent experiments in B–F and of 2 independent experiments in G–K. Data shown were acquired with male mice. Two-way ANOVA was used for weight loss statistics and two-way Student’s t test for was used for other statistics. Data are shown as mean ± SEM. *, P < 0.05; **, P ≤ 0.01; ***, P < 0.001; ****, P ≤ 0.0001.
Figure 5.
Figure 5.
Increased tumorigenesis in the absence of Naips is epithelium-intrinsic. Epithelial-specific (Naip1-6Δ/ΔIEC), or myeloid-specific (Naip1-6Δ/ΔLysM) Naip knockouts were exposed to the AOM/DSS CAC model as described in Fig. 3, except where indicated. Mice were sacrificed on day 62. Littermates of both sexes were used (filled circles, males; open circles, females). (A) Naip1-6 mRNA in colon of Naip1-6fl/fl and Naip1-6Δ/ΔIEC mice (relative to 18S RNA and expressed as percentage of transcript in Naip1-6fl/fl). (B) Naip1-6 mRNA in Ly6GCD11b+ (macrophage) and Ly6GCD11b (nonmyeloid) BM populations derived from Naip1-6fl/fl and Naip1-6Δ/ΔLysM mice (relative to 18S RNA and expressed as percentage of transcript in Naip1-6fl/fl). (C) Tumor burden and tumor size in Naip1-6fl/fl (n = 11) and Naip1-6Δ/ΔIEC (n = 6) littermates. Data were pooled from two independent experiments (in C, mice were treated with DSS [2.5%] for 5 d and normal water for 16 d for 3 cycles). (D) Tumor burden and tumor size in Naip1-6fl/fl (n = 5) and Naip1-6Δ/ΔLysM (n = 7) littermates, representative of two independent experiments. (E and F) Weight loss and colon length of mice treated as in C and D, respectively. Data are shown as mean ± SEM. *, P < 0.05; ****, P ≤ 0.0001.
Figure 6.
Figure 6.
Increased tumorigenesis in Naip1-6Δ/Δ mice in AOM-induced CRC. Naip1-6fl/fl (n = 9) and Naip1-6Δ/Δ (n = 7) mice were injected with AOM (10 mg/kg) once per week for 6 wk and were analyzed at week 24. (A) Colonoscopy score assessed at week 24, (B) tumor burden (data are shown as mean ± SEM), and (C) tumor size assessed at 25 wk, expressed as percentage of tumors in the indicated size range, calculated on the entire cohort. In all panels, data are representative of two independent experiments. Data from male mice are shown (similar results were obtained in female mice). *, P < 0.05; ****, P < 0.0001.
Figure 7.
Figure 7.
The early response to AOM is altered in Naip1-6Δ/Δ mice. Naip1-6fl/fl and Naip1-6Δ/Δ mice were injected with AOM (10 mg/kg) and colons were analyzed 18 h later. (A) Representative sections of TUNEL staining on colon sections and quantification. 10 crypts in 5 independent fields of view per mouse were counted. Data are expressed as number of TUNEL+ cells per crypt. (B) Quantification of active caspase-3+ cells in colon sections, performed as in A. (C) Western blot analysis of the indicated proteins in lysates prepared from whole-colon homogenates. (D) Relative expression of indicated mRNA from whole colon homogenates (normalized to 18S rRNA). Five mice per group, representative of three independent experiments (A–D and F). Data shown as mean ± SEM. (E) Levels of pSTAT3 in colon homogenates of Naip1-6Δ/ΔIEC, Naip1-6Δ/ΔLysM, or Naip1-6fl/fl littermates after 18 h AOM exposure. Representative of two independent experiments. (F) Relative expression of indicated STAT-3–inducing mRNA targets from Naip1-6fl/fl and Naip1-6Δ/Δ whole colon samples as described for D. Data shown as mean ± SEM. (G) Nlrc4−/−, Caspase-1/11−/−, and Asc−/− mice were injected with AOM (10 mg/kg) and colons were analyzed 18 h later. Expression of pSTAT3 and Bcl-2 in colon homogenates was determined by Western blot (representative of two independent experiments). (H) Western blot analysis of Caspase-1, IL-18, IL-1β, IL-22, and IL-22BP in whole-colon homogenates from AOM and control-treated Naip1-6fl/fl and Naip1-6Δ/Δ mice (representative of two independent experiments). *, P < 0.05; **, P ≤ 0.01; ****, P < 0.0001.

References

    1. Allen I.C., TeKippe E.M., Woodford R.M., Uronis J.M., Holl E.K., Rogers A.B., Herfarth H.H., Jobin C., and Ting J.P.. 2010. The NLRP3 inflammasome functions as a negative regulator of tumorigenesis during colitis-associated cancer. J. Exp. Med. 207:1045–1056 10.1084/jem.20100050 - DOI - PMC - PubMed
    1. Ayres J.S., Trinidad N.J., and Vance R.E.. 2012. Lethal inflammasome activation by a multidrug-resistant pathobiont upon antibiotic disruption of the microbiota. Nat. Med. 18:799–806 10.1038/nm.2729 - DOI - PMC - PubMed
    1. Becker C., Fantini M.C., Wirtz S., Nikolaev A., Kiesslich R., Lehr H.A., Galle P.R., and Neurath M.F.. 2005. In vivo imaging of colitis and colon cancer development in mice using high resolution chromoendoscopy. Gut. 54:950–954 10.1136/gut.2004.061283 - DOI - PMC - PubMed
    1. Bollrath J., Phesse T.J., von Burstin V.A., Putoczki T., Bennecke M., Bateman T., Nebelsiek T., Lundgren-May T., Canli O., Schwitalla S., et al. . 2009. gp130-mediated Stat3 activation in enterocytes regulates cell survival and cell-cycle progression during colitis-associated tumorigenesis. Cancer Cell. 15:91–102 10.1016/j.ccr.2009.01.002 - DOI - PubMed
    1. Broz P., Newton K., Lamkanfi M., Mariathasan S., Dixit V.M., and Monack D.M.. 2010. Redundant roles for inflammasome receptors NLRP3 and NLRC4 in host defense against Salmonella. J. Exp. Med. 207:1745–1755 10.1084/jem.20100257 - DOI - PMC - PubMed

Publication types

MeSH terms