. 2015 May:29:26-35.
doi: 10.1016/j.ymben.2015.02.006. Epub 2015 Feb 27.

Futile cycling increases sensitivity toward oxidative stress in Escherichia coli

Affiliations

Futile cycling increases sensitivity toward oxidative stress in Escherichia coli

Kristin J Adolfsen et al. Metab Eng. 2015 May.

Abstract

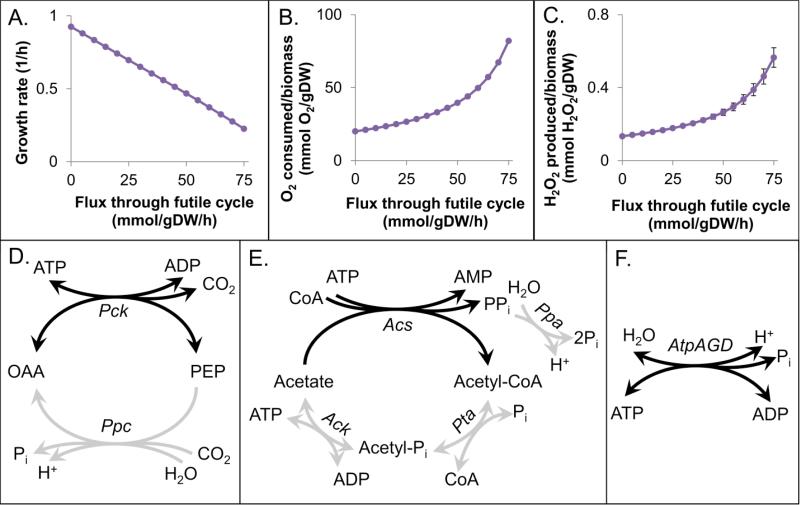
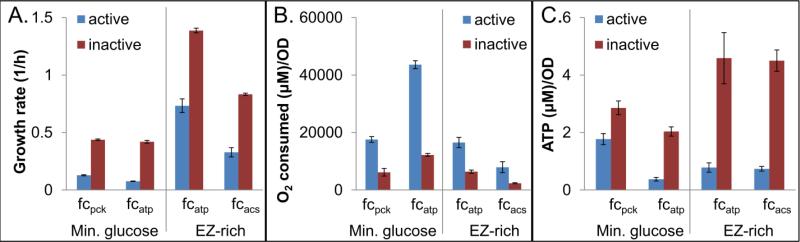
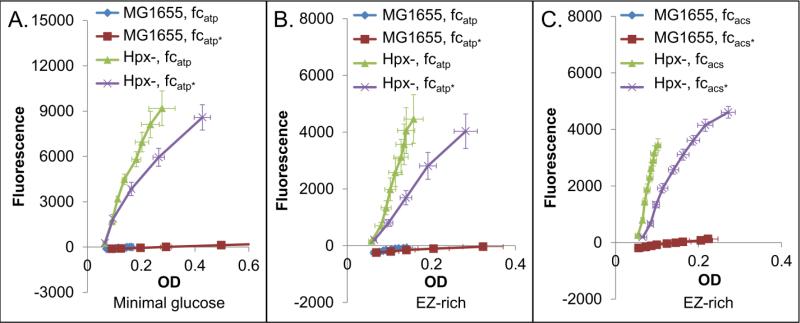
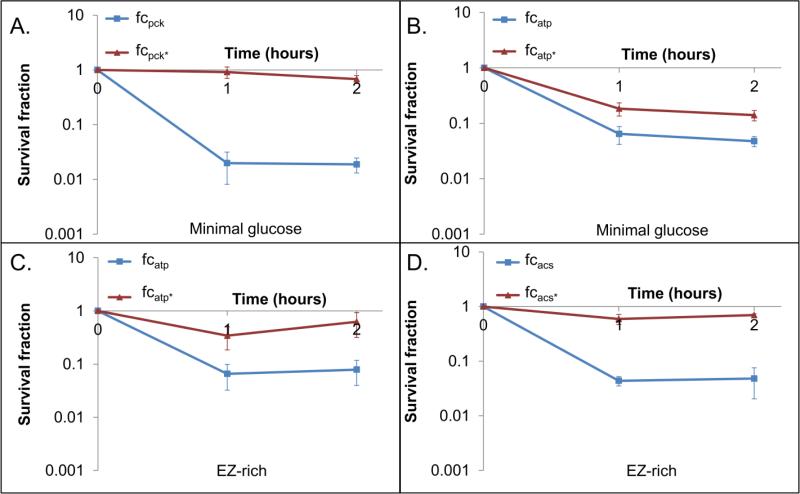
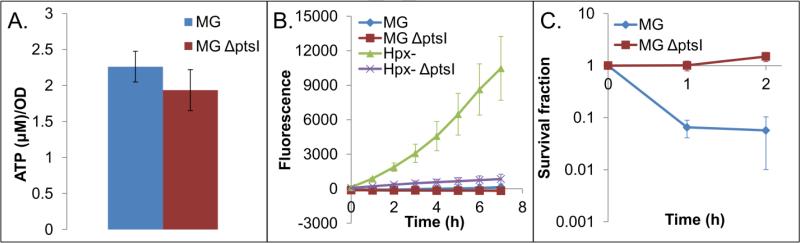
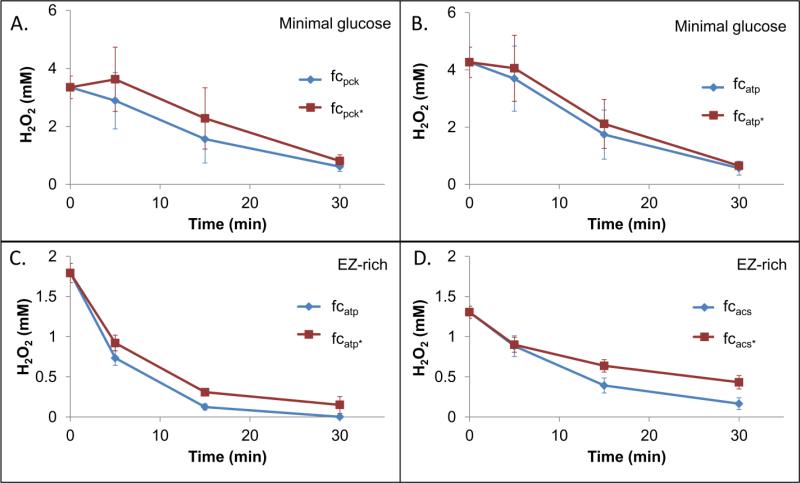
Reactive oxygen species (ROS) are toxic molecules utilized by the immune system to combat invading pathogens. Recent evidence suggests that inefficiencies in ATP production or usage can lead to increased endogenous ROS production and sensitivity to oxidative stress in bacteria. With this as inspiration, and knowledge that ATP is required for a number of DNA repair mechanisms, we hypothesized that futile cycling would be an effective way to increase sensitivity to oxidative stress. We developed a mixed integer linear optimization framework to identify experimentally-tractable futile cycles, and confirmed metabolic modeling predictions that futile cycling depresses growth rate, and increases both O2 consumption and ROS production per biomass generated. Further, intracellular ATP was decreased and sensitivity to oxidative stress increased in all actively cycling strains compared to their catalytically inactive controls. This research establishes a fundamental connection between ATP metabolism, endogenous ROS production, and tolerance toward oxidative stress in bacteria.

Keywords: Futile cycle; Hydrogen peroxide; Metabolism; Oxidative stress; Reactive oxygen species.


Figures

Figure 1
Figure 1. Futile cycle effects and cycles to be experimentally assessed
Predictions on the effect of futile cycling on growth rate (A), O2 consumption (B), and H2O2 production (C). Points represent the mean prediction of an ensemble of 100 models, and error bars show the standard deviation. The O2 and H2O2 stoichiometric coefficients used in these models can be found in Table S4. Depictions of the Ppc-Pck, acetate, and context independent ATP synthase futile cycles are shown in D, E, and F, respectively. Enzymes present during growth in minimal glucose medium are shown in gray, and the reaction required for cycling is highilighted in black.
Figure 2
Figure 2. Experimental measurement of growth rate, O2 consumption, and ATP concentration
Effect of expression of catalytically active or inactive Pck, AtpAGD, or Acs on growth rate (A), O2 consumption relative to biomass produced (B), and ATP concentration (C). All bars represent at least three biological replicates, and error bars represent standard error of the mean. In each case, the active and inactive cycles are statistically different (p<0.05). In the absence of induction, strains with plasmids encoding the active and inactive enzymes were indistinguishable with regard to growth rate and ATP measurements (Fig. S10). Cells/ml for a given OD600 were found to be equivalent for the active and inactive strains (Fig. S5), and further, the cells were found to be approximately the same size (Fig. S6 and S7).
Figure 3
Figure 3. Endogenous H2O2 production in cycling strains
H2O2 production in fcatp in minimal media (A), fcatp in rich media (B), and fcacs in rich media (C), approximated by fluorescence of resorufin vs. OD600 in an Hpx– strain. Presence of alkyl hydroperoxidase and catalases (MG1655) eliminates fluorescence in all cases. Each graph represents at least three biological replicates, and error bars show the standard error of the mean. We note that the scavenger-proficient wild-type MG1655 is able to detoxify H2O2 generated by salt-catalyzed glucose oxidation in the media (Seaver and Imlay, 2001), so the fluorescence of this strain was sometimes below that of the blank. An asterisk (*) indicates a strain expressing the catalytically inactive form of the cycle-enabling enzyme. Cells/ml for a given OD600 were found to be equivalent for the active and inactive strains (Fig. S5), and further, the cells were found to be approximately the same size (Fig. S6 and S7).
Figure 4
Figure 4. Effect of futile cycling on sensitivity to H2O2
Induced cultures were treated with H2O2 concentrations that yield at least 90% reduction in CFUs in one strain (active or inactive cycle) within 2 hours. These concentrations were 4 mM H2O2 for fcpck in MOPS 10 mM glucose medium (A), 5 mM H2O2 for fcatp in MOPS 10 mM glucose medium (B), 2 mM H2O2 for fcatp in EZ-rich 10 mM glucose medium (C), and 1.5 mM H2O2 for fcacs in EZ-rich 10 mM glucose medium (D). These assays were performed in a wild-type MG1655 background. The p-value of the log transformed values was <0.05 by hour 2 for all cycles. Uninduced (Fig. S16) and untreated (Fig. S17) controls can be found in the Supplementary material.
Figure 5
Figure 5. EffMs of growth inhibition through nutrient deprivation
ATP levels (A), H202 production (B), and sensitivity to oxidative stress in a nutrient deprived strain (MG ΔptsI mutant transferred to minimal glucose medium) (C) (p<0.05). In the sensitivity assay, cultures were treated with 12 mM H2O2, a concentration that led to at least a 90% reduction in CFUs for one of the strains. At least 3 biological replicates were performed for each experiment, and error bars represent the standard error of the mean. Untreated sensitivity assay controls can be found in Fig. S18.
Figure 6
Figure 6. H2O2 removal by cells
H2O2 concentration in the presence of cells (OD600 = 0.2) was measured at various time points. Initial concentrations were 4 mM H2O2 for fcpck in MOPS 10 mM glucose medium (A), 5 mM H2O2 for fcatp in MOPS 10 mM glucose medium (B), 2 mM H2O2 for fcatp in EZ-rich 10 mM glucose medium (C), and 1.5 mM H2O2 for fcacs in EZ-rich 10 mM glucose medium (D). Data points represent three biological replicates with error bars showing the standard error of the mean.

References

    1. Ahmad Z, Senior AE. Mutagenesis of residue betaArg-246 in the phosphate-binding subdomain of catalytic sites of Escherichia coli F1-ATPase. J Biol Chem. 2004;279:31505–13. - PubMed
    1. Ananthaswamy HN, Eisenstark A. Repair of hydrogen peroxide-induced single-strand breaks in Escherichia coli deoxyribonucleic acid. Journal of bacteriology. 1977;130:187–91. - PMC - PubMed
    1. Baba T, Ara T, Hasegawa M, Takai Y, Okumura Y, Baba M, Datsenko KA, Tomita M, Wanner BL, Mori H. Construction of Escherichia coli K-12 in-frame, single-gene knockout mutants: the Keio collection. Molecular systems biology. 2006;2006;2:0008. - PMC - PubMed
    1. Bakshi CS, Malik M, Regan K, Melendez JA, Metzger DW, Pavlov VM, Sellati TJ. Superoxide dismutase B gene (sodB)-deficient mutants of Francisella tularensis demonstrate hypersensitivity to oxidative stress and attenuated virulence. Journal of bacteriology. 2006;188:6443–8. - PMC - PubMed
    1. Brenot A, King KY, Janowiak B, Griffith O, Caparon MG. Contribution of glutathione peroxidase to the virulence of Streptococcus pyogenes. Infect Immun. 2004;72:408–13. - PMC - PubMed

Publication types

MeSH terms

Substances