

Identifying the threshold of iron deficiency in the central nervous system of the rat by the auditory brainstem response
- PMID: 25732706
- PMCID: PMC4366421
- DOI: 10.1177/1759091415569911
Identifying the threshold of iron deficiency in the central nervous system of the rat by the auditory brainstem response
Abstract
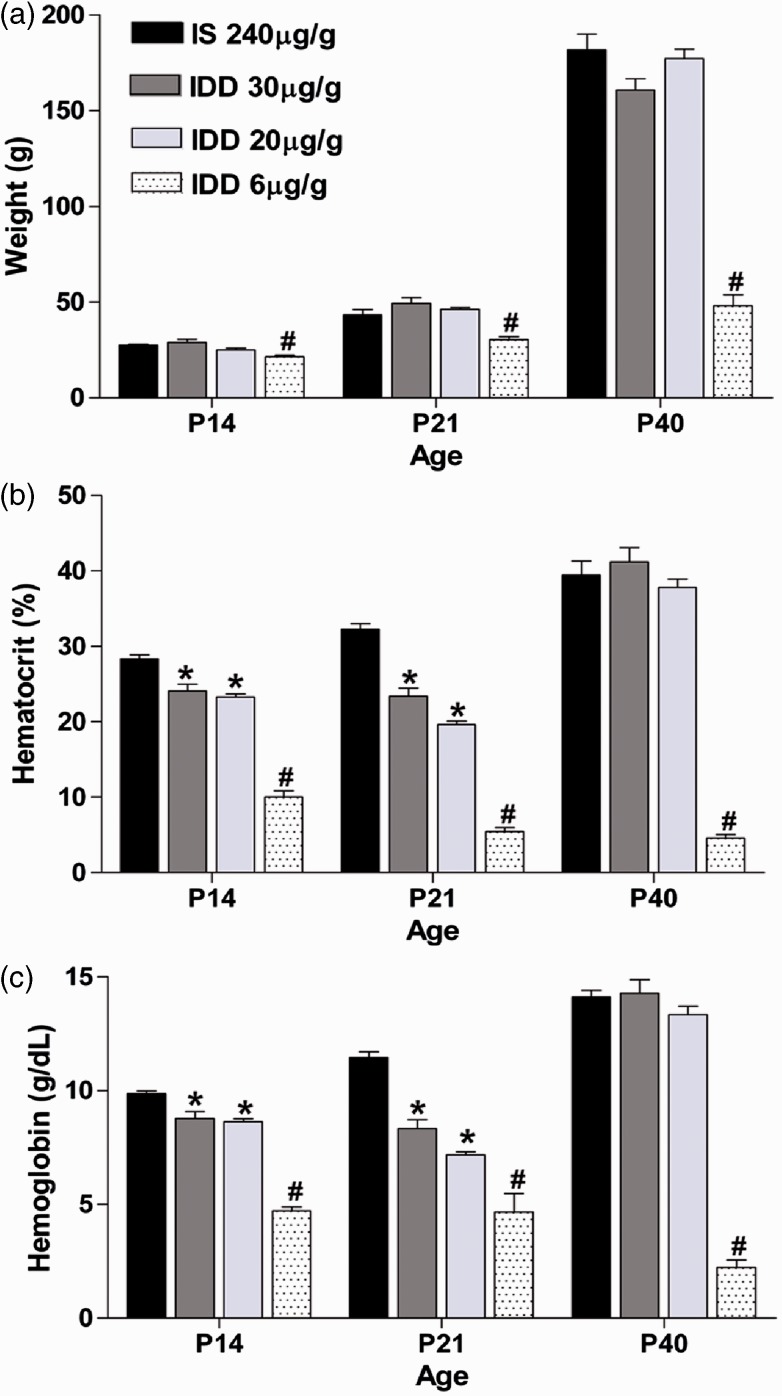
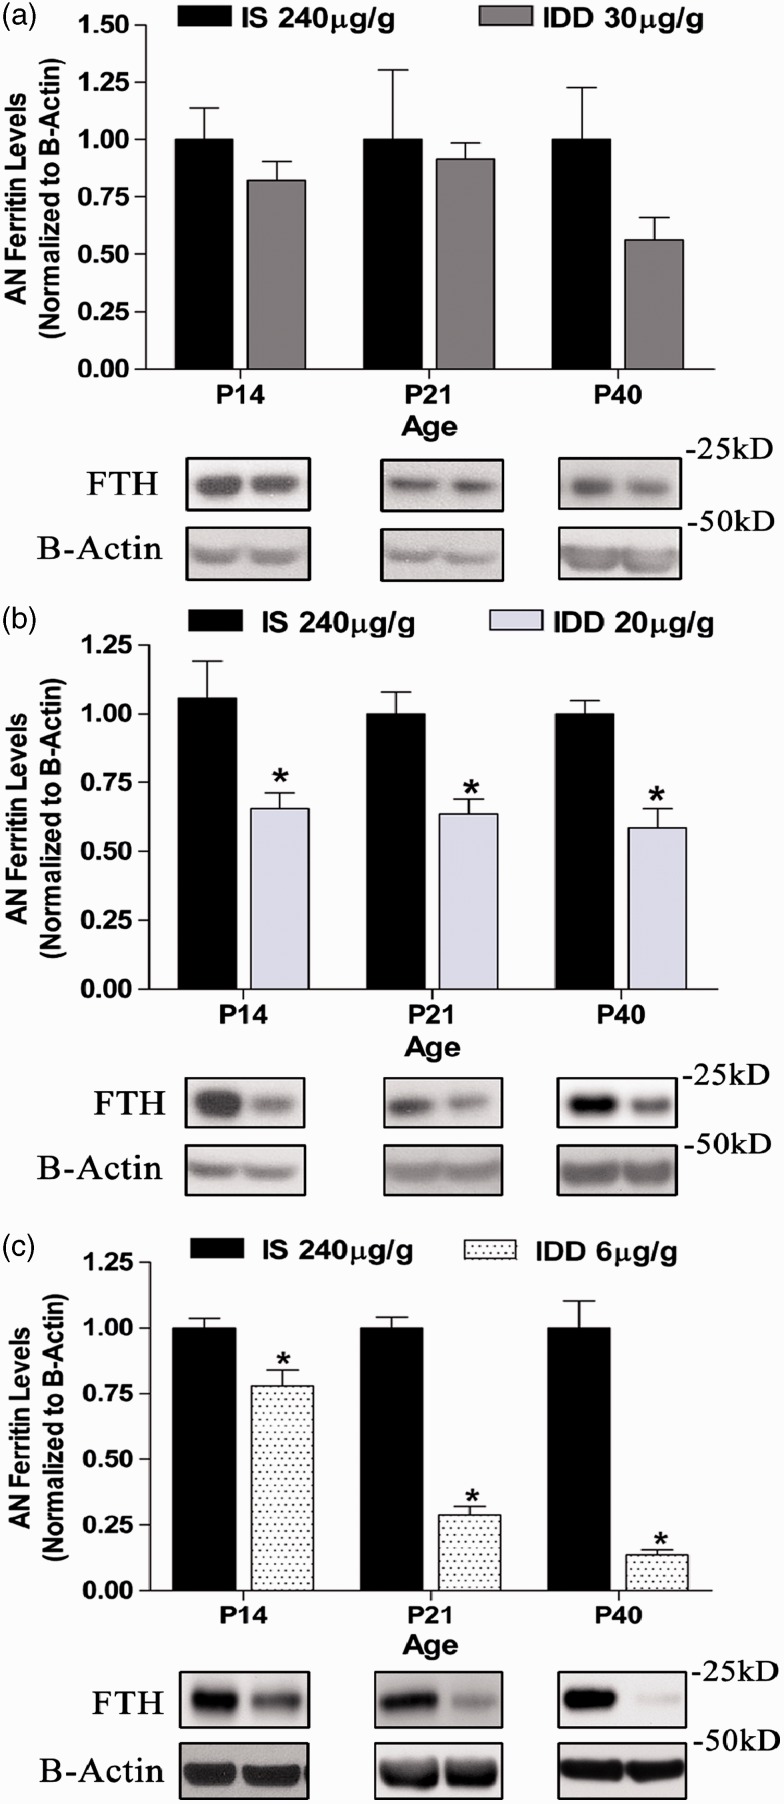
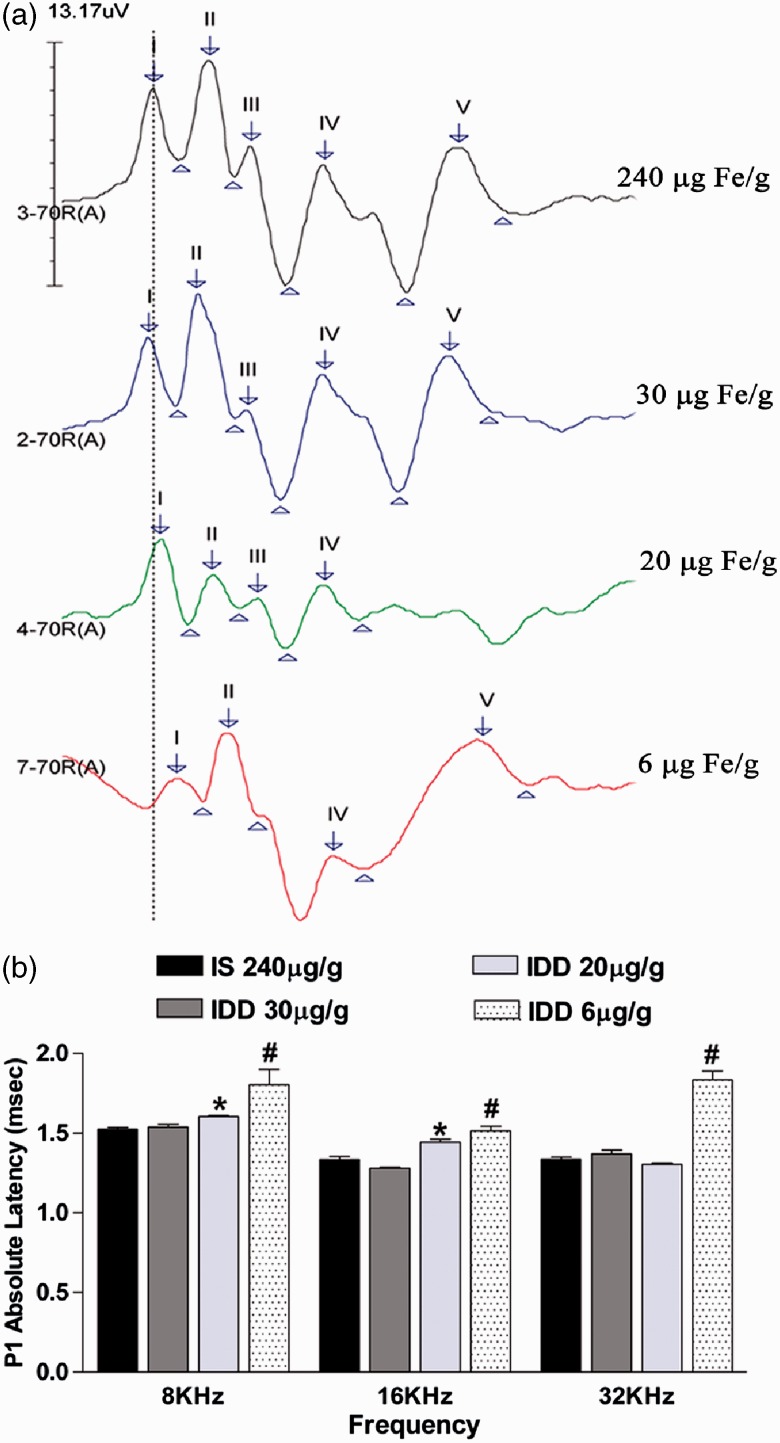
The deleterious effects of anemia on auditory nerve (AN) development have been well investigated; however, we have previously reported that significant functional consequences in the auditory brainstem response (ABR) can also occur as a consequence of marginal iron deficiency (ID). As the ABR has widespread clinical use, we evaluated the ability of this electrophysiological method to characterize the threshold of tissue ID in rats by examining the relationship between markers of tissue ID and severity of ABR latency defects. To generate various levels of ID, female Long-Evans rats were exposed to diets containing sufficient, borderline, or deficient iron (Fe) concentrations throughout gestation and offspring lifetime. We measured hematological indices of whole body iron stores in dams and offspring to assess the degree of ID. Progression of AN ID in the offspring was measured as ferritin protein levels at different times during postnatal development to complement ABR functional measurements. The severity of ABR deficits correlated with the level of Fe restriction in each diet. The sufficient Fe diet did not induce AN ID and consequently did not show an impaired ABR latency response. The borderline Fe diet, which depleted AN Fe stores but did not cause systemic anemia resulted in significantly increased ABR latency isolated to Peak I.The low Fe diet, which induced anemia and growth retardation, significantly increased ABR latencies of Peaks I to IV. Our findings indicate that changes in the ABR could be related to various degrees of ID experienced throughout development.
Figures
References
-
- Algarin C., Peirano P., Garrido M., Pizarro F., Lozoff B. (2003) Iron deficiency anemia in infancy: Long-lasting effects on auditory and visual system functioning. Pediatric Research 53: 217–223. - PubMed
-
- Amin S. B., Orlando M., Wang H. (2013) Latent iron deficiency in utero is associated with abnormal auditory neural myelination in >/= 35 weeks gestational age infants. The Journal of Pediatrics 163: 1267–1271. - PubMed
-
- Andersen H. S., Gambling L., Holtrop G., McArdle H. J. (2006) Maternal iron deficiency identifies critical windows for growth and cardiovascular development in the rat postimplantation embryo. The Journal of Nutrition 136: 1171–1177. - PubMed
Publication types
MeSH terms
Substances
Grants and funding
LinkOut - more resources
Full Text Sources
Other Literature Sources
Research Materials
