. 2015 Mar 3;10(8):1386-97.
doi: 10.1016/j.celrep.2015.02.001. Epub 2015 Feb 26.

Single-cell DNA methylome sequencing and bioinformatic inference of epigenomic cell-state dynamics

Affiliations

Single-cell DNA methylome sequencing and bioinformatic inference of epigenomic cell-state dynamics

Matthias Farlik et al. Cell Rep. .

Abstract

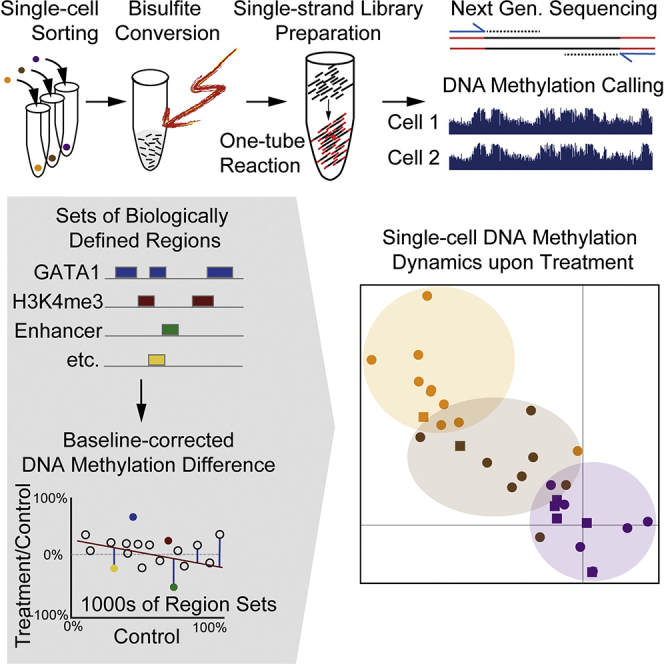
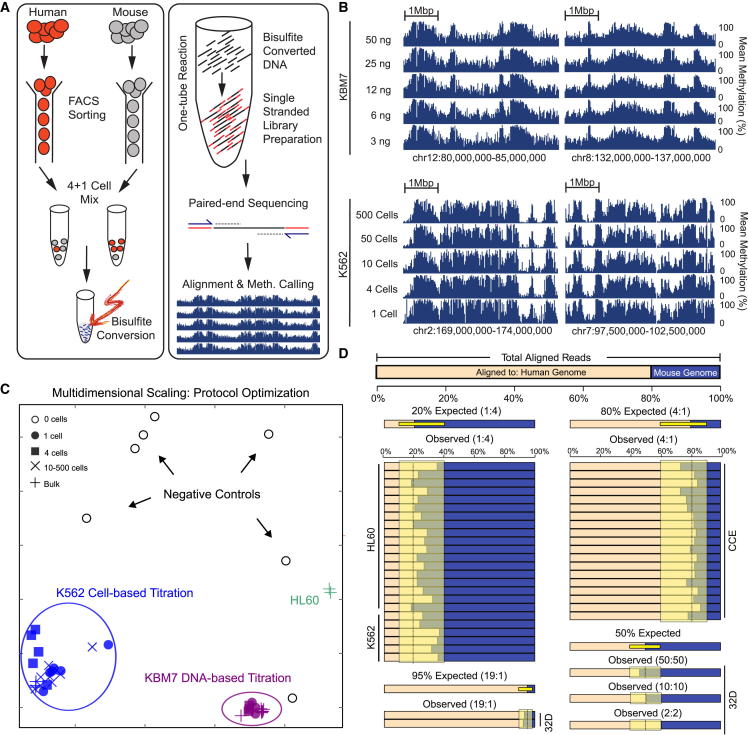
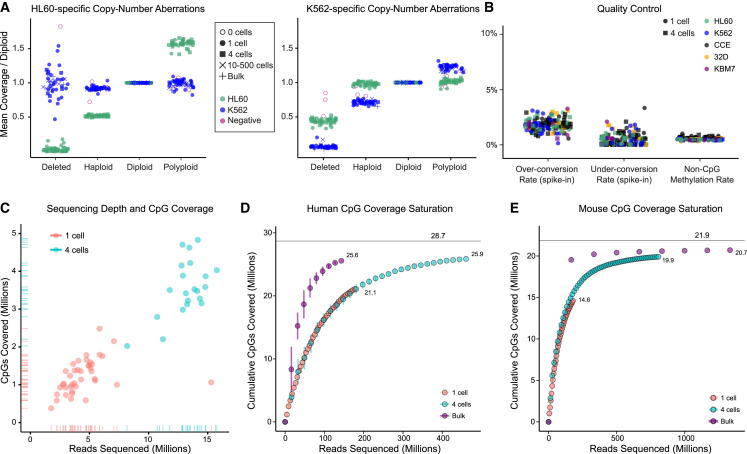
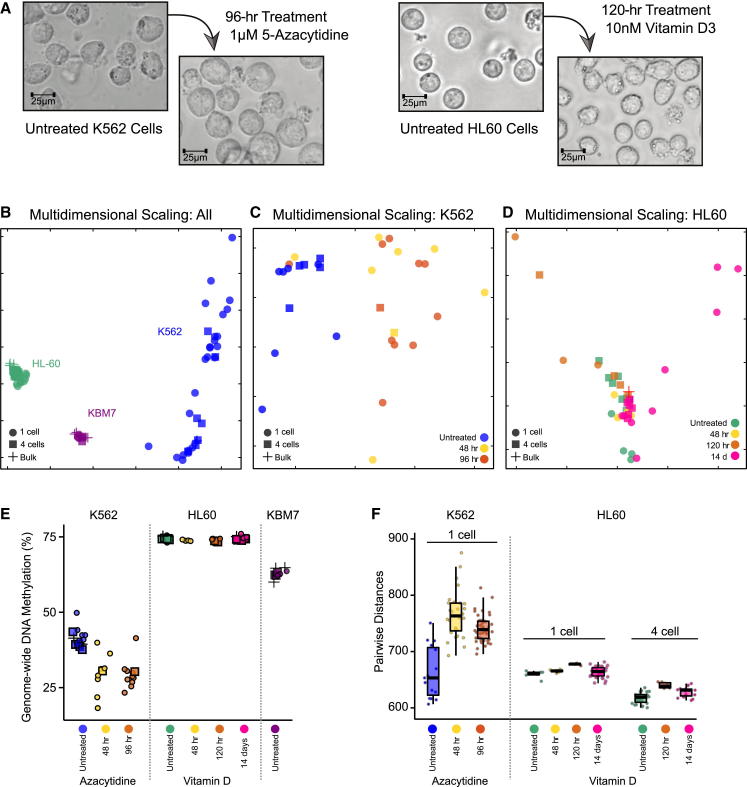
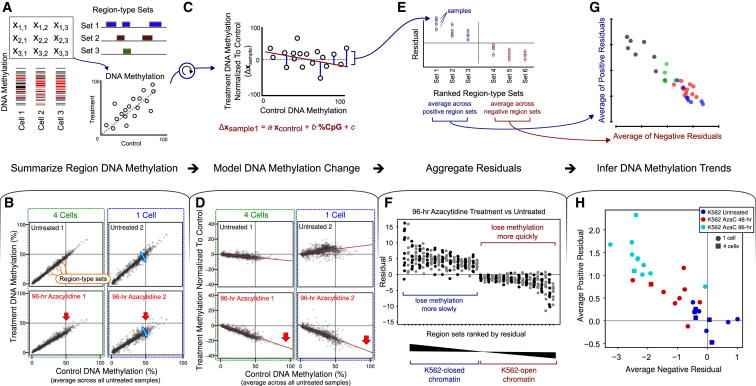
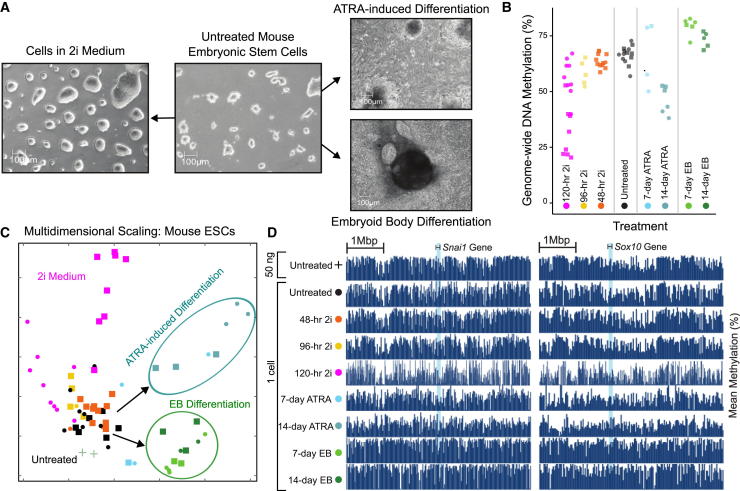
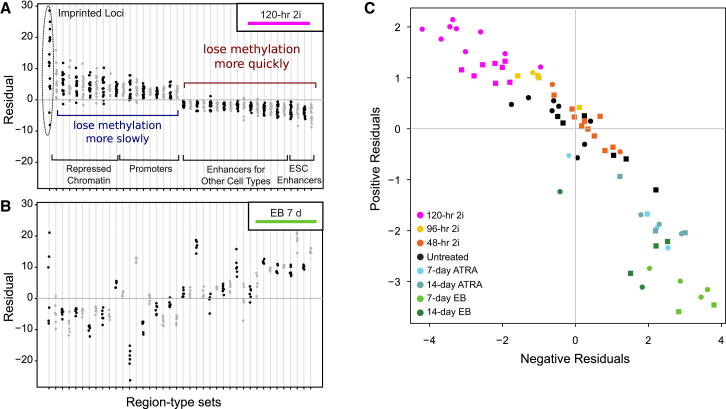
Methods for single-cell genome and transcriptome sequencing have contributed to our understanding of cellular heterogeneity, whereas methods for single-cell epigenomics are much less established. Here, we describe a whole-genome bisulfite sequencing (WGBS) assay that enables DNA methylation mapping in very small cell populations (μWGBS) and single cells (scWGBS). Our assay is optimized for profiling many samples at low coverage, and we describe a bioinformatic method that analyzes collections of single-cell methylomes to infer cell-state dynamics. Using these technological advances, we studied epigenomic cell-state dynamics in three in vitro models of cellular differentiation and pluripotency, where we observed characteristic patterns of epigenome remodeling and cell-to-cell heterogeneity. The described method enables single-cell analysis of DNA methylation in a broad range of biological systems, including embryonic development, stem cell differentiation, and cancer. It can also be used to establish composite methylomes that account for cell-to-cell heterogeneity in complex tissue samples.


Figures

None
Graphical abstract
Figure 1
Figure 1
A Workflow for Single-Cell Methylome Sequencing (A) Overview of the workflow. Defined numbers of human and mouse cells are sorted by FACS and the DNA is bisulfite converted directly on lysed cells, followed by single-strand library preparation and paired-end sequencing. (B) DNA methylation profiles for four representative genomic regions, plotting the mean DNA methylation levels for windows of 20 kb. The y axis follows the DNA input titration in KBM7 cells (upper panel) and the cell-based titration in K562 cells (lower panel). (C) Multidimensional scaling (MDS) analysis for average DNA methylation levels of 1-kb tiling regions in DNA-based and cell-based titration samples. (D) Expected and observed alignment rates for representative samples that passed quality-control filtering. The yellow zones indicate the range of expected values for the ratio of reads aligned to the human and mouse genomes. See also Figure S1 and Table S1.
Figure 2
Figure 2
Performance Evaluation of Single-Cell Methylome Sequencing (A) Strip charts demonstrating concordance between the expected copy-number aberrations in HL60 and K562 cancer cell lines (based on published data) and the observed sequencing coverage. (B) Estimated rates of bisulfite over-conversion and under-conversion based on methylated and unmethylated oligonucleotides used as spike-in controls. (C) Scatterplot illustrating the relationship between CpG coverage and sequencing depth for individual one-cell and four-cell human samples. Marginal distributions are plotted as hash marks (rugs) along the axes (see Figure S2 for additional details). (D) Saturation plot illustrating the relationship between CpG coverage and sequencing depth when combining multiple human samples. Plots show the number of unique CpGs covered (y axis) as a function of aligned reads (x axis). Points are averages across ten iterations adding the individual samples in random order, and the corresponding SDs of CpG coverage are plotted as vertical error bars. (E) Same as (D) but for mouse samples. See also Figures S2 and S3 and Table S2.
Figure 3
Figure 3
Single-Cell DNA Methylation Dynamics in Drug-Treated and Differentiation-Induced Cell Lines (A) Bright-field microscopy images of two in vitro models for changes in cell state: K562 cells treated with azacytidine, and HL60 cells treated with vitamin D3. (B) MDS analysis for average DNA methylation levels of 1-kb tiling regions in human hematopoietic cell line samples. (C) MDS analysis for K562 cells treated with azacytidine. (D) MDS analysis for HL60 cells treated with vitamin D3. (E) Strip charts showing global DNA methylation levels for each sample. (F) Analysis of pairwise Euclidian distances between individual K562 and HL60 samples.
Figure 4
Figure 4
A Bioinformatic Method for Analyzing Low-Coverage and Single-Cell Methylome Data (A) Aggregation of single-cell DNA methylation data using several thousand biologically defined genomic region sets obtained from public databases. (B) Scatterplots comparing individual one-cell and four-cell samples against the average calculated across all untreated control samples. The dots represent mean DNA methylation levels across all regions in a given set. Two representative control samples (top row) and two representative 96-hr azacytidine samples (bottom row) are shown. (C) Correction for systematic global effects among the observed DNA methylation differences. After normalizing to control methylation, a linear model is fitted to model change in DNA methylation level of one individual sample while controlling for the effects of CpG content and DNA methylation level in the untreated control samples. (D) Scatterplots of the DNA methylation change observed in individual samples plotted against the mean DNA methylation levels among all untreated samples. Each dot represents a region set. (E) By comparing across individual treated samples, one can identify region sets that show significantly higher (left) or lower (right) DNA methylation levels than expected based on the linear model. (F) Positive and negative residuals for region sets with significantly higher or lower DNA methylation levels in comparison to the prediction of the linear model in K562 cells. Alternating black and gray coloring is for visualization purposes only. Region sets with consistently positive residuals across samples (left) comprise genomic regions for which DNA methylation is decreasing less quickly with treatment than expected based on the initial DNA methylation state. Negative residuals (right) indicate regions that lose methylation more quickly than expected. The full list of region types is available in Figure S4. (G) Scatterplot derived by averaging the positive (y axis) and negative (x axis) residuals for each individual sample based on the region sets that are significantly different from expectation. (H) Scatterplot comparing the 96-hr samples and the untreated controls, with 48-hr samples superimposed. See also Figure S4.
Figure 5
Figure 5
Single-Cell Analysis of Epigenome Remodeling in Pluripotent and Differentiating ESCs (A) Bright-field microscopy images of mouse ESCs (CCE cell line) cultured in feeder-free serum conditions with LIF (center), after 120 hr in 2i medium (left), and after differentiation induced by ATRA treatment (top right) or by embryoid body (EB) formation (bottom right). (B) Strip charts showing global DNA methylation levels for each sample and time point. (C) MDS analysis for average DNA methylation levels of 1-kb tiling regions in mouse ESC derived samples. (D) DNA methylation profiles for genomic regions associated with two neural differentiation genes, plotting the mean DNA methylation levels for windows of 20 kb. See also Figure S5.
Figure 6
Figure 6
Identification of Key Regulatory Regions and Inference of Epigenomic Cell-State Dynamics for Pluripotent and Differentiating ESCs (A) Residual plot identifying region types with significant differences in DNA methylation between ESCs cultured in 2i medium for 120 hr and untreated samples as controls. The full list is available in Figure S6. (B) Residual plot based on the same regions as in (A), but showing 7-day EB samples compared with untreated samples. (C) Lineage plot displaying all mouse ESC-derived samples according to the sum of the significant residuals between ESCs cultured in 2i medium for 120 hr and the untreated control samples. See also Figure S6.

References

    1. Adey A., Shendure J. Ultra-low-input, tagmentation-based whole-genome bisulfite sequencing. Genome Res. 2012;22:1139–1143. - PMC - PubMed
    1. Assenov Y., Müller F., Lutsik P., Walter J., Lengauer T., Bock C. Comprehensive analysis of DNA methylation data with RnBeads. Nat. Methods. 2014;11:1138–1140. - PMC - PubMed
    1. Bernstein B.E., Meissner A., Lander E.S. The mammalian epigenome. Cell. 2007;128:669–681. - PubMed
    1. Birnie G.D. The HL60 cell line: a model system for studying human myeloid cell differentiation. Br. J. Cancer Suppl. 1988;9:41–45. - PMC - PubMed
    1. Bock C. Analysing and interpreting DNA methylation data. Nat. Rev. Genet. 2012;13:705–719. - PubMed

Publication types

MeSH terms